| Param | Original file | Final file |
|---|---|---|
| Filename | modeM0/AS1A13_009T02_9000005914_43918cztM0_level2.fits | modeM0/AS1A13_009T02_9000005914_43918cztM0_level2_quad_clean.evt |
| Size (bytes) | 757,310,400 | 126,368,640 |
| Size | 722.2 MB | 120.5 MB |
| Events in quadrant A | 12,037,442 | 640,494 |
| Events in quadrant B | 4,738,019 | 927,126 |
| Events in quadrant C | 3,952,225 | 895,728 |
| Events in quadrant D | 6,646,268 | 771,691 |
| Mode M9 | |||
|---|---|---|---|
| Quadrant | BADHDUFLAG | Total packets | Discarded packets |
| A | 0 | 14 | 0 |
| B | 0 | 14 | 0 |
| C | 0 | 14 | 0 |
| D | 0 | 14 | 0 |
| Mode SS | |||
|---|---|---|---|
| Quadrant | BADHDUFLAG | Total packets | Discarded packets |
| A | 0 | 176 | 0 |
| B | 0 | 176 | 0 |
| C | 0 | 176 | 0 |
| D | 0 | 176 | 0 |
| Mode M0 | |||
|---|---|---|---|
| Quadrant | BADHDUFLAG | Total packets | Discarded packets |
| A | 0 | 41832 | 2 |
| B | 0 | 19855 | 2 |
| C | 0 | 17649 | 2 |
| D | 0 | 25785 | 2 |
| Quadrant | Total seconds | Saturated seconds | Saturation percentage |
|---|---|---|---|
| A | 8502 | 2858 | 33.615620% |
| B | 8502 | 236 | 2.775817% |
| C | 8503 | 65 | 0.764436% |
| D | 8502 | 662 | 7.786403% |
Noise dominated data is calculated using 1-second bins in cleaned event files. If a bin has >2000 counts, and if more than 50% of those come from <1% of pixels, then it is considered to be noise-dominated and hence unusable.
| Quadrant | # 1 sec bins | Bins with >0 counts | Bins with >2000 counts | High rate bins dominated by noise | Noise dominated (total time) | Noise dominated (detector-on time) | Marked lightcurve |
|---|---|---|---|---|---|---|---|
| A | 10022 | 8504 | 2478 | 2478 | 24.73% | 29.14% | 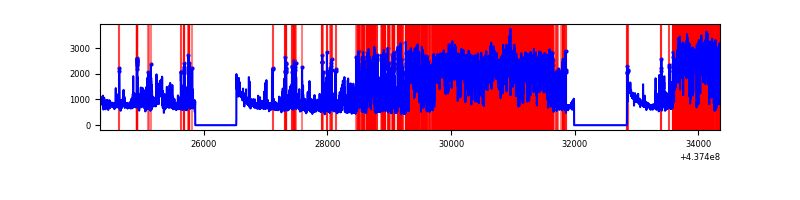 |
| B | 10022 | 8504 | 69 | 69 | 0.69% | 0.81% | 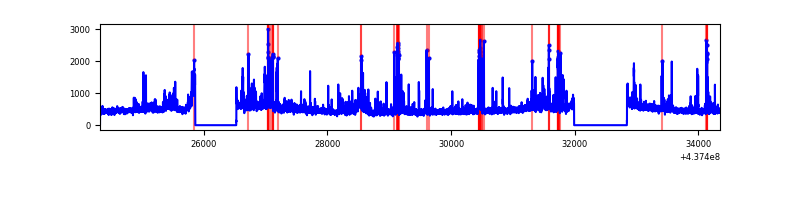 |
| C | 10023 | 8505 | 9 | 9 | 0.09% | 0.11% | 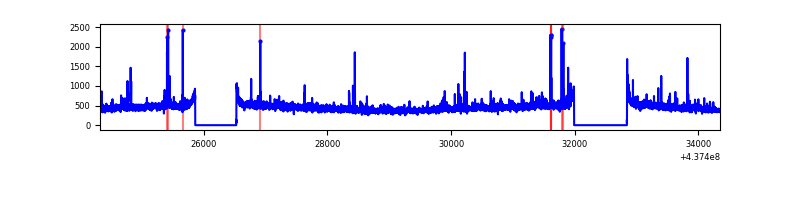 |
| D | 10022 | 8504 | 531 | 531 | 5.30% | 6.24% | 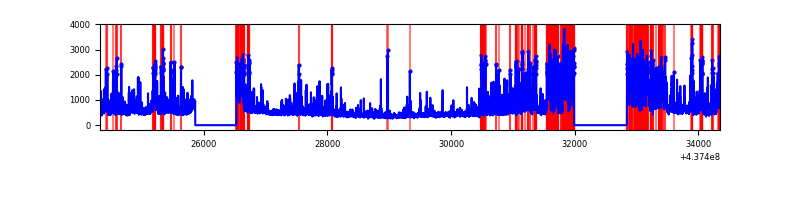 |
Top three noisy pixels from each quadrant. If the there are fewer than three noisy pixels in the level2.evt file, extra rows are filled as -1
| Pixel properties | Quadrant properties | ||||||
|---|---|---|---|---|---|---|---|
| Quadrant | DetID | PixID | Counts | Sigma | Mean | Median | Sigma |
| A | 15 | 222 | 3900091 | 22862.12 | 818 | 802 | 170.6 |
| A | 15 | 223 | 2883229 | 16900.1 | 818 | 802 | 170.6 |
| A | 10 | 83 | 1241316 | 7273.32 | 818 | 802 | 170.6 |
| B | 5 | 235 | 503791 | 2651.91 | 954 | 923 | 189.6 |
| B | 5 | 172 | 180395 | 946.46 | 954 | 923 | 189.6 |
| B | 0 | 183 | 94636 | 494.2 | 954 | 923 | 189.6 |
| C | 3 | 233 | 73758 | 328.74 | 943 | 948 | 221.5 |
| C | 10 | 22 | 54448 | 241.55 | 943 | 948 | 221.5 |
| C | 14 | 254 | 46290 | 204.72 | 943 | 948 | 221.5 |
| D | 1 | 52 | 1486815 | 6532.12 | 911 | 883 | 227.5 |
| D | 5 | 235 | 358560 | 1572.34 | 911 | 883 | 227.5 |
| D | 12 | 233 | 357426 | 1567.35 | 911 | 883 | 227.5 |
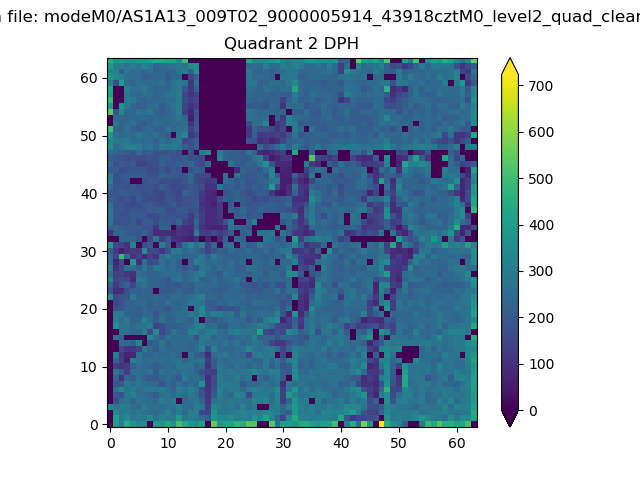
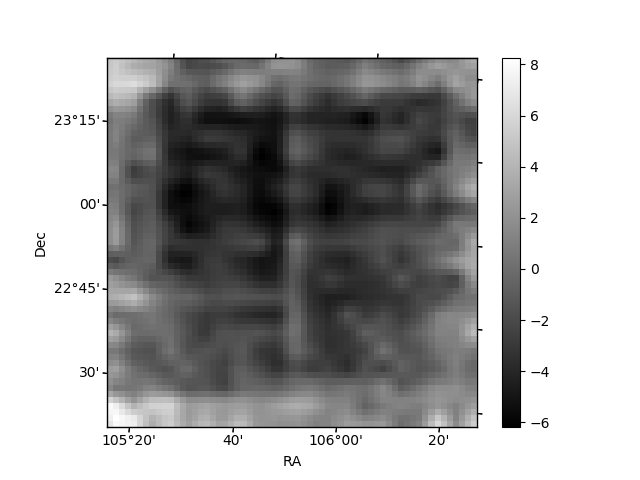
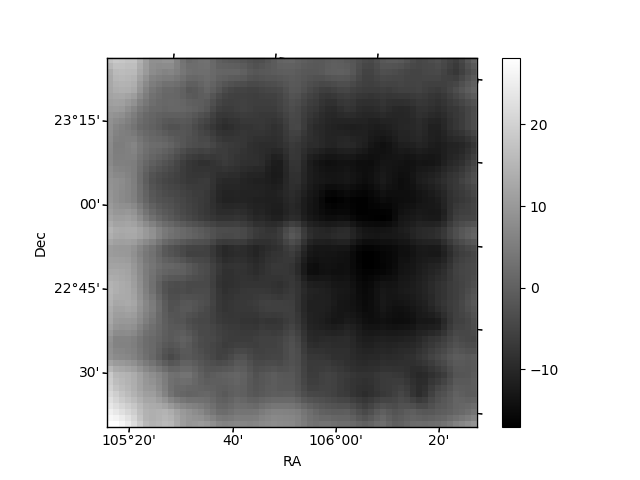
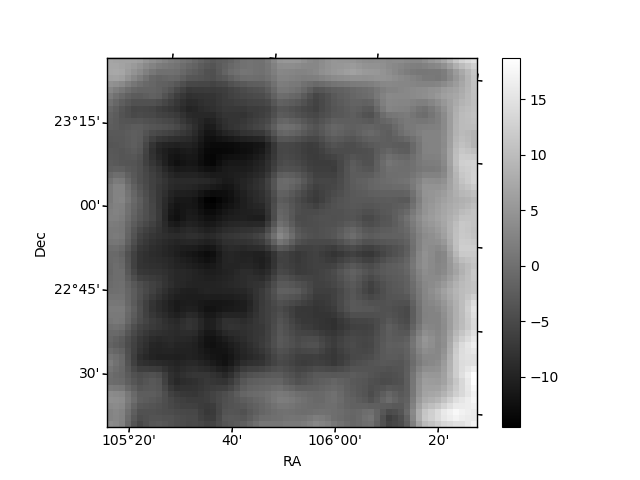
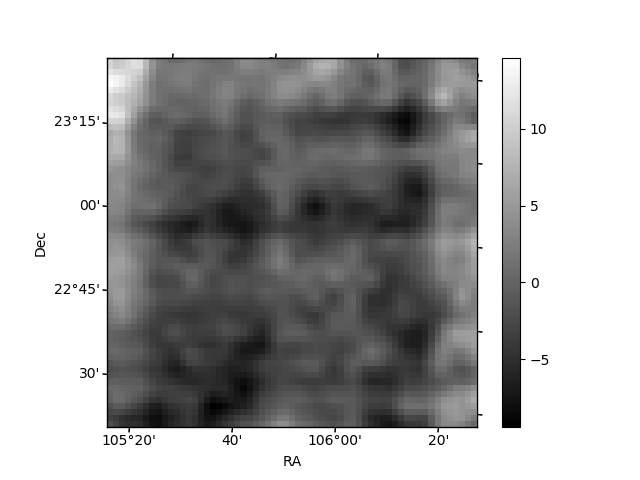
Histogram calculated using DETX and DETY for each event in the final _common_clean file
| Quadrant A |  |
 |
Quadrant B |
|---|---|---|---|
| Quadrant D |  |
 |
Quadrant C |
| Plot type | Count rate plots | Images |
|---|---|---|
| Comparison with Poisson distribution Blue bars denote a histogram of data divided into 1 sec bins. Red curve is a Poisson curve with rate = median count rate of data. |
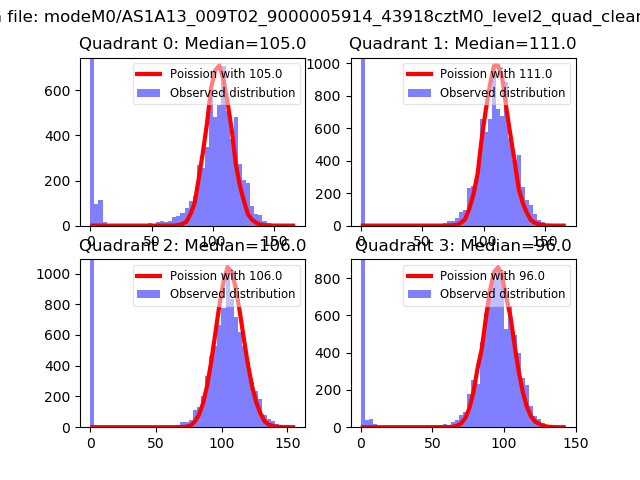 |
 |
| Quadrant-wise count rates Data is divided into 100 sec bins |
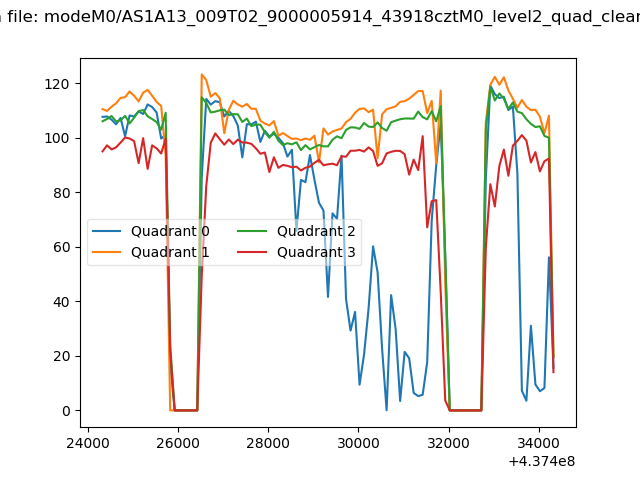 |
|
| Module-wise count rates for Quadrant A Data is divided into 100 sec bins |
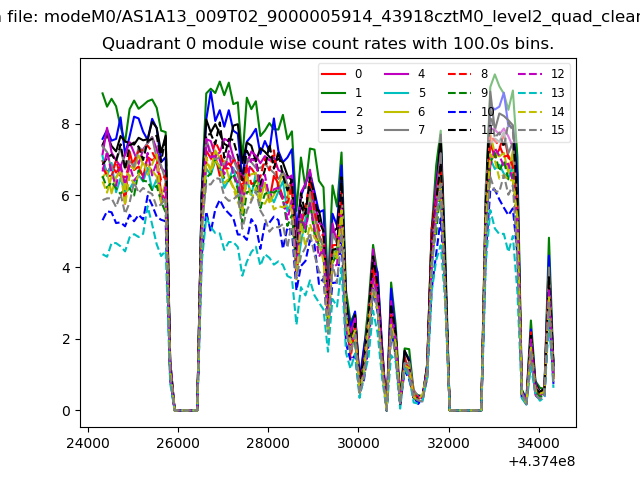 |
 |
| Module-wise count rates for Quadrant B Data is divided into 100 sec bins |
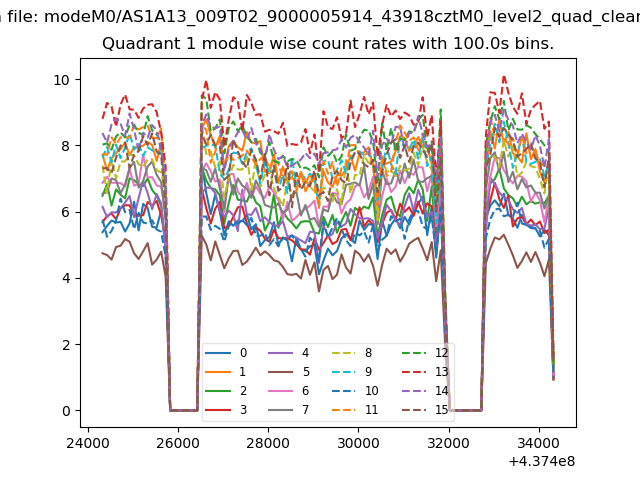 |
 |
| Module-wise count rates for Quadrant C Data is divided into 100 sec bins |
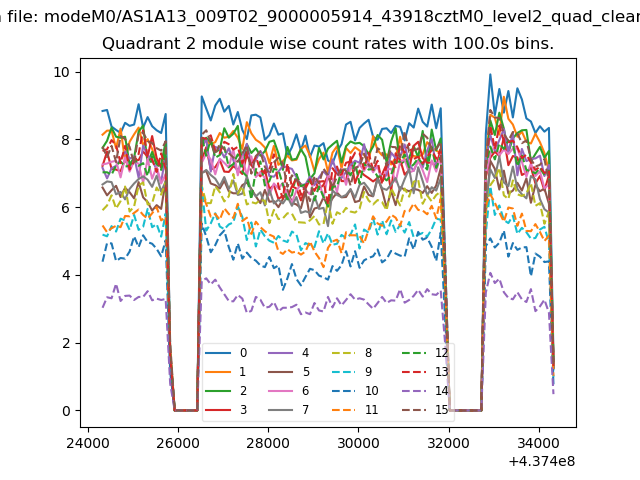 |
 |
| Module-wise count rates for Quadrant D Data is divided into 100 sec bins |
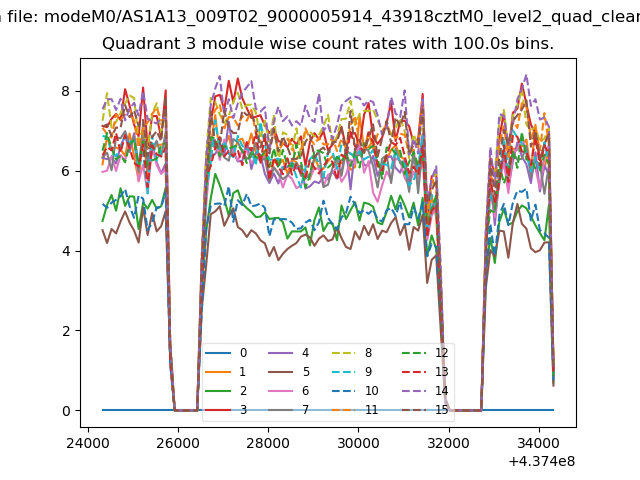 |
 |
| Parameter | Plot |
|---|---|
| CZT HV Monitor | 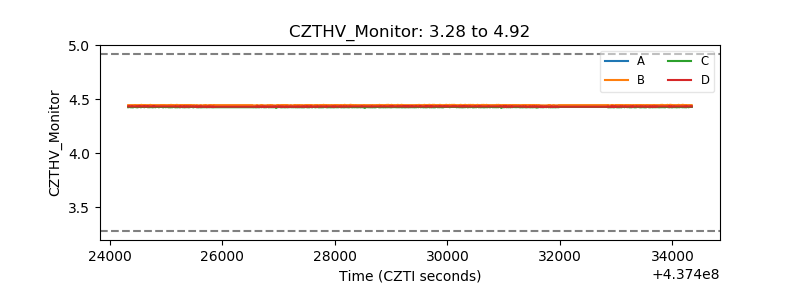 |
| D_VDD | 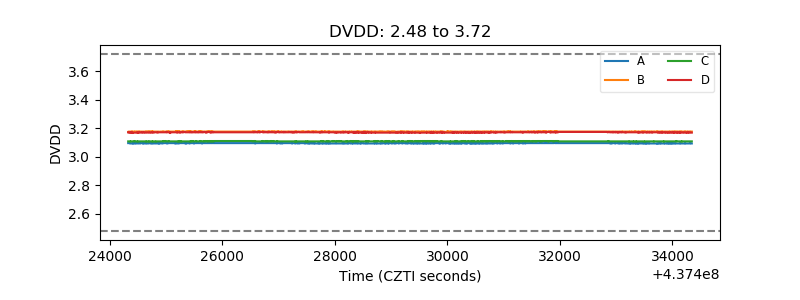 |
| Temperature 1 | 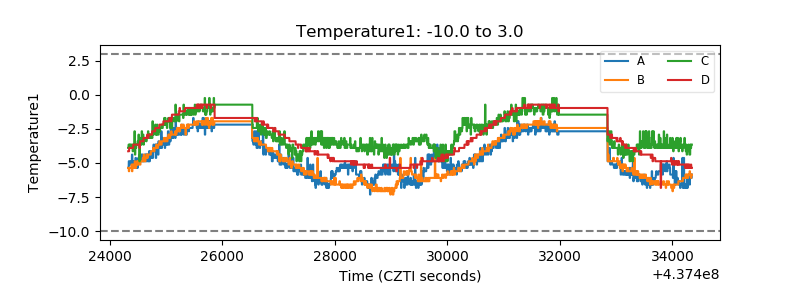 |
| Veto HV Monitor | 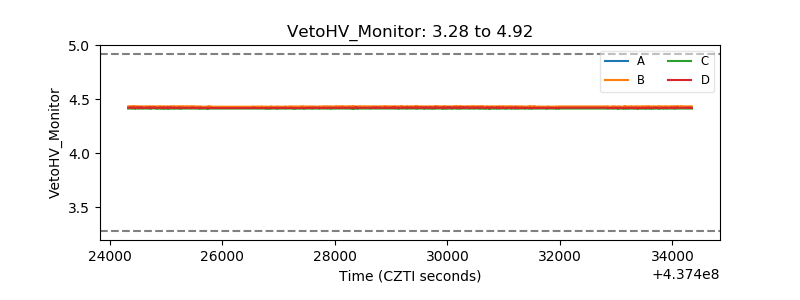 |
| Veto LLD | 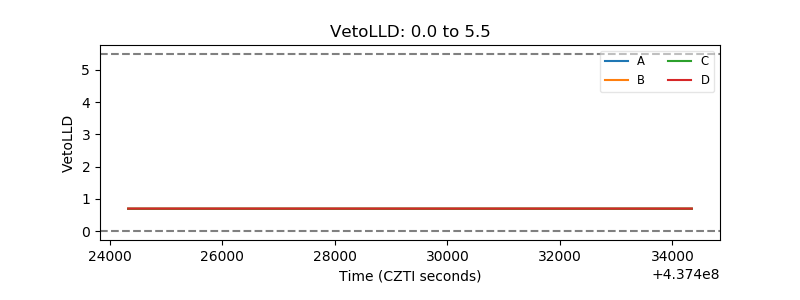 |
| Alpha Counter | 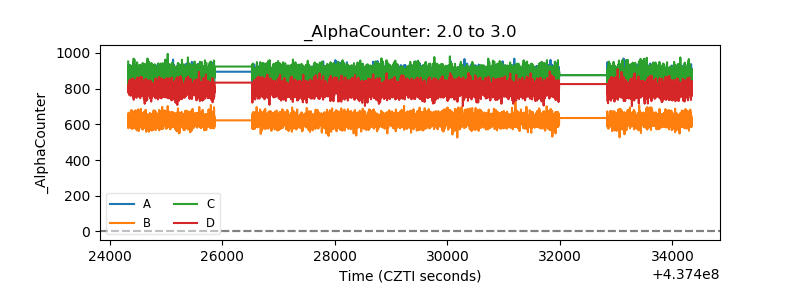 |
| _CPM_Rate | 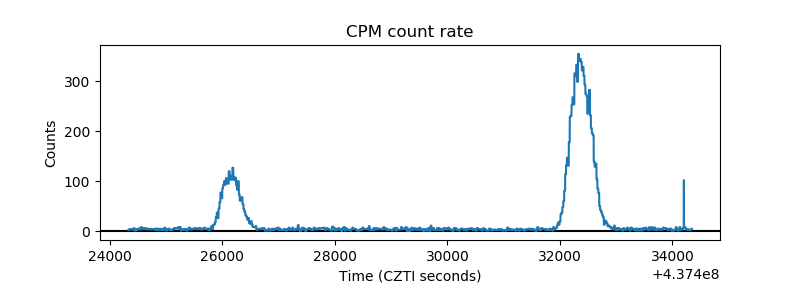 |
| CZT Counter | 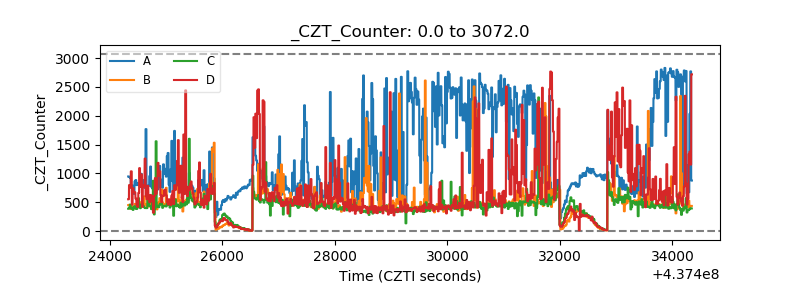 |
| +2.5 Volts monitor | 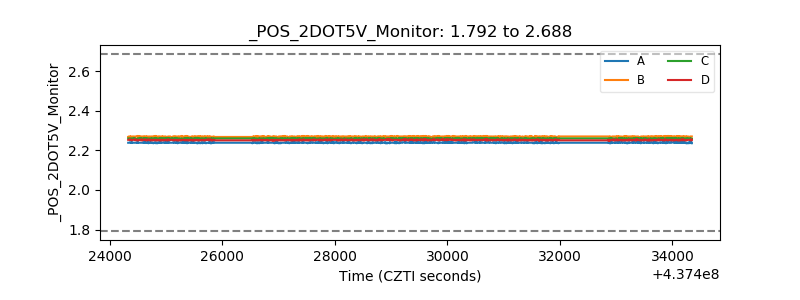 |
| +5 Volts monitor | 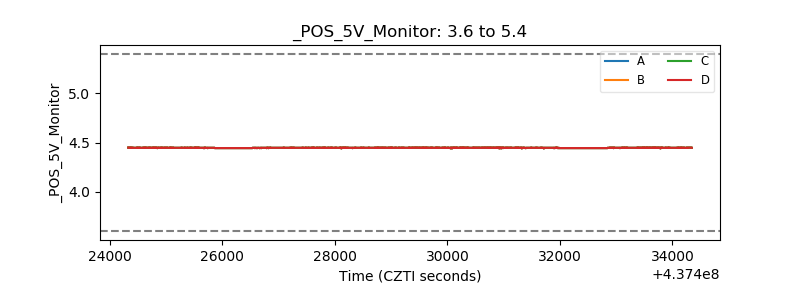 |
| _ROLL_ROT | 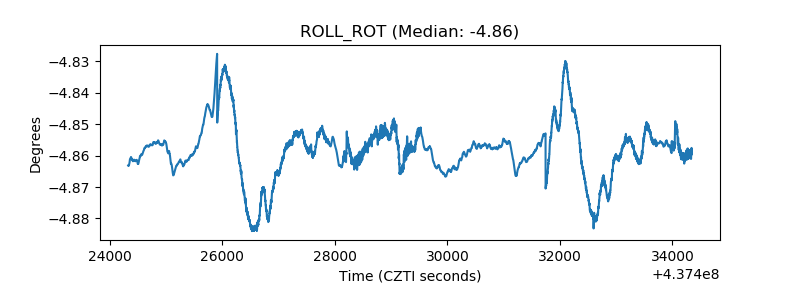 |
| _Roll_DEC | 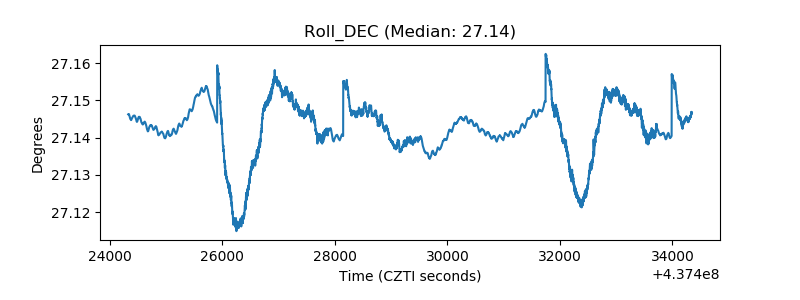 |
| _Roll_RA | 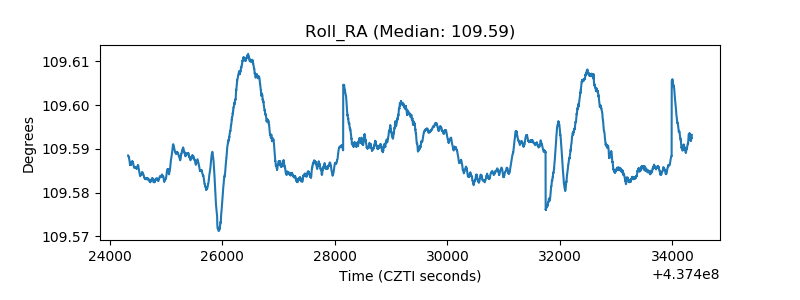 |
| Veto Counter | 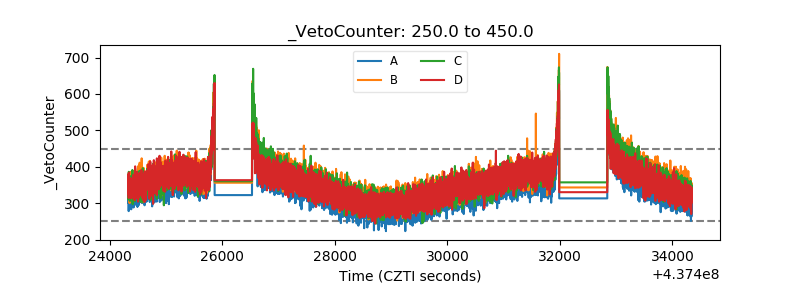 |