| Param | Original file | Final file |
|---|---|---|
| Filename | modeM0/AS1A13_009T02_9000005914_43919cztM0_level2.fits | modeM0/AS1A13_009T02_9000005914_43919cztM0_level2_quad_clean.evt |
| Size (bytes) | 431,524,800 | 69,068,160 |
| Size | 411.5 MB | 65.9 MB |
| Events in quadrant A | 7,129,959 | 341,378 |
| Events in quadrant B | 2,344,335 | 509,473 |
| Events in quadrant C | 2,015,657 | 486,174 |
| Events in quadrant D | 4,121,298 | 426,945 |
| Mode M9 | |||
|---|---|---|---|
| Quadrant | BADHDUFLAG | Total packets | Discarded packets |
| A | 0 | 3 | 0 |
| B | 0 | 4 | 0 |
| C | 0 | 4 | 0 |
| D | 0 | 4 | 0 |
| Mode SS | |||
|---|---|---|---|
| Quadrant | BADHDUFLAG | Total packets | Discarded packets |
| A | 0 | 94 | 0 |
| B | 0 | 94 | 0 |
| C | 0 | 94 | 0 |
| D | 0 | 94 | 0 |
| Mode M0 | |||
|---|---|---|---|
| Quadrant | BADHDUFLAG | Total packets | Discarded packets |
| A | 0 | 24501 | 1 |
| B | 0 | 10254 | 1 |
| C | 0 | 9523 | 1 |
| D | 0 | 15470 | 1 |
| Quadrant | Total seconds | Saturated seconds | Saturation percentage |
|---|---|---|---|
| A | 4655 | 1702 | 36.562836% |
| B | 4655 | 41 | 0.880773% |
| C | 4655 | 4 | 0.085929% |
| D | 4655 | 288 | 6.186896% |
Noise dominated data is calculated using 1-second bins in cleaned event files. If a bin has >2000 counts, and if more than 50% of those come from <1% of pixels, then it is considered to be noise-dominated and hence unusable.
| Quadrant | # 1 sec bins | Bins with >0 counts | Bins with >2000 counts | High rate bins dominated by noise | Noise dominated (total time) | Noise dominated (detector-on time) | Marked lightcurve |
|---|---|---|---|---|---|---|---|
| A | 4655 | 4655 | 1552 | 1552 | 33.34% | 33.34% | 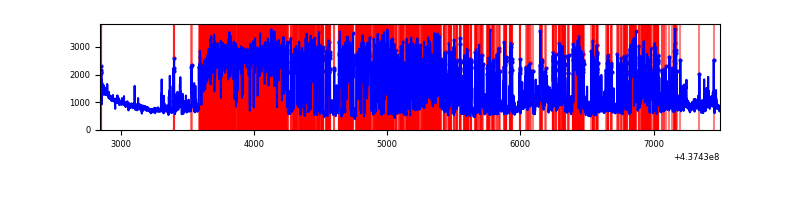 |
| B | 4655 | 4655 | 26 | 26 | 0.56% | 0.56% | 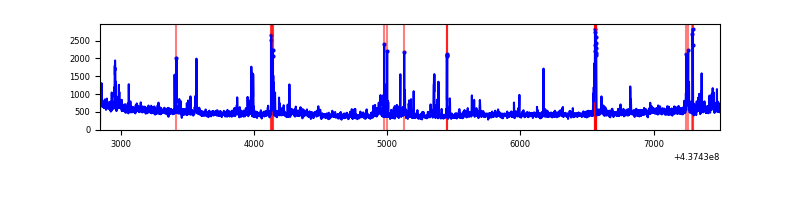 |
| C | 4655 | 4655 | 0 | 0 | 0.00% | 0.00% | 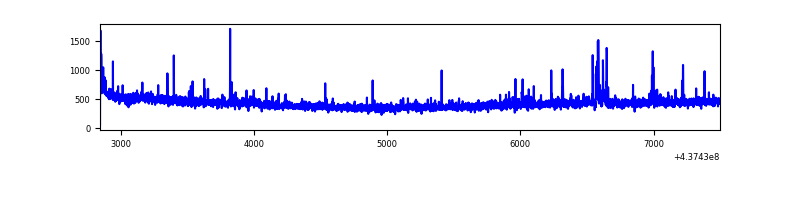 |
| D | 4655 | 4655 | 289 | 289 | 6.21% | 6.21% | 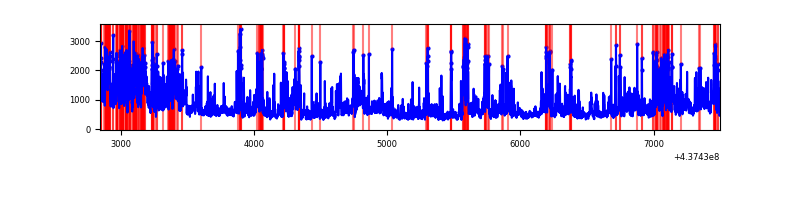 |
Top three noisy pixels from each quadrant. If the there are fewer than three noisy pixels in the level2.evt file, extra rows are filled as -1
| Pixel properties | Quadrant properties | ||||||
|---|---|---|---|---|---|---|---|
| Quadrant | DetID | PixID | Counts | Sigma | Mean | Median | Sigma |
| A | 15 | 222 | 3801449 | 44915.63 | 401 | 393 | 84.6 |
| A | 15 | 223 | 1063090 | 12557.49 | 401 | 393 | 84.6 |
| A | 10 | 83 | 607313 | 7171.74 | 401 | 393 | 84.6 |
| B | 5 | 235 | 118638 | 1185.21 | 498 | 483 | 99.7 |
| B | 5 | 172 | 90895 | 906.92 | 498 | 483 | 99.7 |
| B | 0 | 199 | 62962 | 626.72 | 498 | 483 | 99.7 |
| C | 3 | 233 | 19841 | 166.84 | 488 | 491 | 116.0 |
| C | 14 | 254 | 18758 | 157.5 | 488 | 491 | 116.0 |
| C | 14 | 96 | 16742 | 140.12 | 488 | 491 | 116.0 |
| D | 1 | 52 | 1454954 | 11895.83 | 476 | 461 | 122.3 |
| D | 5 | 235 | 316906 | 2588.1 | 476 | 461 | 122.3 |
| D | 5 | 184 | 107088 | 872.07 | 476 | 461 | 122.3 |
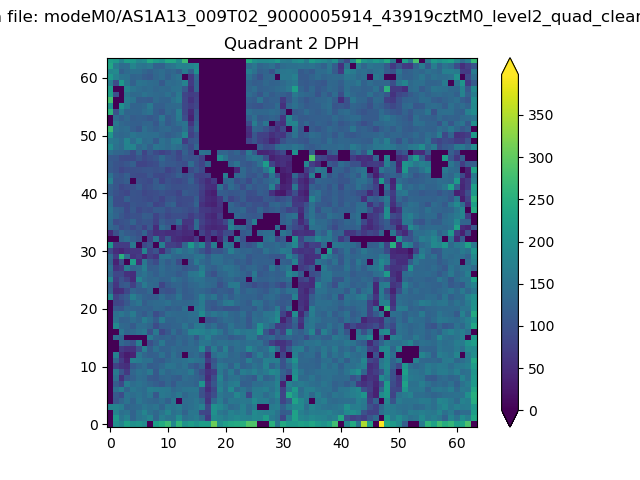
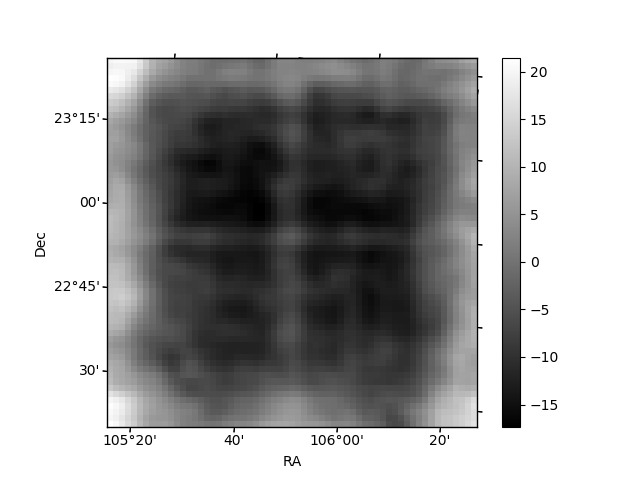
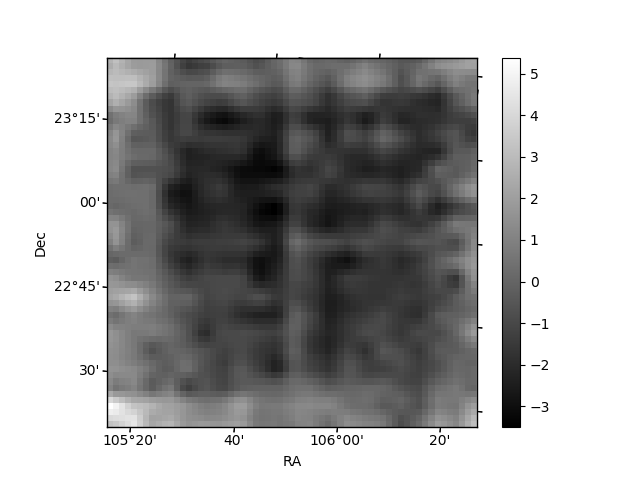
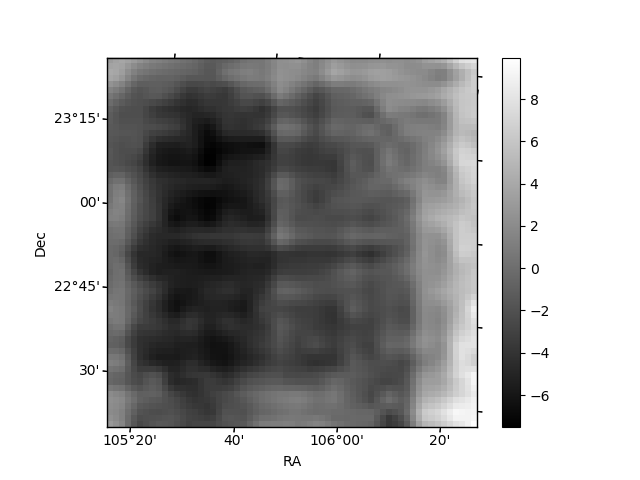
Histogram calculated using DETX and DETY for each event in the final _common_clean file
| Quadrant A | 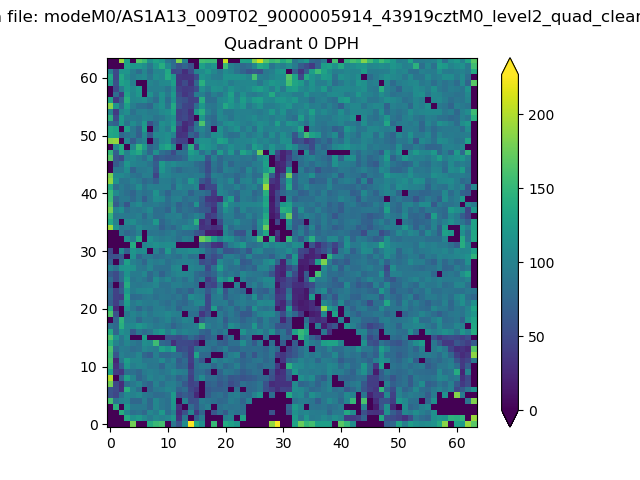 |
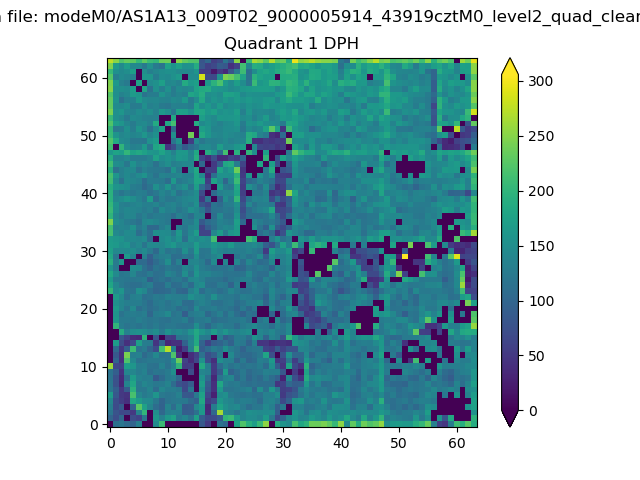 |
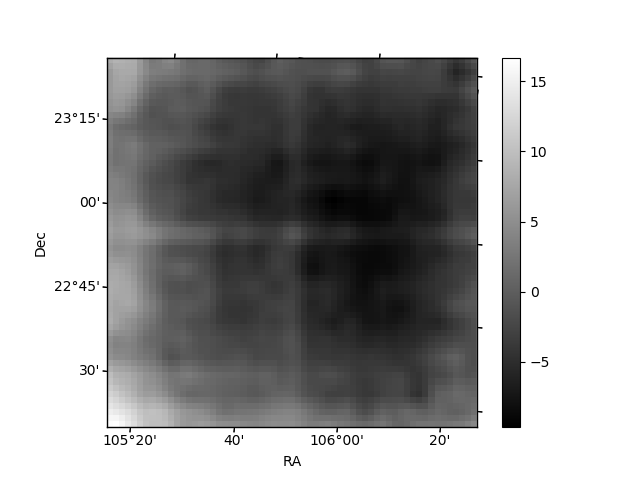
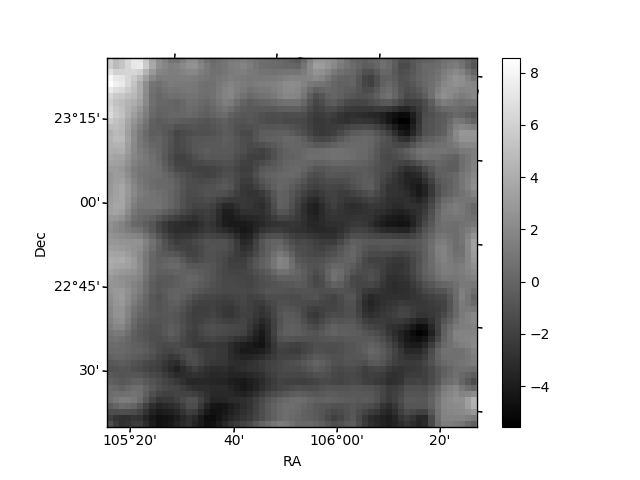
Quadrant B |
|---|---|---|---|
| Quadrant D | 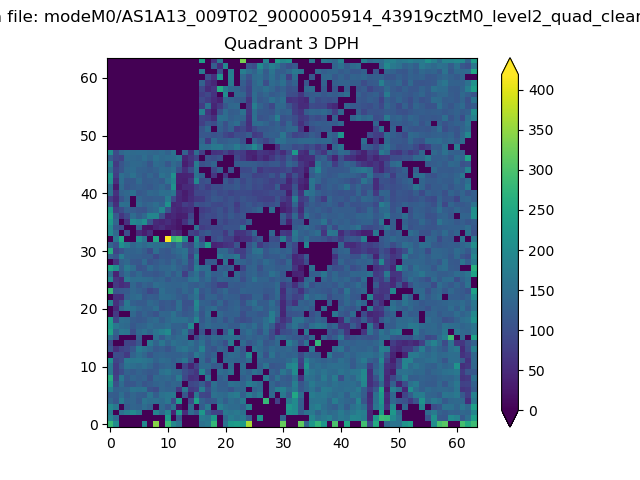 |
 |
Quadrant C |
| Plot type | Count rate plots | Images |
|---|---|---|
| Comparison with Poisson distribution Blue bars denote a histogram of data divided into 1 sec bins. Red curve is a Poisson curve with rate = median count rate of data. |
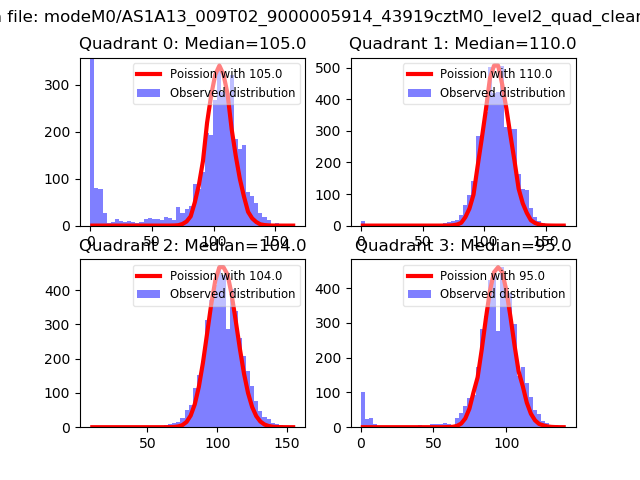 |
 |
| Quadrant-wise count rates Data is divided into 100 sec bins |
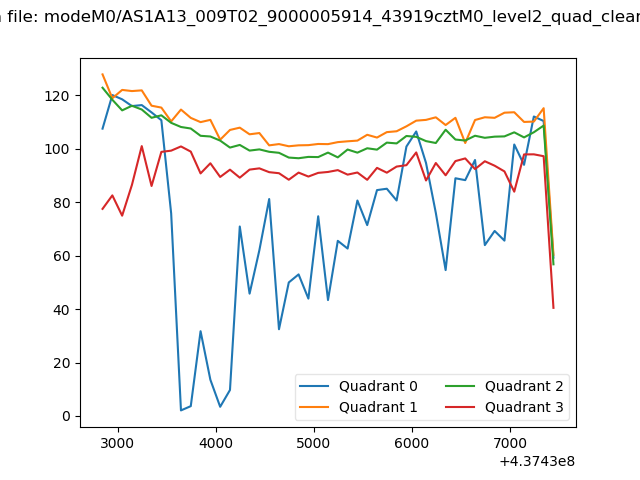 |
|
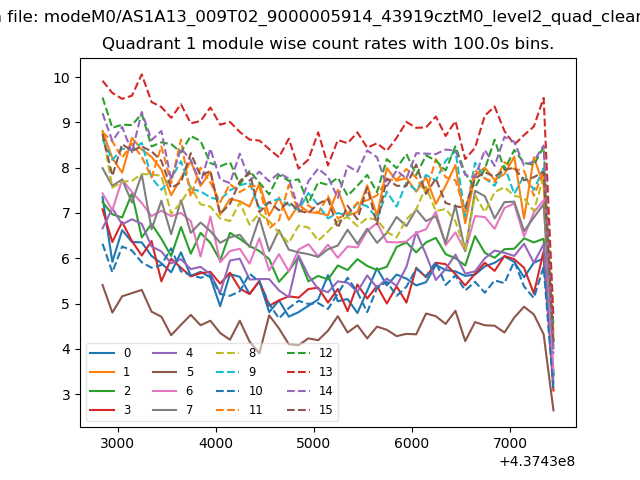
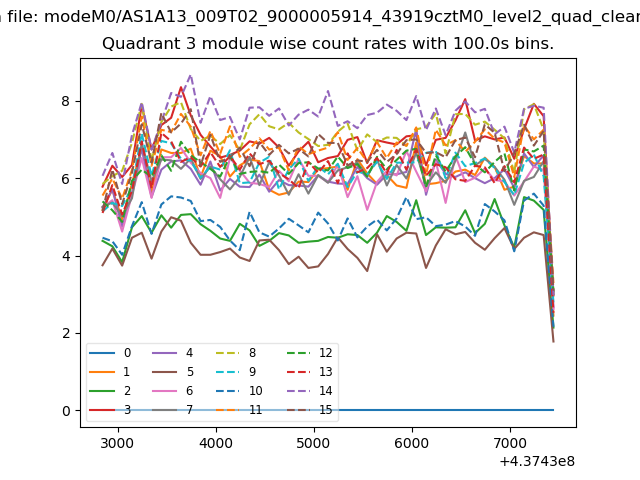
| Module-wise count rates for Quadrant A Data is divided into 100 sec bins |
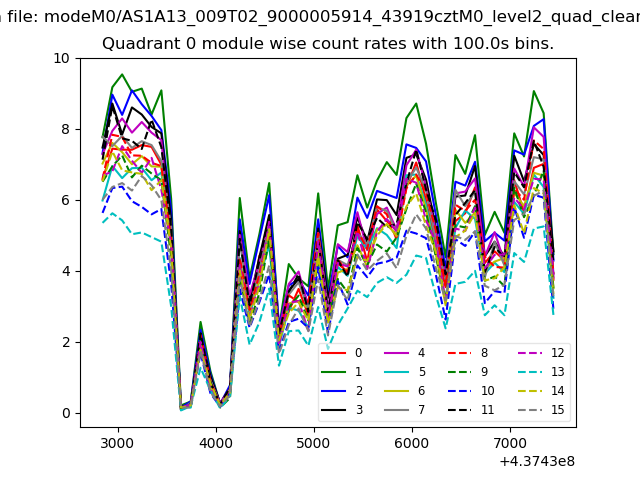 |
 |
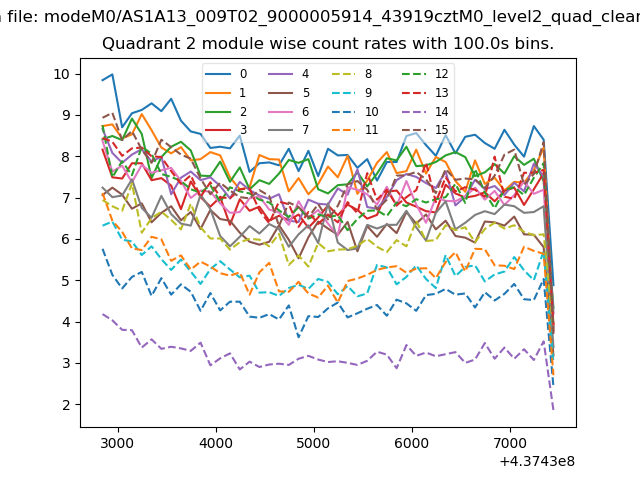
| Module-wise count rates for Quadrant B Data is divided into 100 sec bins |
 |
 |
| Module-wise count rates for Quadrant C Data is divided into 100 sec bins |
 |
 |
| Module-wise count rates for Quadrant D Data is divided into 100 sec bins |
 |
 |
| Parameter | Plot |
|---|---|
| CZT HV Monitor | 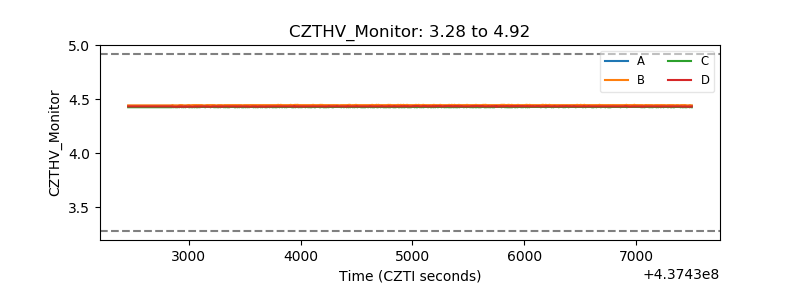 |
| D_VDD | 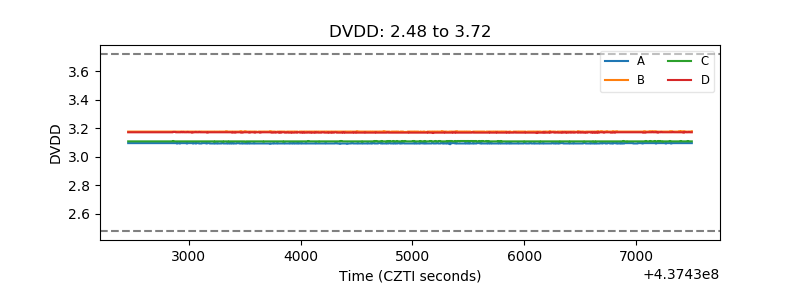 |
| Temperature 1 | 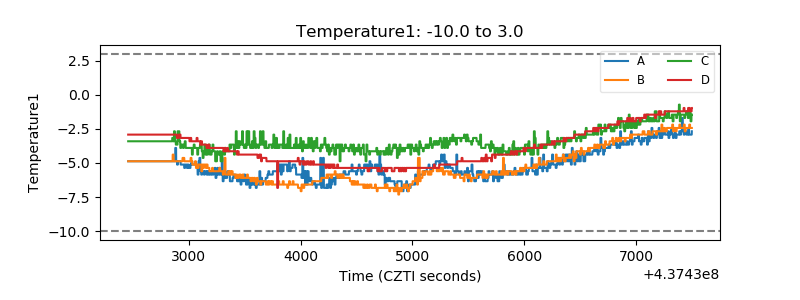 |
| Veto HV Monitor |  |
| Veto LLD | 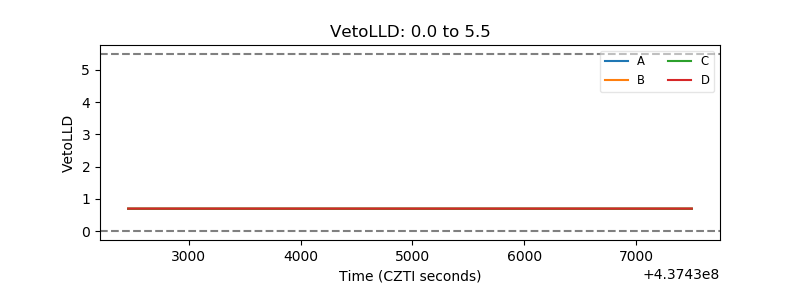 |
| Alpha Counter | 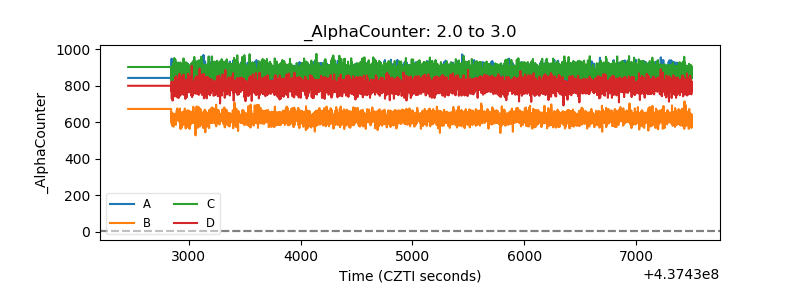 |
| _CPM_Rate | 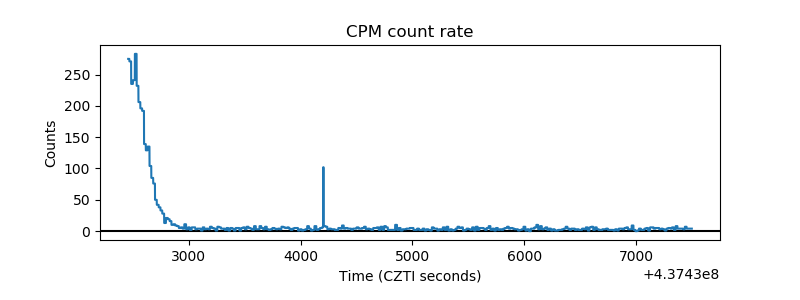 |
| CZT Counter | 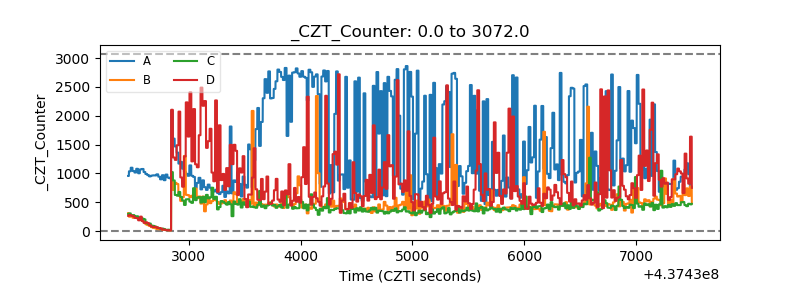 |
| +2.5 Volts monitor | 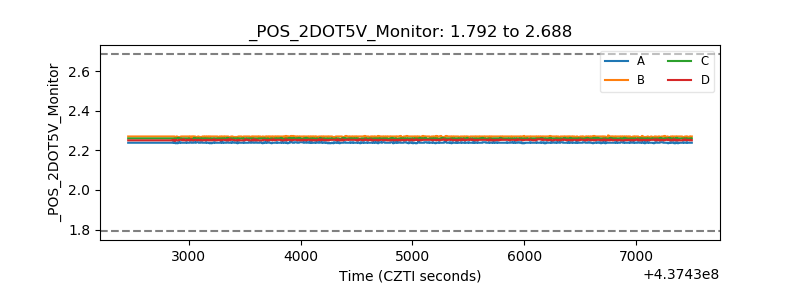 |
| +5 Volts monitor | 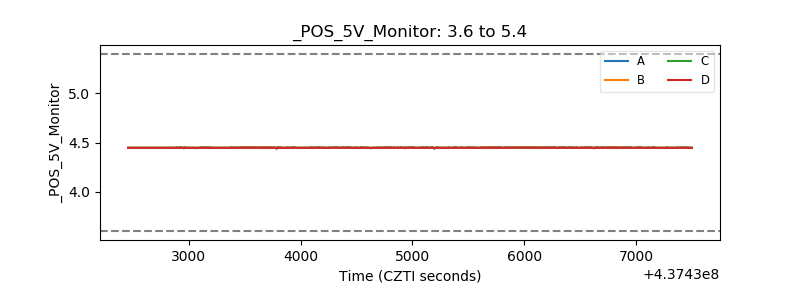 |
| _ROLL_ROT | 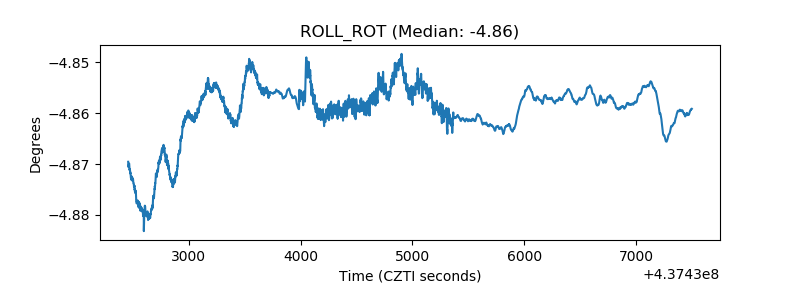 |
| _Roll_DEC | 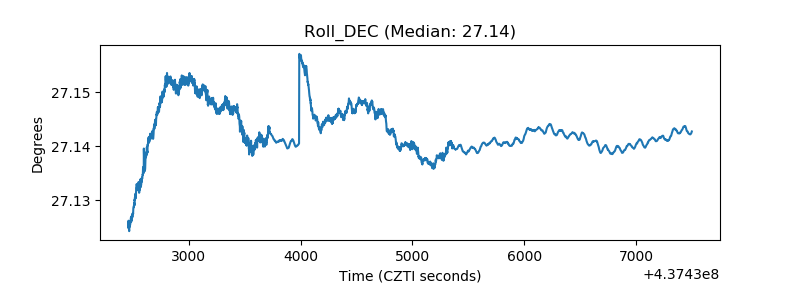 |
| _Roll_RA | 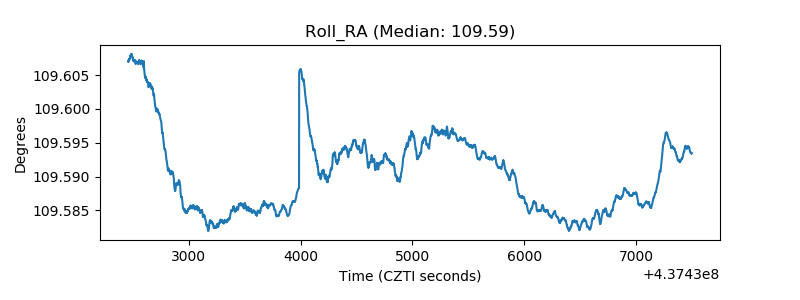 |
| Veto Counter | 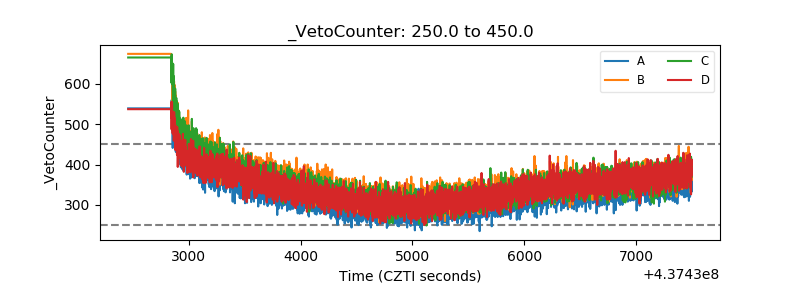 |