| Param | Original file | Final file |
|---|---|---|
| Filename | modeM0/AS1A13_023T01_9000005916_43921cztM0_level2.fits | modeM0/AS1A13_023T01_9000005916_43921cztM0_level2_quad_clean.evt |
| Size (bytes) | 450,708,480 | 110,376,000 |
| Size | 429.8 MB | 105.3 MB |
| Events in quadrant A | 5,435,424 | 727,758 |
| Events in quadrant B | 3,864,471 | 765,577 |
| Events in quadrant C | 2,990,334 | 732,190 |
| Events in quadrant D | 3,881,023 | 656,431 |
| Mode SS | |||
|---|---|---|---|
| Quadrant | BADHDUFLAG | Total packets | Discarded packets |
| A | 0 | 132 | 0 |
| B | 0 | 132 | 0 |
| C | 0 | 132 | 0 |
| D | 0 | 132 | 0 |
| Mode M9 | |||
|---|---|---|---|
| Quadrant | BADHDUFLAG | Total packets | Discarded packets |
| A | 0 | 13 | 0 |
| B | 0 | 13 | 0 |
| C | 0 | 13 | 0 |
| D | 0 | 13 | 0 |
| Mode M0 | |||
|---|---|---|---|
| Quadrant | BADHDUFLAG | Total packets | Discarded packets |
| A | 0 | 20875 | 2 |
| B | 0 | 15805 | 2 |
| C | 0 | 13465 | 2 |
| D | 0 | 16165 | 2 |
| Quadrant | Total seconds | Saturated seconds | Saturation percentage |
|---|---|---|---|
| A | 6601 | 244 | 3.696410% |
| B | 6601 | 93 | 1.408877% |
| C | 6601 | 11 | 0.166641% |
| D | 6601 | 111 | 1.681563% |
Noise dominated data is calculated using 1-second bins in cleaned event files. If a bin has >2000 counts, and if more than 50% of those come from <1% of pixels, then it is considered to be noise-dominated and hence unusable.
| Quadrant | # 1 sec bins | Bins with >0 counts | Bins with >2000 counts | High rate bins dominated by noise | Noise dominated (total time) | Noise dominated (detector-on time) | Marked lightcurve |
|---|---|---|---|---|---|---|---|
| A | 7726 | 6602 | 124 | 124 | 1.60% | 1.88% | 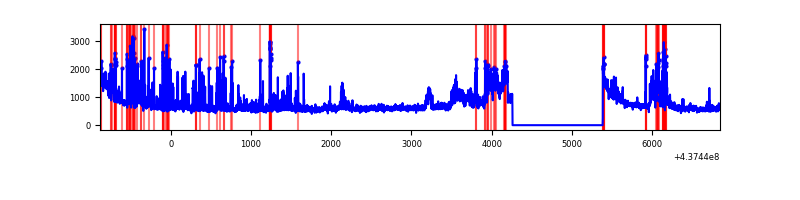 |
| B | 7726 | 6602 | 39 | 39 | 0.50% | 0.59% | 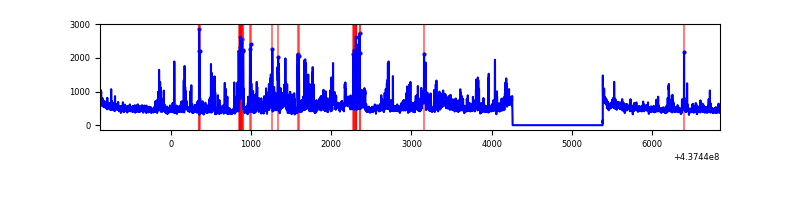 |
| C | 7726 | 6602 | 1 | 1 | 0.01% | 0.02% | 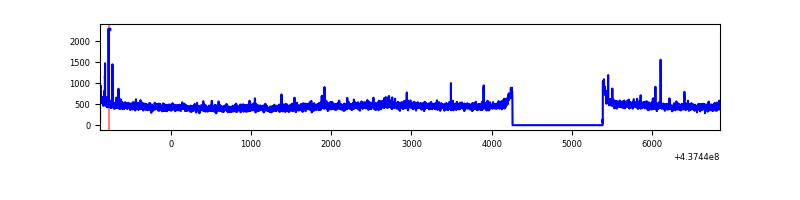 |
| D | 7726 | 6602 | 98 | 98 | 1.27% | 1.48% | 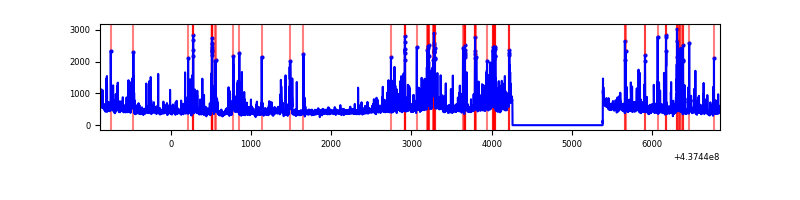 |
Top three noisy pixels from each quadrant. If the there are fewer than three noisy pixels in the level2.evt file, extra rows are filled as -1
| Pixel properties | Quadrant properties | ||||||
|---|---|---|---|---|---|---|---|
| Quadrant | DetID | PixID | Counts | Sigma | Mean | Median | Sigma |
| A | 10 | 83 | 1154077 | 7575.11 | 736 | 721 | 152.3 |
| A | 15 | 222 | 717828 | 4709.87 | 736 | 721 | 152.3 |
| A | 15 | 223 | 538470 | 3531.87 | 736 | 721 | 152.3 |
| B | 5 | 235 | 691025 | 4701.92 | 746 | 723 | 146.8 |
| B | 5 | 172 | 103261 | 698.43 | 746 | 723 | 146.8 |
| B | 4 | 171 | 52521 | 352.82 | 746 | 723 | 146.8 |
| C | 3 | 233 | 53490 | 303.97 | 737 | 742 | 173.5 |
| C | 10 | 22 | 35039 | 197.64 | 737 | 742 | 173.5 |
| C | 14 | 254 | 11631 | 62.75 | 737 | 742 | 173.5 |
| D | 12 | 233 | 169078 | 922.91 | 726 | 706 | 182.4 |
| D | 13 | 171 | 160490 | 875.84 | 726 | 706 | 182.4 |
| D | 5 | 235 | 158563 | 865.27 | 726 | 706 | 182.4 |
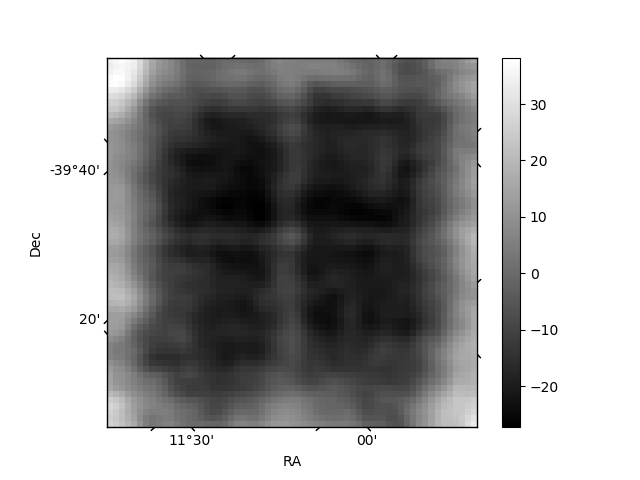
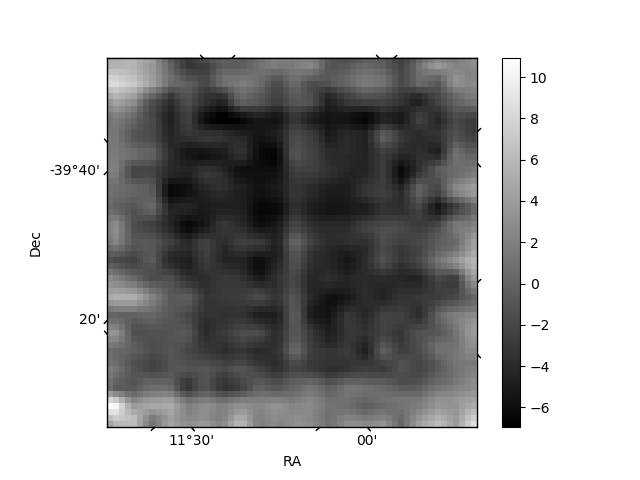
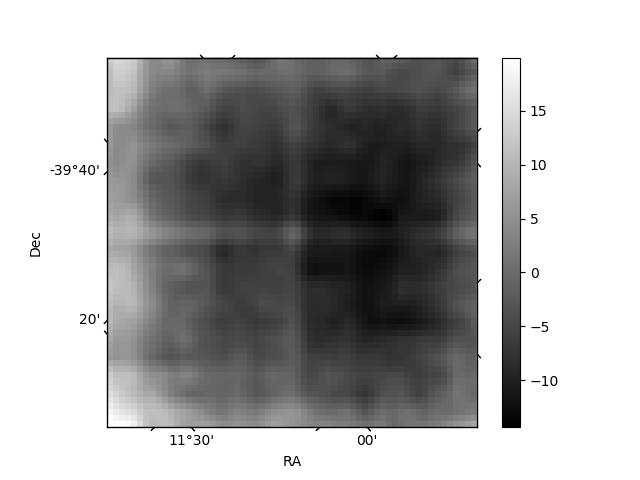
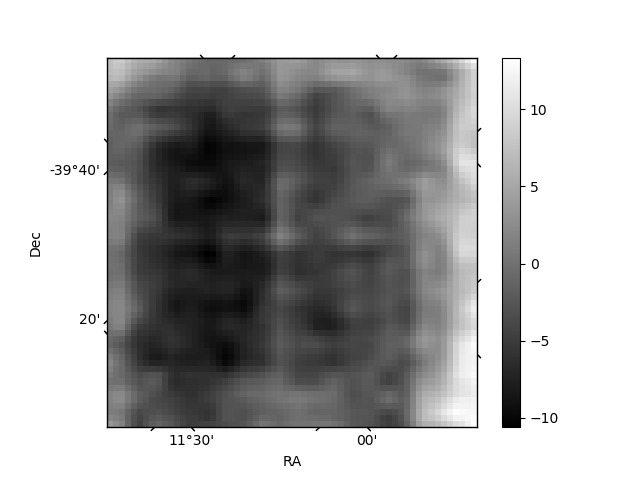
Histogram calculated using DETX and DETY for each event in the final _common_clean file
| Quadrant A | 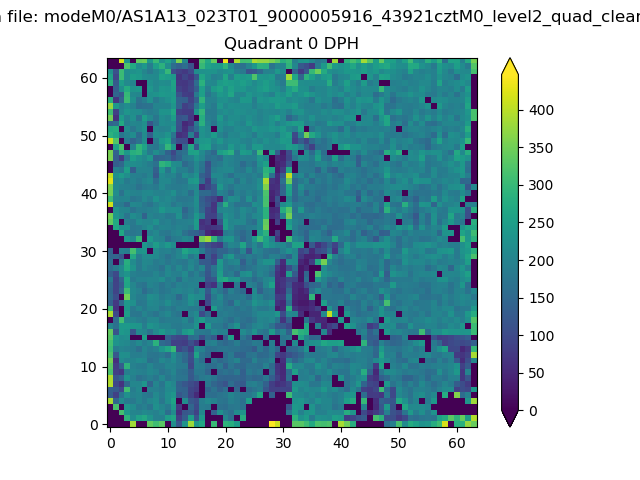 |
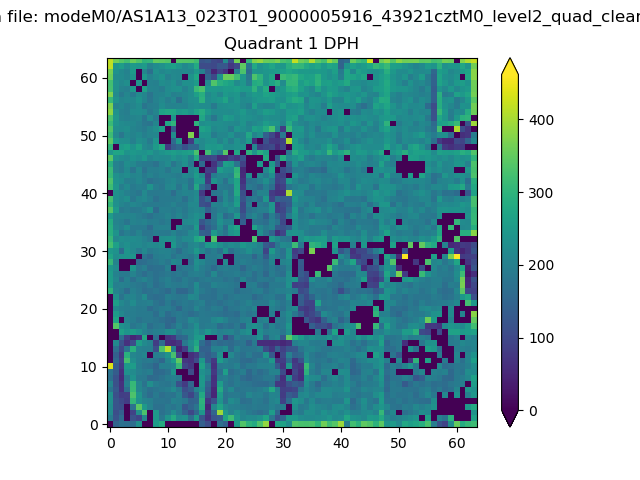 |
Quadrant B |
|---|---|---|---|
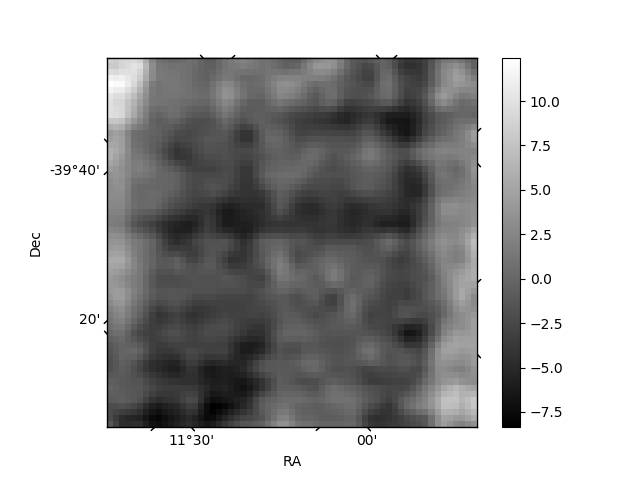
| Quadrant D | 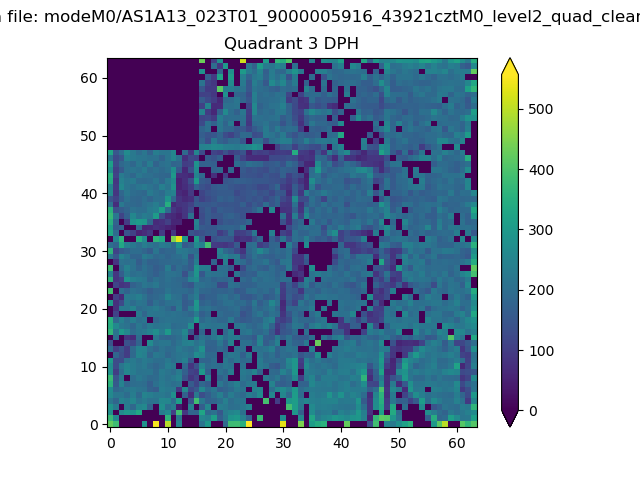 |
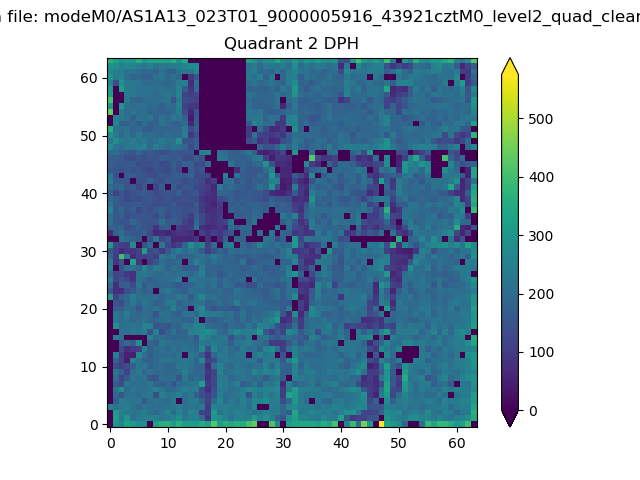 |
Quadrant C |
| Plot type | Count rate plots | Images |
|---|---|---|
| Comparison with Poisson distribution Blue bars denote a histogram of data divided into 1 sec bins. Red curve is a Poisson curve with rate = median count rate of data. |
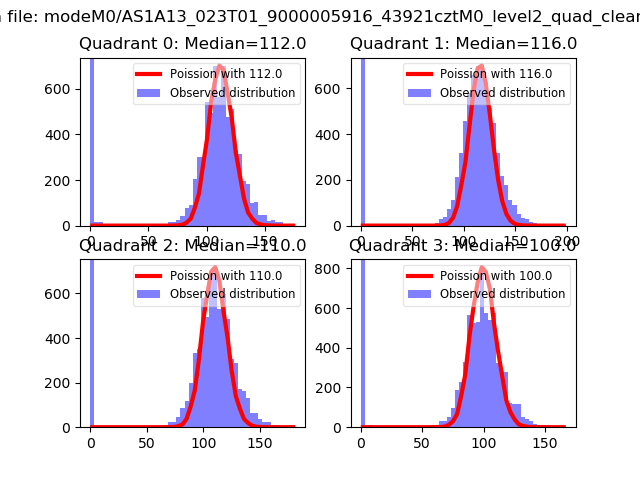 |
 |
| Quadrant-wise count rates Data is divided into 100 sec bins |
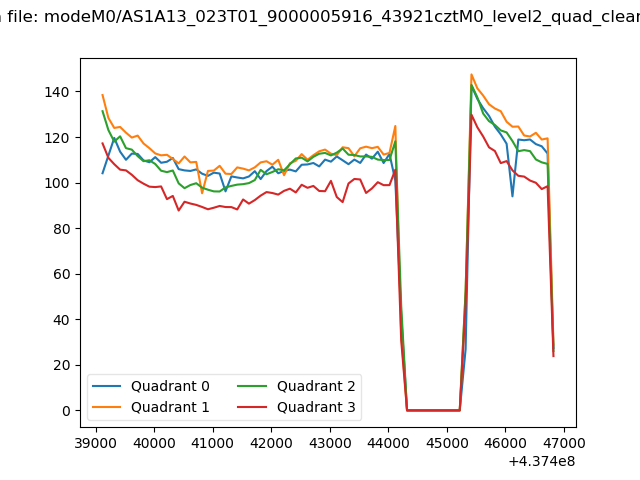 |
|
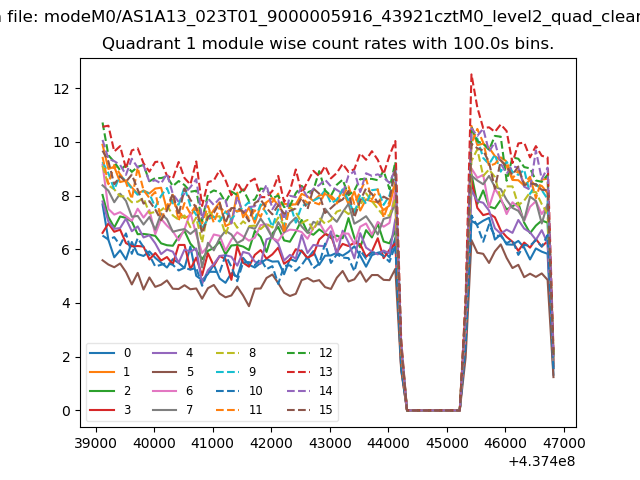
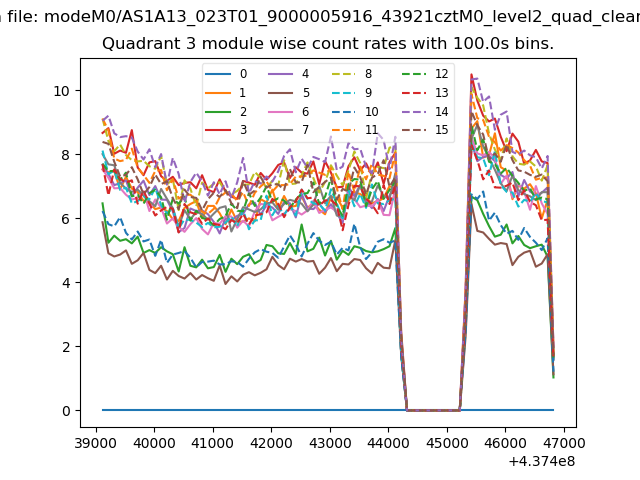
| Module-wise count rates for Quadrant A Data is divided into 100 sec bins |
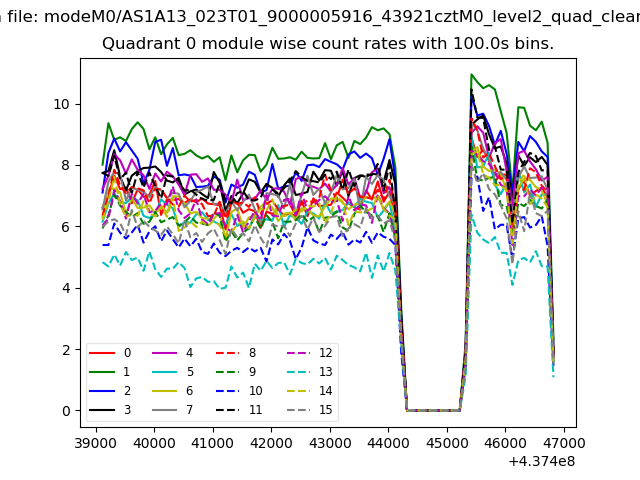 |
 |
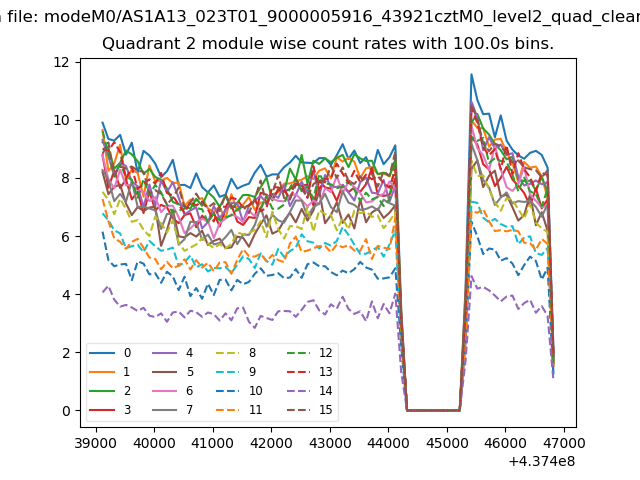
| Module-wise count rates for Quadrant B Data is divided into 100 sec bins |
 |
 |
| Module-wise count rates for Quadrant C Data is divided into 100 sec bins |
 |
 |
| Module-wise count rates for Quadrant D Data is divided into 100 sec bins |
 |
 |
| Parameter | Plot |
|---|---|
| CZT HV Monitor | 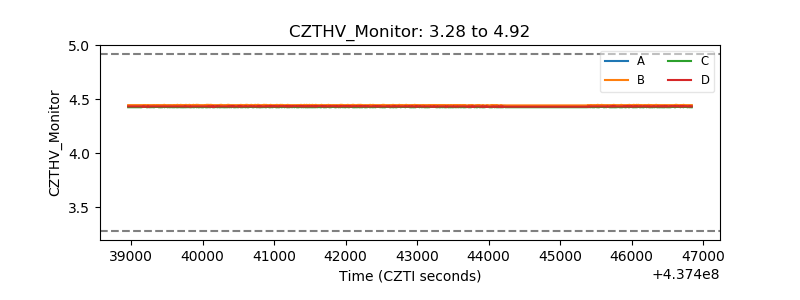 |
| D_VDD | 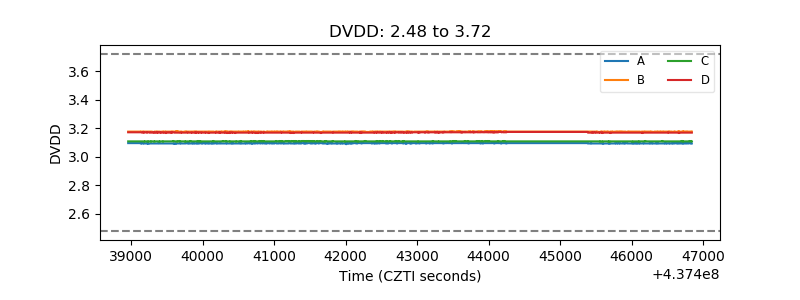 |
| Temperature 1 | 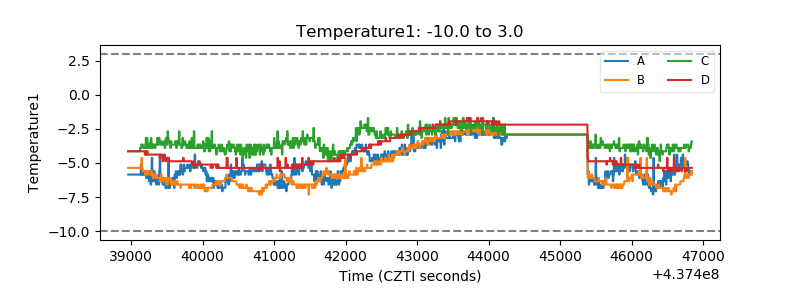 |
| Veto HV Monitor | 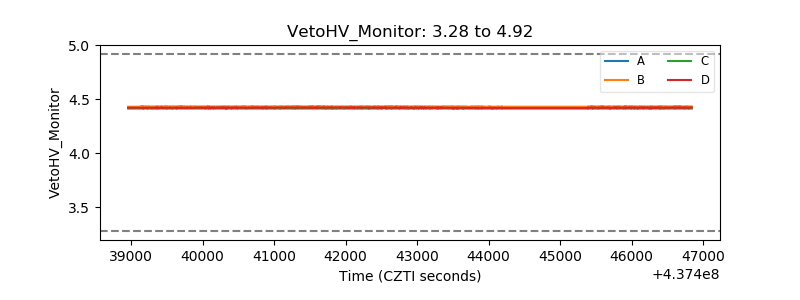 |
| Veto LLD | 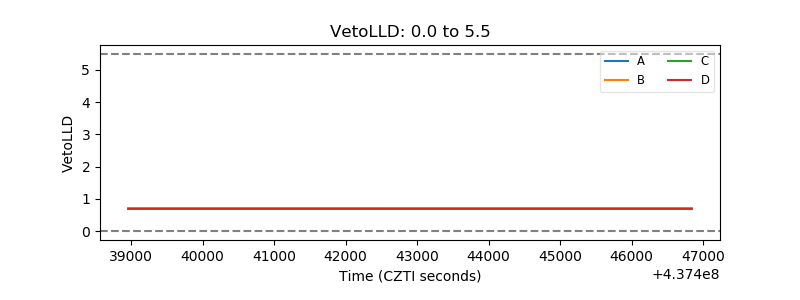 |
| Alpha Counter | 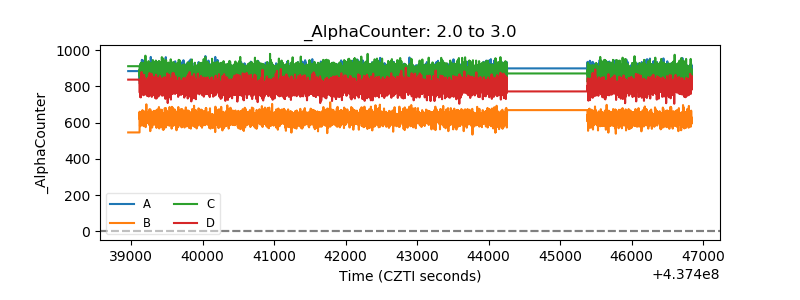 |
| _CPM_Rate | 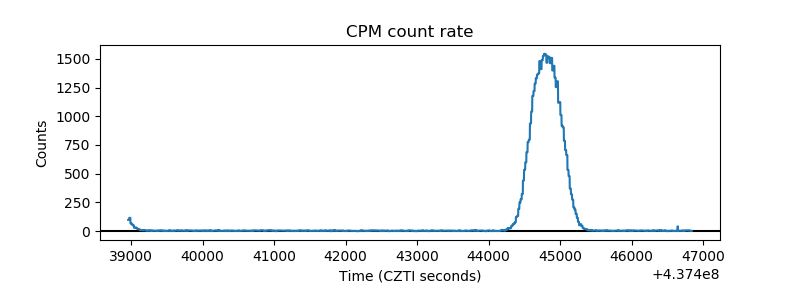 |
| CZT Counter | 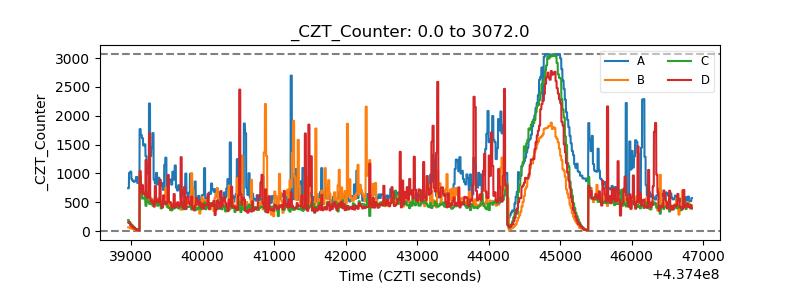 |
| +2.5 Volts monitor | 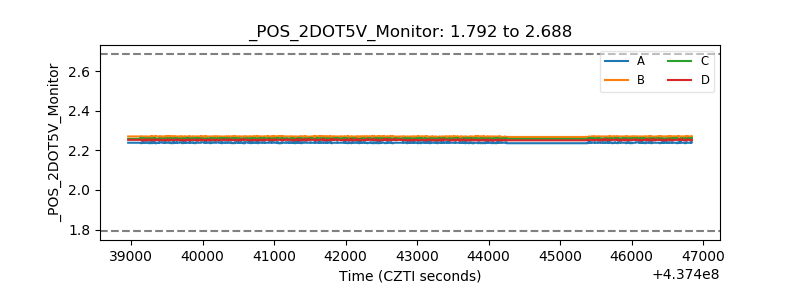 |
| +5 Volts monitor | 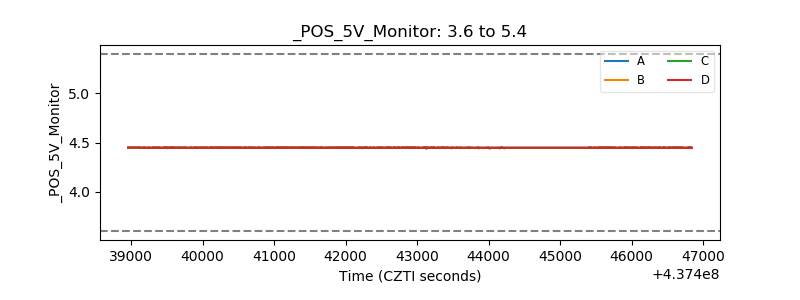 |
| _ROLL_ROT | 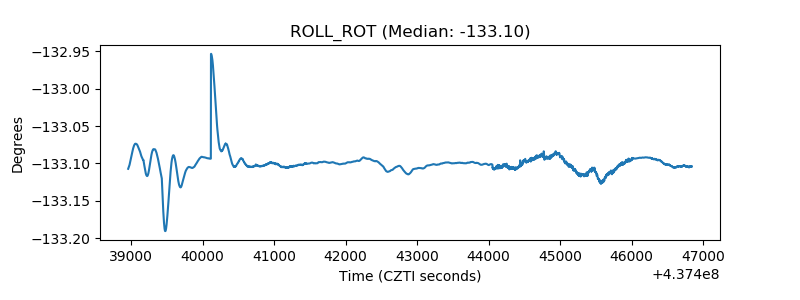 |
| _Roll_DEC | 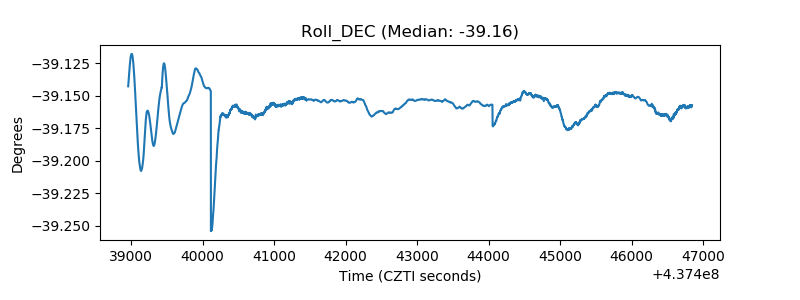 |
| _Roll_RA | 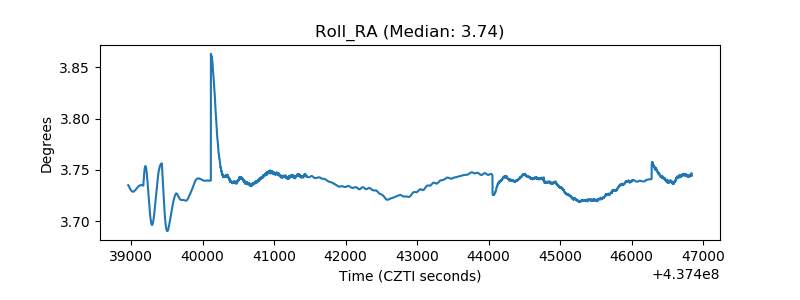 |
| Veto Counter | 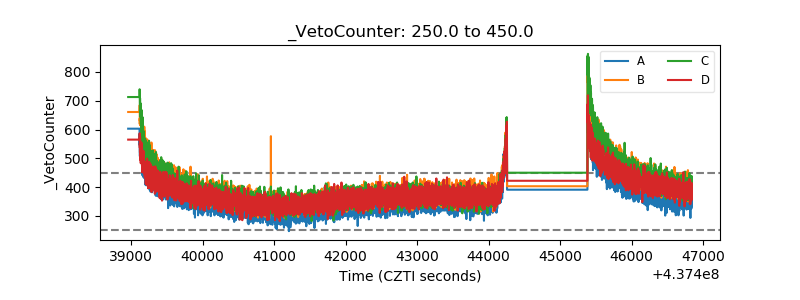 |