| Param | Original file | Final file |
|---|---|---|
| Filename | modeM0/AS1A13_023T01_9000005916_43922cztM0_level2.fits | modeM0/AS1A13_023T01_9000005916_43922cztM0_level2_quad_clean.evt |
| Size (bytes) | 450,463,680 | 114,304,320 |
| Size | 429.6 MB | 109.0 MB |
| Events in quadrant A | 5,863,559 | 741,011 |
| Events in quadrant B | 3,367,960 | 804,715 |
| Events in quadrant C | 3,156,116 | 767,523 |
| Events in quadrant D | 3,777,537 | 690,398 |
| Mode SS | |||
|---|---|---|---|
| Quadrant | BADHDUFLAG | Total packets | Discarded packets |
| A | 0 | 134 | 0 |
| B | 0 | 134 | 0 |
| C | 0 | 134 | 0 |
| D | 0 | 134 | 0 |
| Mode M9 | |||
|---|---|---|---|
| Quadrant | BADHDUFLAG | Total packets | Discarded packets |
| A | 0 | 23 | 0 |
| B | 0 | 23 | 0 |
| C | 0 | 23 | 0 |
| D | 0 | 23 | 0 |
| Mode M0 | |||
|---|---|---|---|
| Quadrant | BADHDUFLAG | Total packets | Discarded packets |
| A | 0 | 22175 | 2 |
| B | 0 | 14200 | 2 |
| C | 0 | 13698 | 2 |
| D | 0 | 15614 | 2 |
| Quadrant | Total seconds | Saturated seconds | Saturation percentage |
|---|---|---|---|
| A | 6559 | 381 | 5.808812% |
| B | 6560 | 73 | 1.112805% |
| C | 6560 | 28 | 0.426829% |
| D | 6560 | 120 | 1.829268% |
Noise dominated data is calculated using 1-second bins in cleaned event files. If a bin has >2000 counts, and if more than 50% of those come from <1% of pixels, then it is considered to be noise-dominated and hence unusable.
| Quadrant | # 1 sec bins | Bins with >0 counts | Bins with >2000 counts | High rate bins dominated by noise | Noise dominated (total time) | Noise dominated (detector-on time) | Marked lightcurve |
|---|---|---|---|---|---|---|---|
| A | 8889 | 6562 | 216 | 216 | 2.43% | 3.29% | 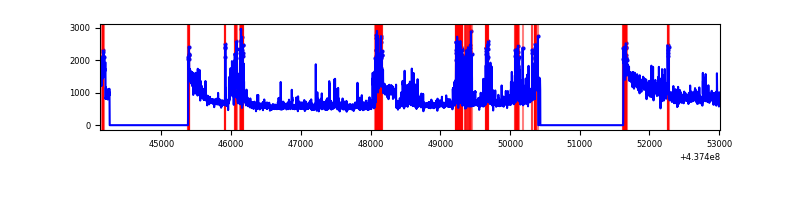 |
| B | 8890 | 6563 | 10 | 10 | 0.11% | 0.15% | 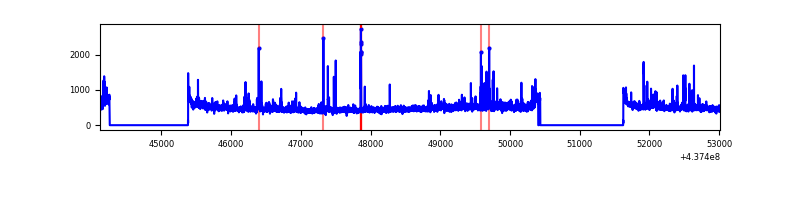 |
| C | 8890 | 6563 | 0 | 0 | 0.00% | 0.00% | 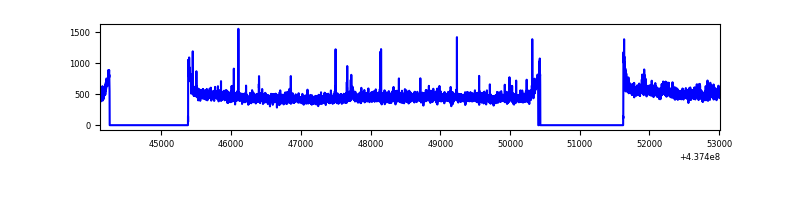 |
| D | 8890 | 6563 | 81 | 81 | 0.91% | 1.23% | 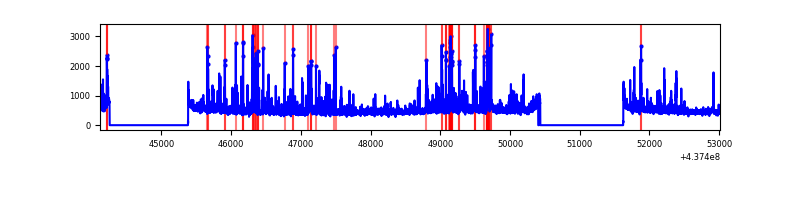 |
Top three noisy pixels from each quadrant. If the there are fewer than three noisy pixels in the level2.evt file, extra rows are filled as -1
| Pixel properties | Quadrant properties | ||||||
|---|---|---|---|---|---|---|---|
| Quadrant | DetID | PixID | Counts | Sigma | Mean | Median | Sigma |
| A | 10 | 83 | 1133381 | 7173.16 | 756 | 740 | 157.9 |
| A | 15 | 222 | 898148 | 5683.4 | 756 | 740 | 157.9 |
| A | 15 | 223 | 440470 | 2784.86 | 756 | 740 | 157.9 |
| B | 5 | 235 | 86733 | 565.97 | 776 | 755 | 151.9 |
| B | 0 | 199 | 64698 | 420.92 | 776 | 755 | 151.9 |
| B | 5 | 172 | 56762 | 368.68 | 776 | 755 | 151.9 |
| C | 10 | 22 | 83055 | 458.32 | 768 | 775 | 179.5 |
| C | 3 | 233 | 50186 | 275.23 | 768 | 775 | 179.5 |
| C | 14 | 254 | 13362 | 70.11 | 768 | 775 | 179.5 |
| D | 1 | 52 | 250348 | 1309.3 | 756 | 734 | 190.6 |
| D | 5 | 235 | 140647 | 733.89 | 756 | 734 | 190.6 |
| D | 13 | 249 | 70780 | 367.41 | 756 | 734 | 190.6 |
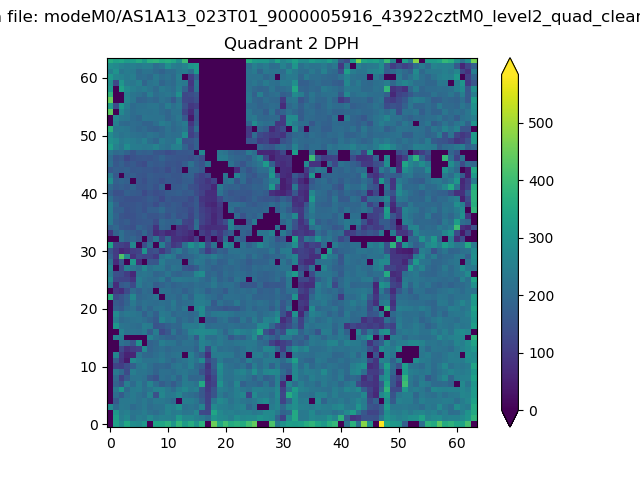
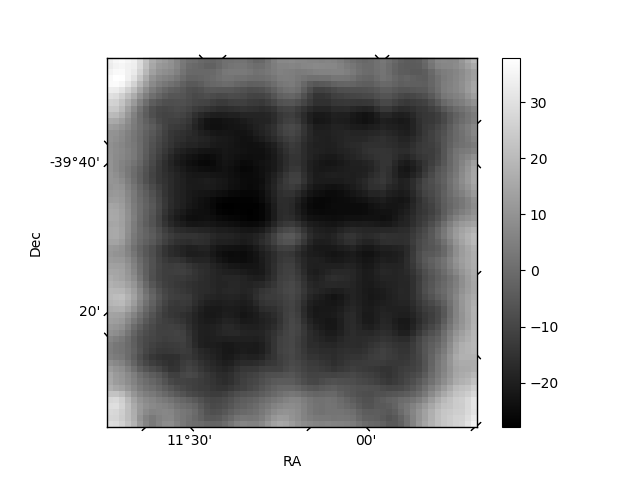
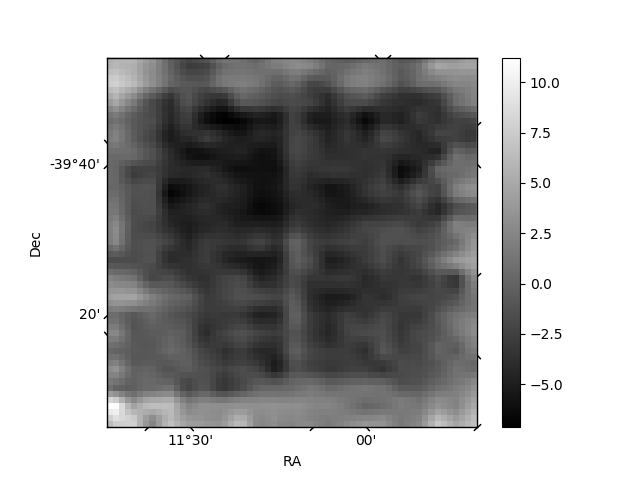
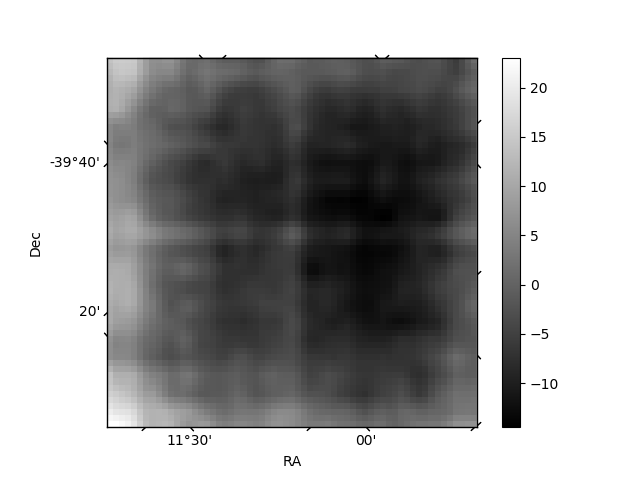
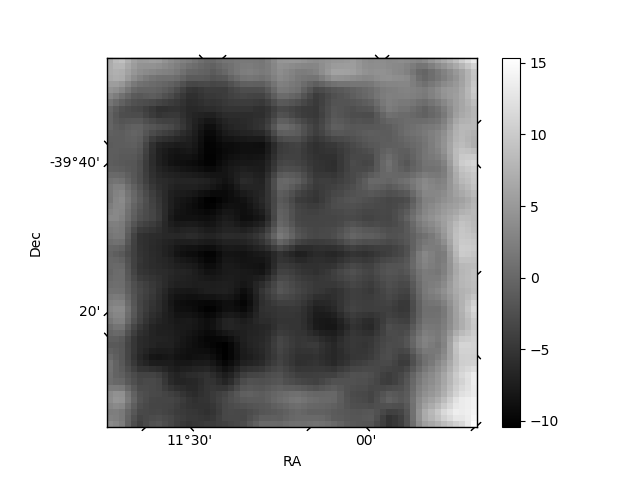
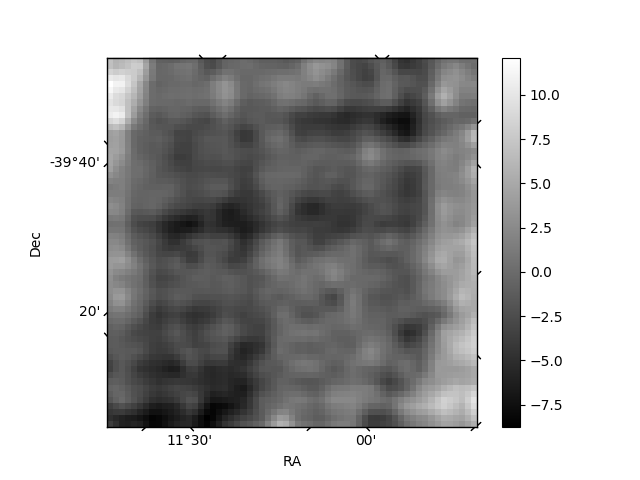
Histogram calculated using DETX and DETY for each event in the final _common_clean file
| Quadrant A | 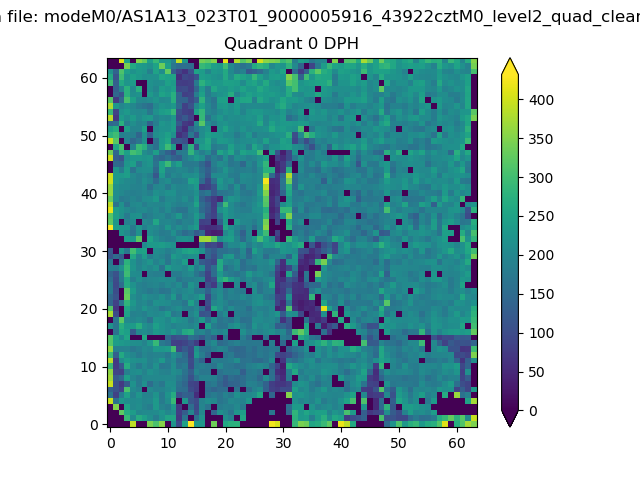 |
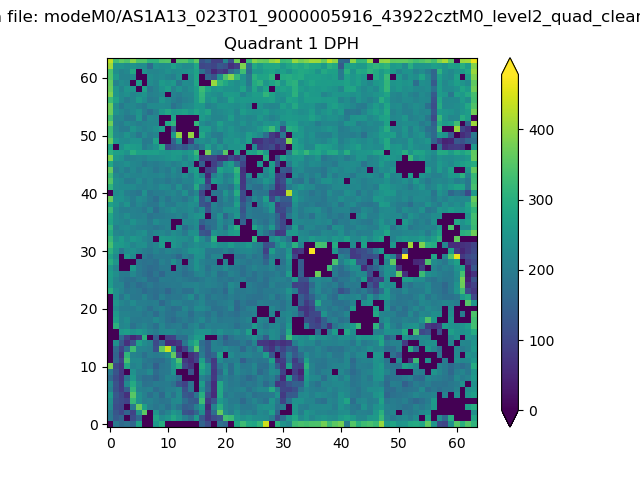 |
Quadrant B |
|---|---|---|---|
| Quadrant D | 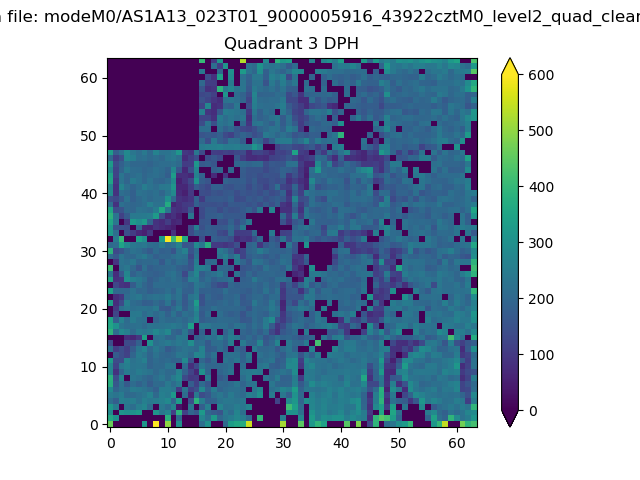 |
 |
Quadrant C |
| Plot type | Count rate plots | Images |
|---|---|---|
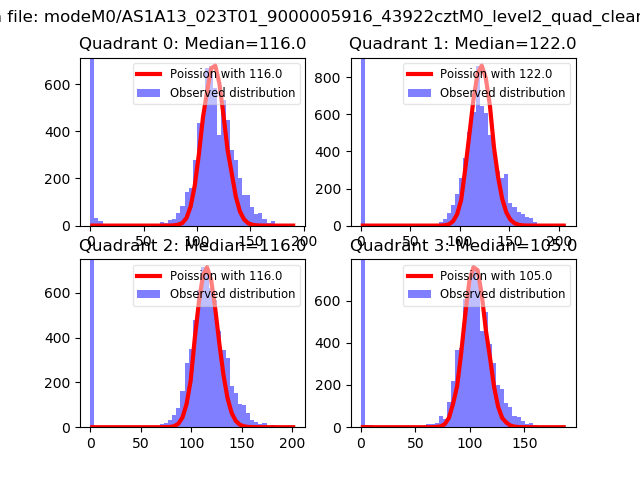
| Comparison with Poisson distribution Blue bars denote a histogram of data divided into 1 sec bins. Red curve is a Poisson curve with rate = median count rate of data. |
 |
 |
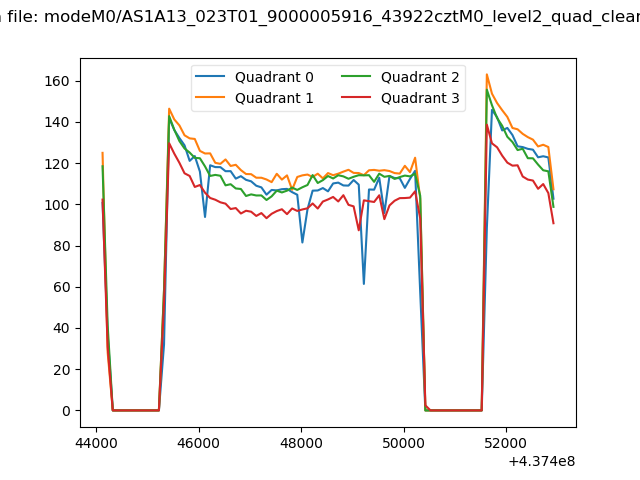
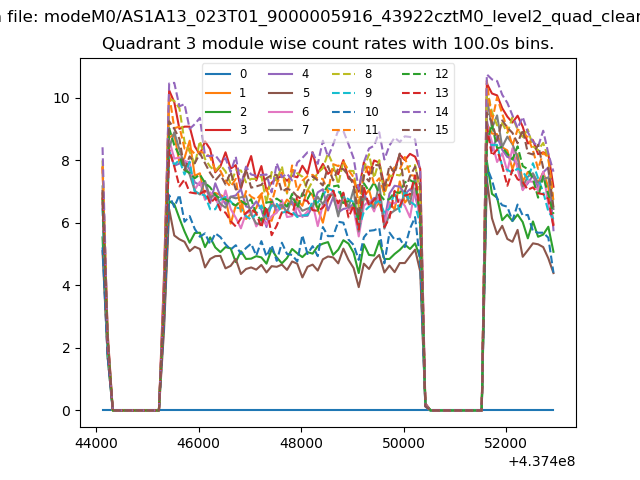
| Quadrant-wise count rates Data is divided into 100 sec bins |
 |
|
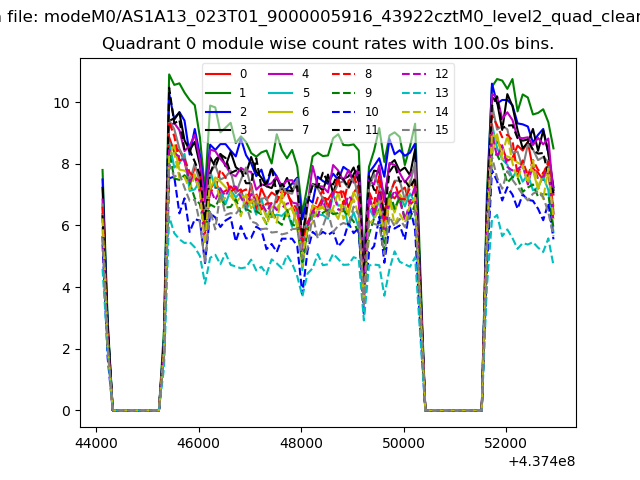
| Module-wise count rates for Quadrant A Data is divided into 100 sec bins |
 |
 |
| Module-wise count rates for Quadrant B Data is divided into 100 sec bins |
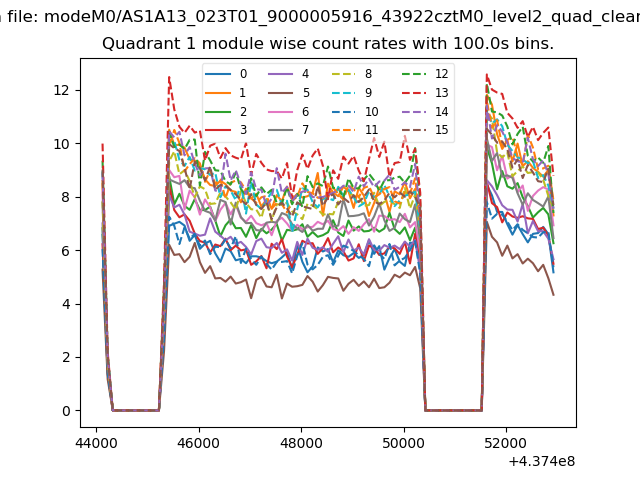 |
 |
| Module-wise count rates for Quadrant C Data is divided into 100 sec bins |
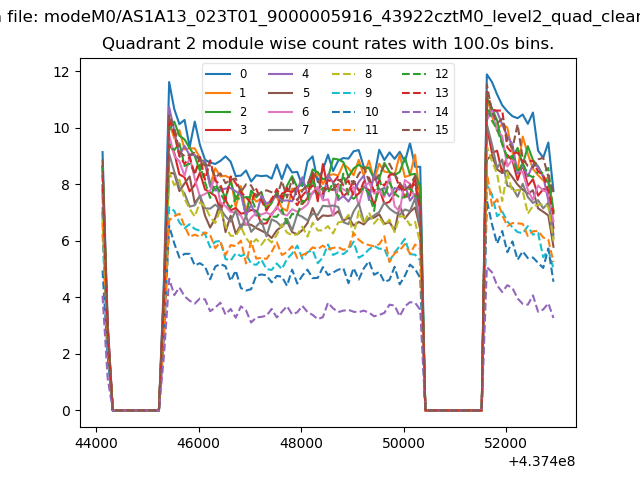 |
 |
| Module-wise count rates for Quadrant D Data is divided into 100 sec bins |
 |
 |
| Parameter | Plot |
|---|---|
| CZT HV Monitor | 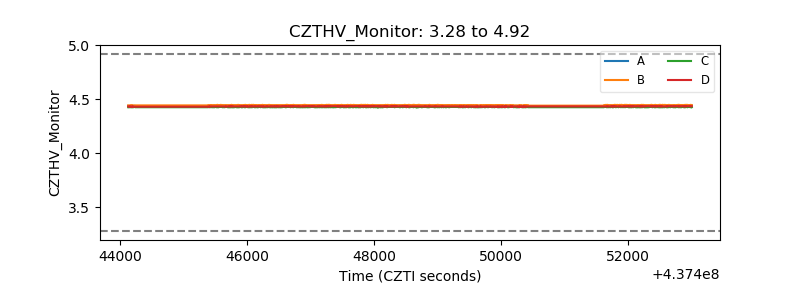 |
| D_VDD | 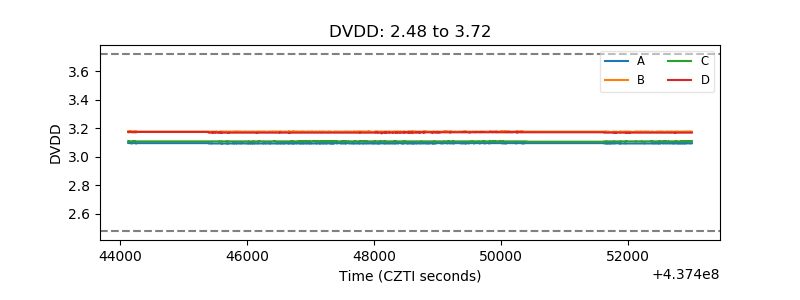 |
| Temperature 1 | 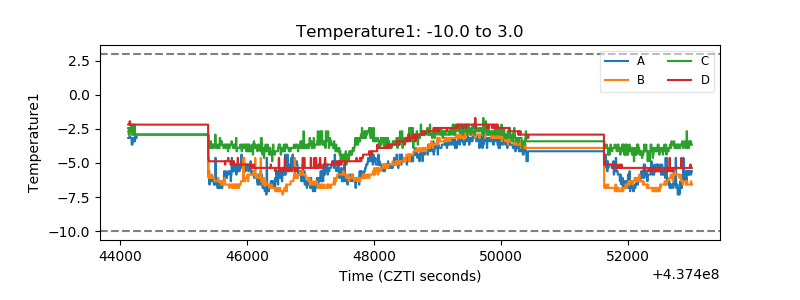 |
| Veto HV Monitor | 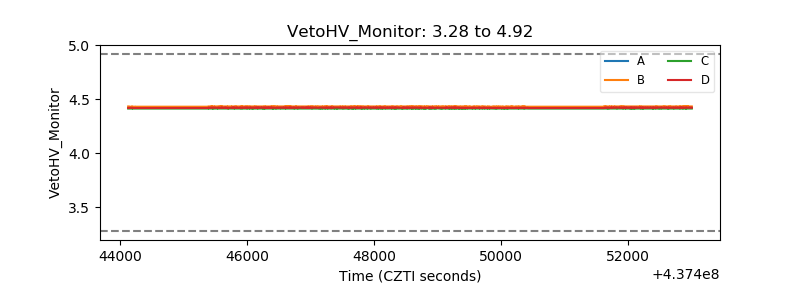 |
| Veto LLD | 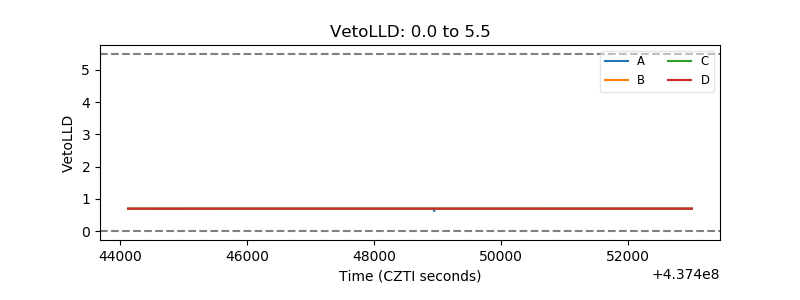 |
| Alpha Counter | 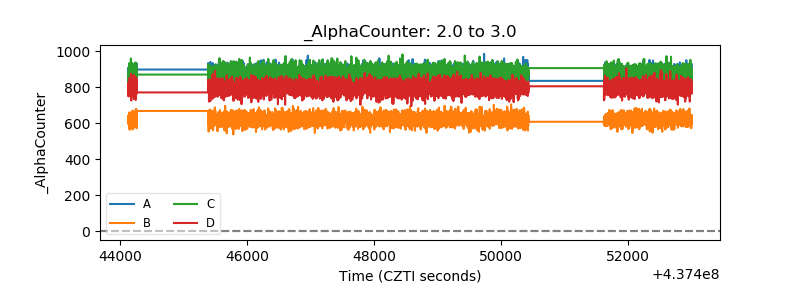 |
| _CPM_Rate | 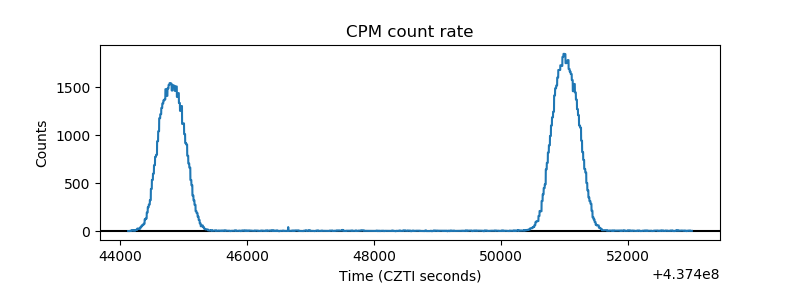 |
| CZT Counter | 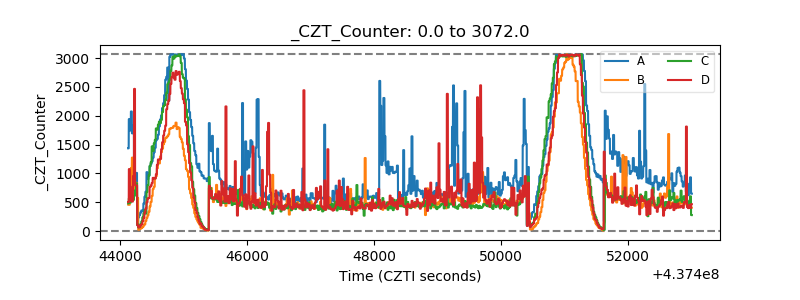 |
| +2.5 Volts monitor | 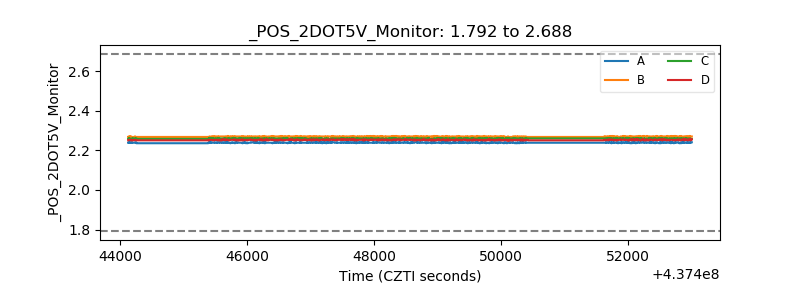 |
| +5 Volts monitor | 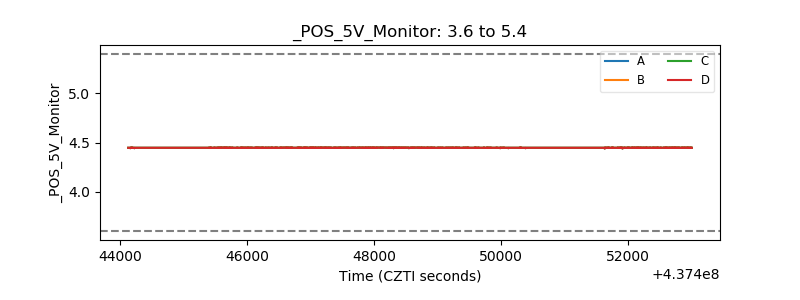 |
| _ROLL_ROT | 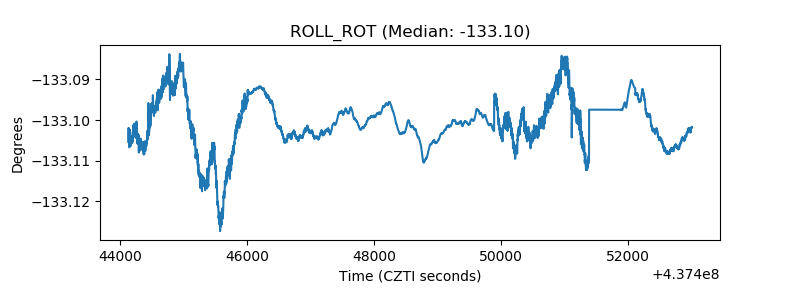 |
| _Roll_DEC | 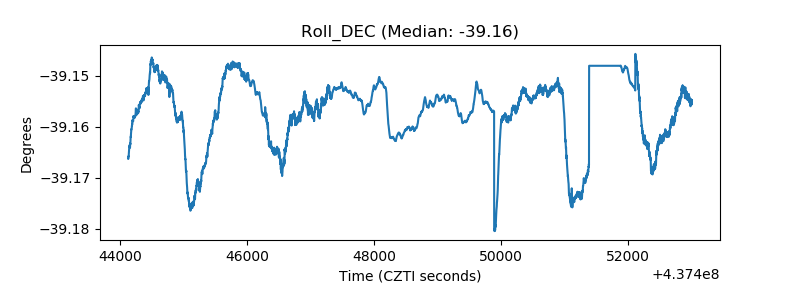 |
| _Roll_RA | 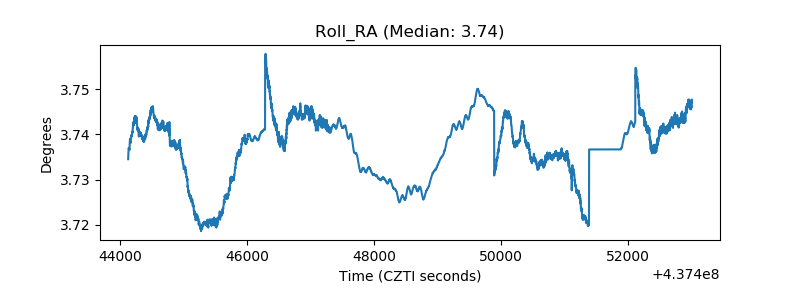 |
| Veto Counter | 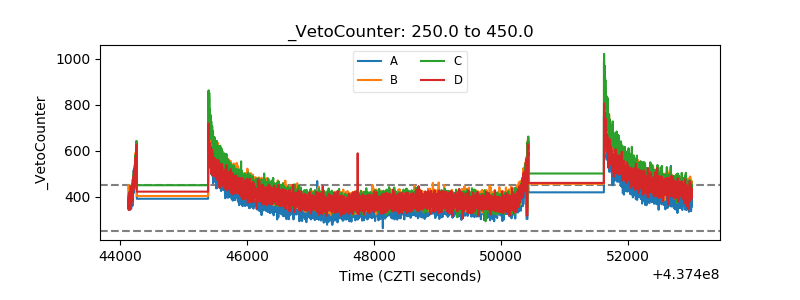 |