| Param | Original file | Final file |
|---|---|---|
| Filename | modeM0/AS1A13_023T01_9000005916_43923cztM0_level2.fits | modeM0/AS1A13_023T01_9000005916_43923cztM0_level2_quad_clean.evt |
| Size (bytes) | 434,407,680 | 108,074,880 |
| Size | 414.3 MB | 103.1 MB |
| Events in quadrant A | 4,867,687 | 725,722 |
| Events in quadrant B | 3,093,953 | 764,715 |
| Events in quadrant C | 3,122,197 | 724,781 |
| Events in quadrant D | 4,526,031 | 634,170 |
| Mode SS | |||
|---|---|---|---|
| Quadrant | BADHDUFLAG | Total packets | Discarded packets |
| A | 0 | 124 | 0 |
| B | 0 | 124 | 0 |
| C | 0 | 124 | 0 |
| D | 0 | 124 | 0 |
| Mode M9 | |||
|---|---|---|---|
| Quadrant | BADHDUFLAG | Total packets | Discarded packets |
| A | 0 | 12 | 0 |
| B | 0 | 12 | 0 |
| C | 0 | 12 | 0 |
| D | 0 | 12 | 0 |
| Mode M0 | |||
|---|---|---|---|
| Quadrant | BADHDUFLAG | Total packets | Discarded packets |
| A | 0 | 19335 | 1 |
| B | 0 | 13004 | 1 |
| C | 0 | 12792 | 1 |
| D | 0 | 17456 | 1 |
| Quadrant | Total seconds | Saturated seconds | Saturation percentage |
|---|---|---|---|
| A | 6061 | 115 | 1.897377% |
| B | 6061 | 56 | 0.923940% |
| C | 6061 | 22 | 0.362976% |
| D | 6061 | 296 | 4.883683% |
Noise dominated data is calculated using 1-second bins in cleaned event files. If a bin has >2000 counts, and if more than 50% of those come from <1% of pixels, then it is considered to be noise-dominated and hence unusable.
| Quadrant | # 1 sec bins | Bins with >0 counts | Bins with >2000 counts | High rate bins dominated by noise | Noise dominated (total time) | Noise dominated (detector-on time) | Marked lightcurve |
|---|---|---|---|---|---|---|---|
| A | 7301 | 6062 | 33 | 33 | 0.45% | 0.54% | 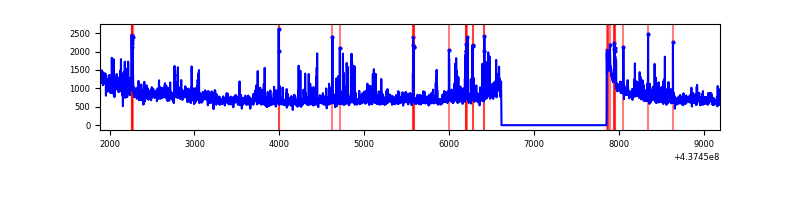 |
| B | 7301 | 6062 | 8 | 8 | 0.11% | 0.13% | 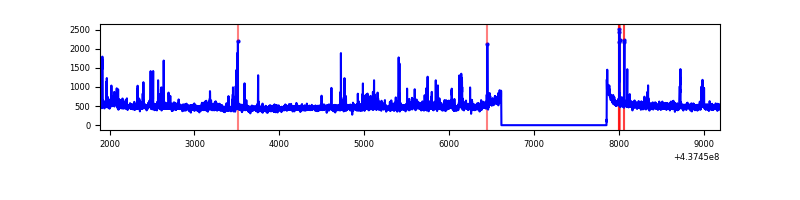 |
| C | 7301 | 6062 | 0 | 0 | 0.00% | 0.00% | 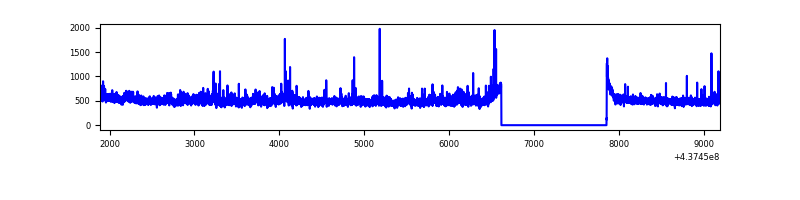 |
| D | 7301 | 6062 | 225 | 225 | 3.08% | 3.71% | 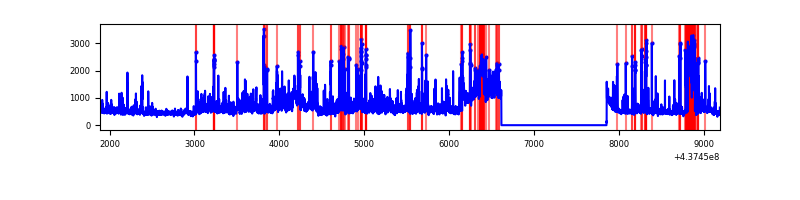 |
Top three noisy pixels from each quadrant. If the there are fewer than three noisy pixels in the level2.evt file, extra rows are filled as -1
| Pixel properties | Quadrant properties | ||||||
|---|---|---|---|---|---|---|---|
| Quadrant | DetID | PixID | Counts | Sigma | Mean | Median | Sigma |
| A | 10 | 83 | 985124 | 6669.26 | 716 | 702 | 147.6 |
| A | 15 | 222 | 698499 | 4727.43 | 716 | 702 | 147.6 |
| A | 15 | 223 | 147654 | 995.57 | 716 | 702 | 147.6 |
| B | 4 | 171 | 78385 | 554.25 | 724 | 703 | 140.2 |
| B | 5 | 172 | 44809 | 314.69 | 724 | 703 | 140.2 |
| B | 5 | 235 | 36736 | 257.09 | 724 | 703 | 140.2 |
| C | 10 | 22 | 219854 | 1312.14 | 717 | 721 | 167.0 |
| C | 3 | 233 | 49351 | 291.19 | 717 | 721 | 167.0 |
| C | 14 | 254 | 31022 | 181.44 | 717 | 721 | 167.0 |
| D | 1 | 52 | 492135 | 2857.91 | 695 | 675 | 172.0 |
| D | 7 | 80 | 479363 | 2783.64 | 695 | 675 | 172.0 |
| D | 5 | 70 | 309986 | 1798.69 | 695 | 675 | 172.0 |
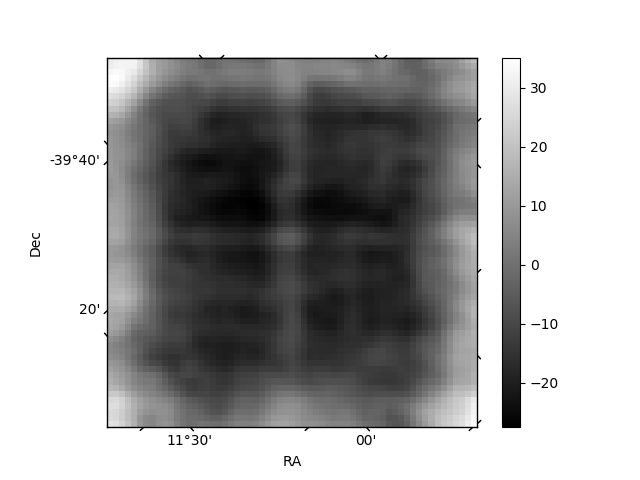
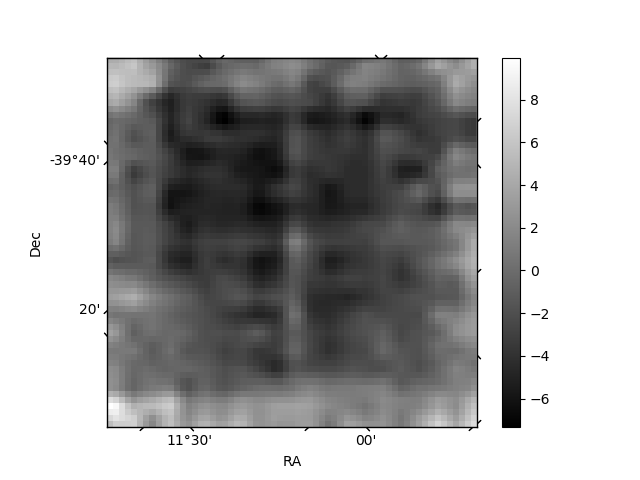
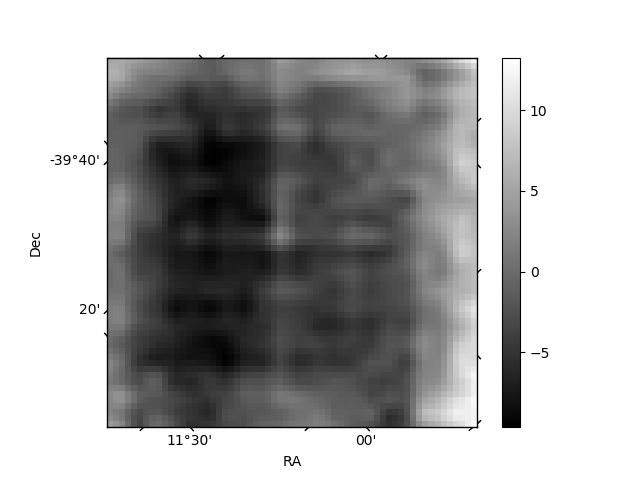
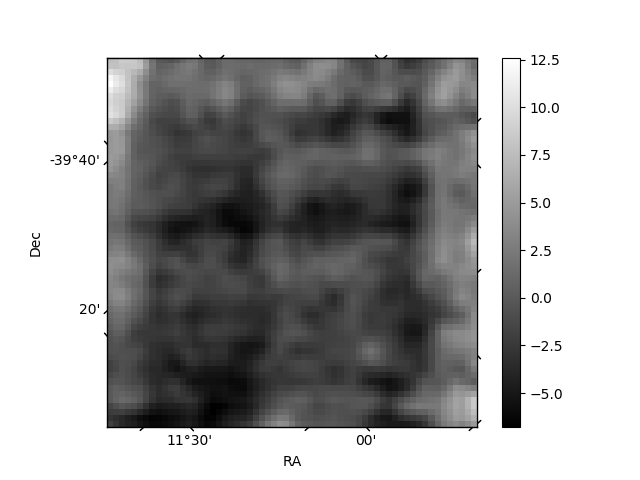
Histogram calculated using DETX and DETY for each event in the final _common_clean file
| Quadrant A | 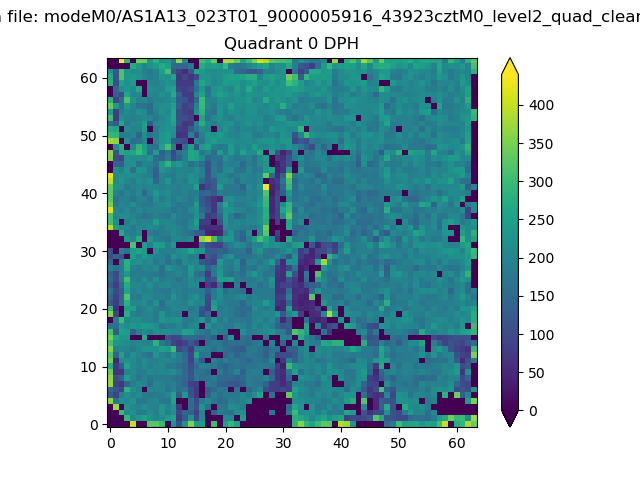 |
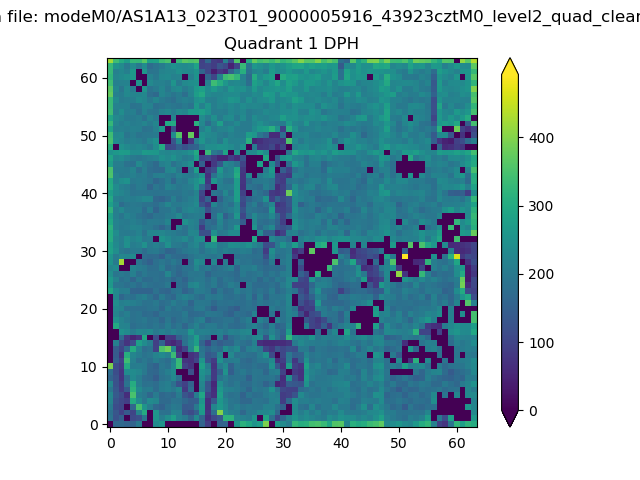 |
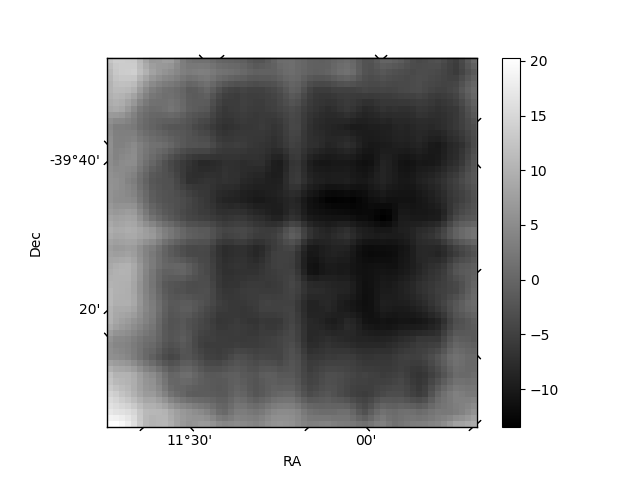
Quadrant B |
|---|---|---|---|
| Quadrant D | 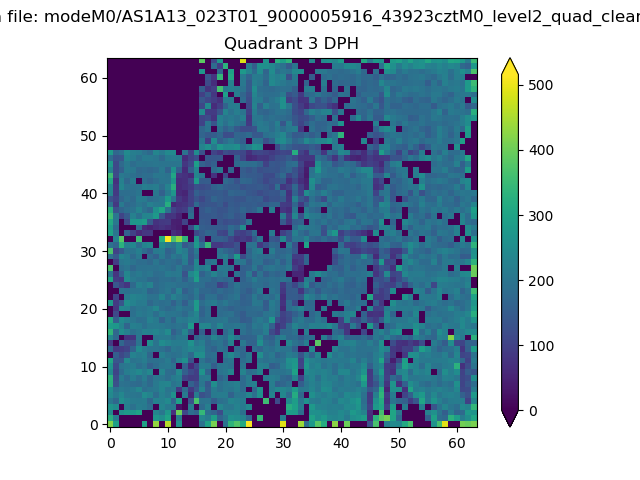 |
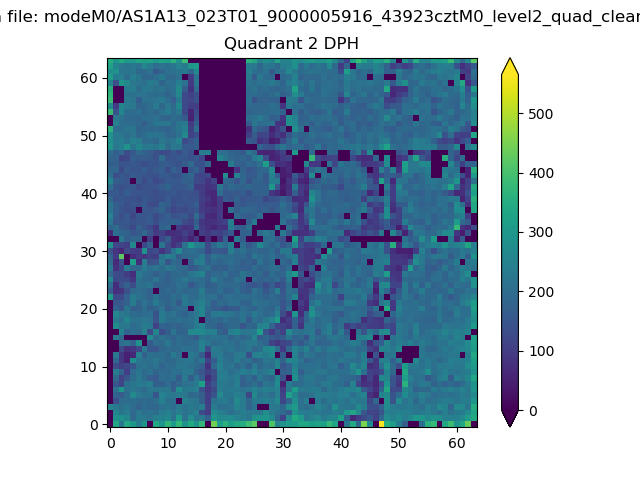 |
Quadrant C |
| Plot type | Count rate plots | Images |
|---|---|---|
| Comparison with Poisson distribution Blue bars denote a histogram of data divided into 1 sec bins. Red curve is a Poisson curve with rate = median count rate of data. |
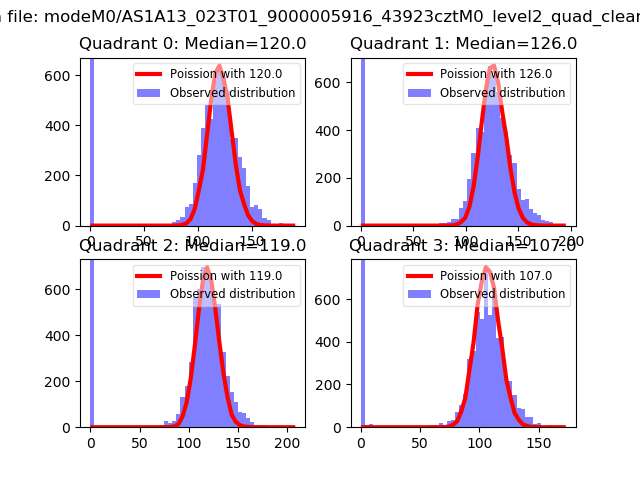 |
 |
| Quadrant-wise count rates Data is divided into 100 sec bins |
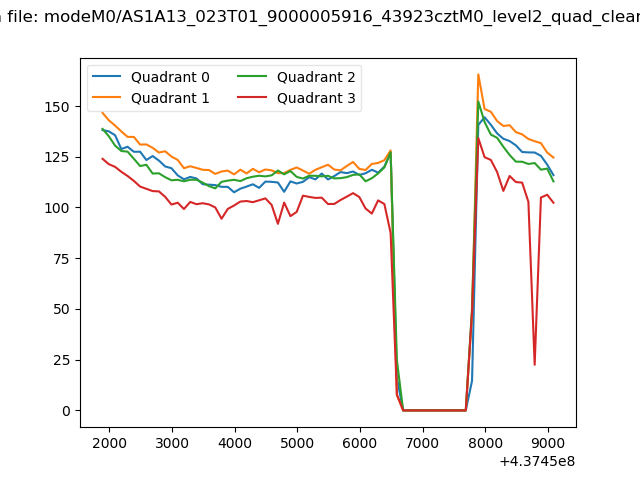 |
|
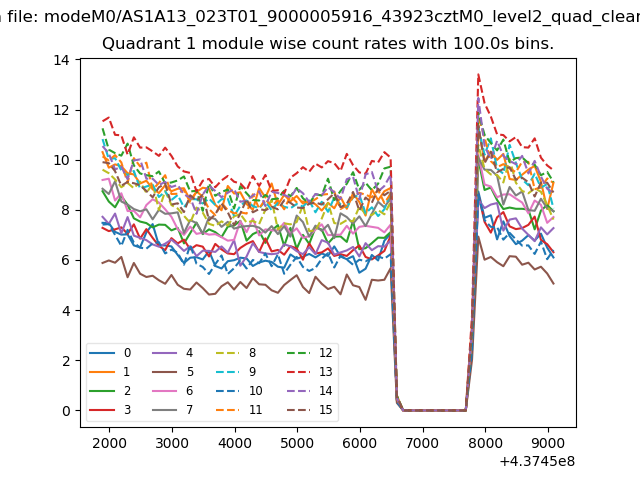
| Module-wise count rates for Quadrant A Data is divided into 100 sec bins |
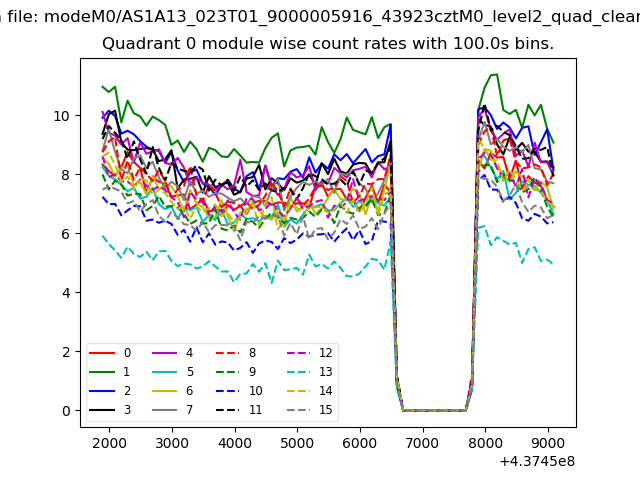 |
 |
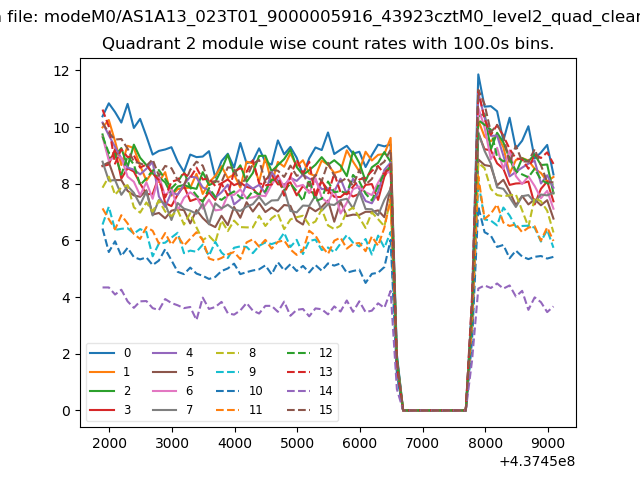
| Module-wise count rates for Quadrant B Data is divided into 100 sec bins |
 |
 |
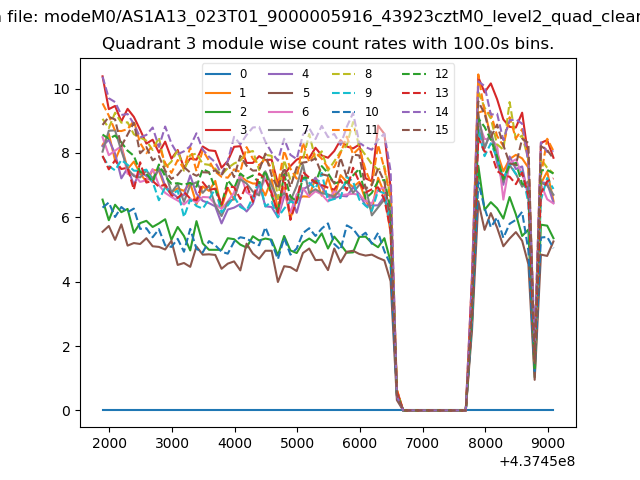
| Module-wise count rates for Quadrant C Data is divided into 100 sec bins |
 |
 |
| Module-wise count rates for Quadrant D Data is divided into 100 sec bins |
 |
 |
| Parameter | Plot |
|---|---|
| CZT HV Monitor | 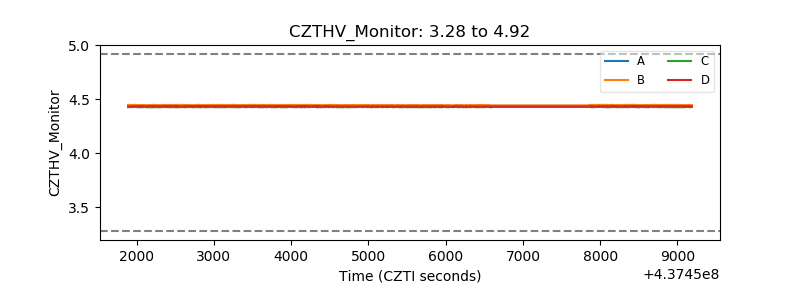 |
| D_VDD | 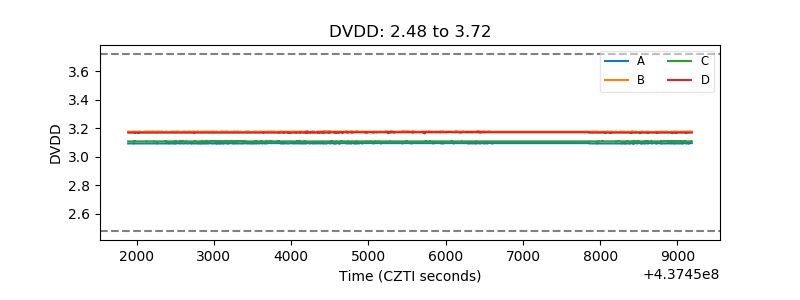 |
| Temperature 1 | 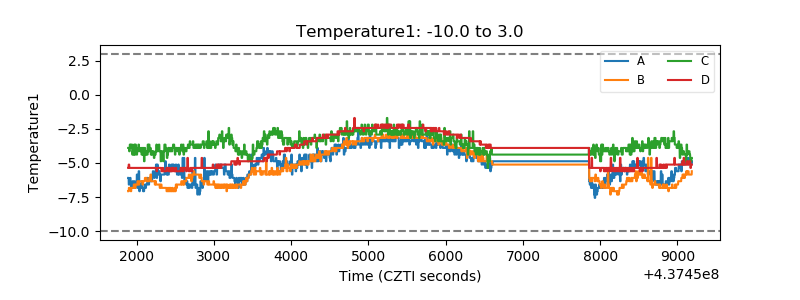 |
| Veto HV Monitor |  |
| Veto LLD | 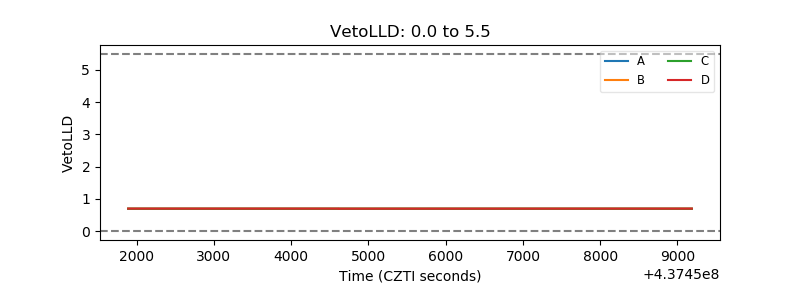 |
| Alpha Counter | 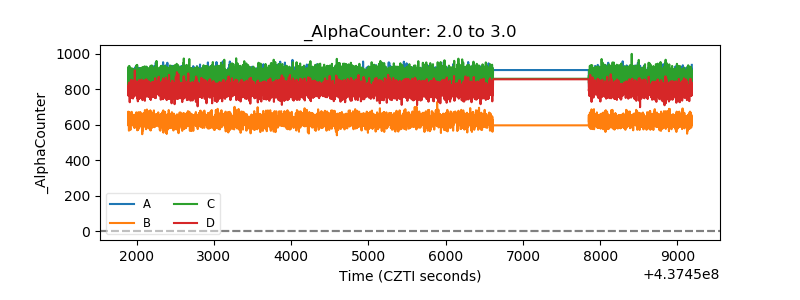 |
| _CPM_Rate | 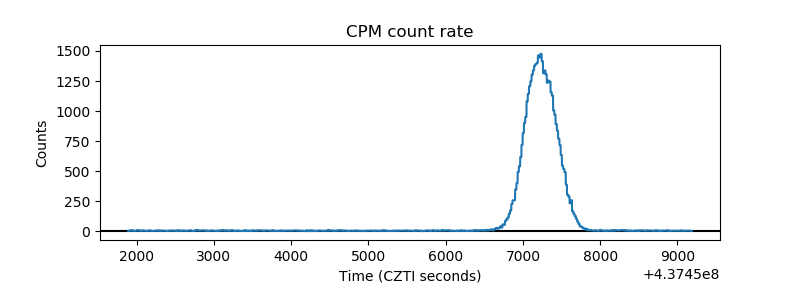 |
| CZT Counter | 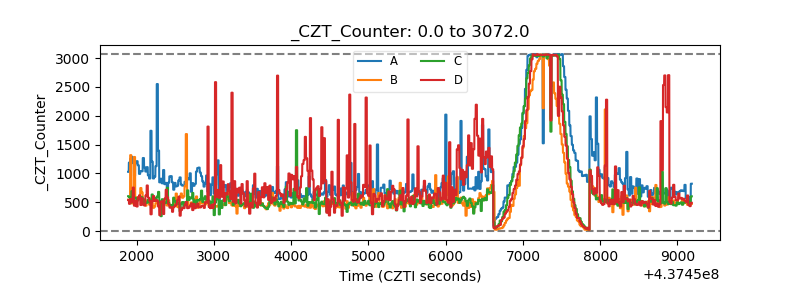 |
| +2.5 Volts monitor | 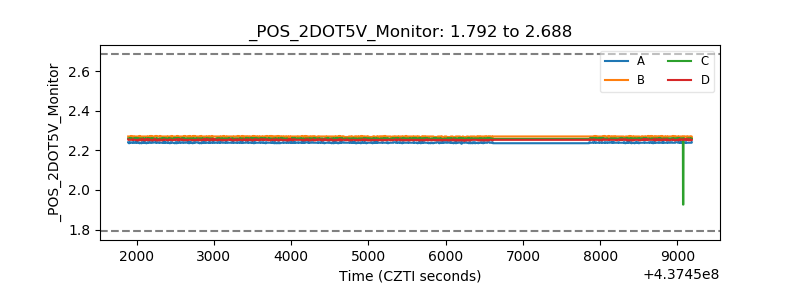 |
| +5 Volts monitor | 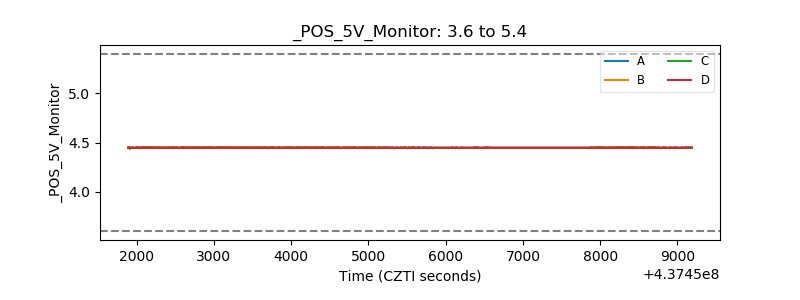 |
| _ROLL_ROT | 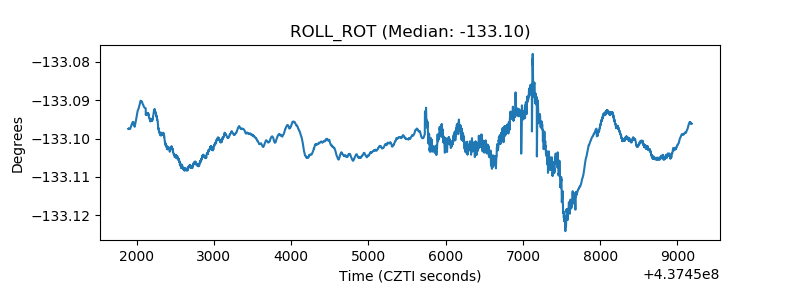 |
| _Roll_DEC | 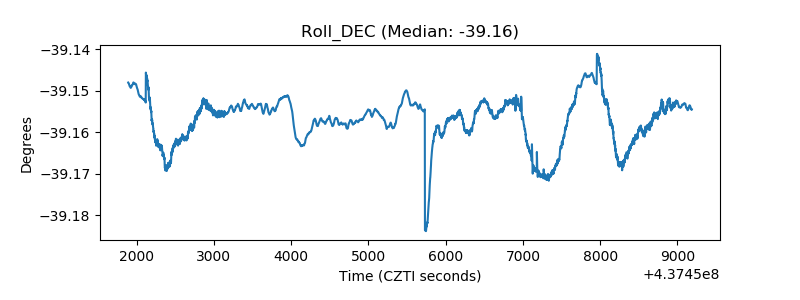 |
| _Roll_RA | 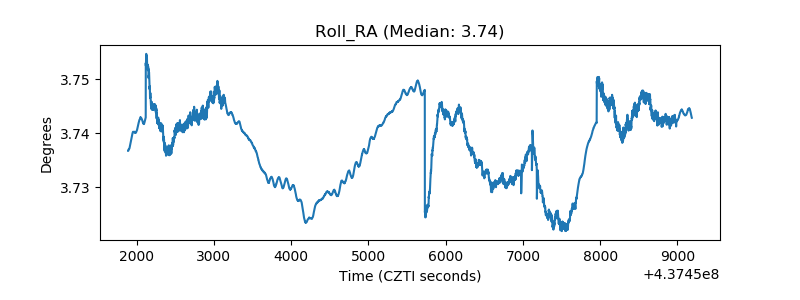 |
| Veto Counter | 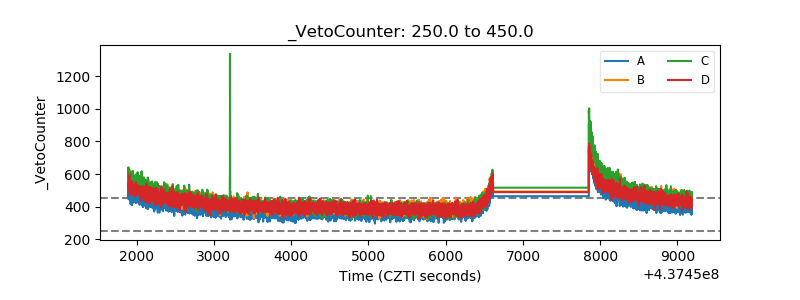 |