| Param | Original file | Final file |
|---|---|---|
| Filename | modeM0/AS1A13_023T01_9000005916_43924cztM0_level2.fits | modeM0/AS1A13_023T01_9000005916_43924cztM0_level2_quad_clean.evt |
| Size (bytes) | 429,238,080 | 109,440,000 |
| Size | 409.4 MB | 104.4 MB |
| Events in quadrant A | 4,699,649 | 734,785 |
| Events in quadrant B | 3,485,595 | 764,241 |
| Events in quadrant C | 3,091,159 | 733,791 |
| Events in quadrant D | 4,129,563 | 648,103 |
| Mode SS | |||
|---|---|---|---|
| Quadrant | BADHDUFLAG | Total packets | Discarded packets |
| A | 0 | 124 | 0 |
| B | 0 | 124 | 0 |
| C | 0 | 124 | 0 |
| D | 0 | 124 | 0 |
| Mode M9 | |||
|---|---|---|---|
| Quadrant | BADHDUFLAG | Total packets | Discarded packets |
| A | 0 | 12 | 0 |
| B | 0 | 12 | 0 |
| C | 0 | 12 | 0 |
| D | 0 | 12 | 0 |
| Mode M0 | |||
|---|---|---|---|
| Quadrant | BADHDUFLAG | Total packets | Discarded packets |
| A | 0 | 18833 | 1 |
| B | 0 | 14305 | 1 |
| C | 0 | 13003 | 1 |
| D | 0 | 16336 | 1 |
| Quadrant | Total seconds | Saturated seconds | Saturation percentage |
|---|---|---|---|
| A | 6213 | 165 | 2.655722% |
| B | 6214 | 207 | 3.331188% |
| C | 6214 | 71 | 1.142581% |
| D | 6214 | 324 | 5.214033% |
Noise dominated data is calculated using 1-second bins in cleaned event files. If a bin has >2000 counts, and if more than 50% of those come from <1% of pixels, then it is considered to be noise-dominated and hence unusable.
| Quadrant | # 1 sec bins | Bins with >0 counts | Bins with >2000 counts | High rate bins dominated by noise | Noise dominated (total time) | Noise dominated (detector-on time) | Marked lightcurve |
|---|---|---|---|---|---|---|---|
| A | 7388 | 6215 | 34 | 34 | 0.46% | 0.55% | 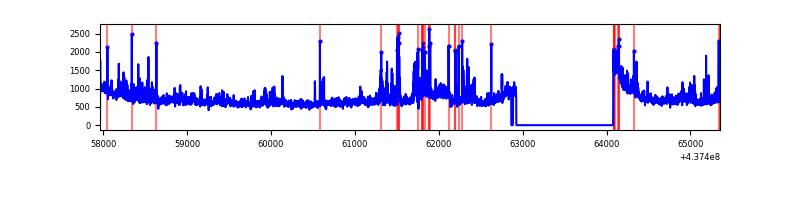 |
| B | 7389 | 6216 | 78 | 78 | 1.06% | 1.25% | 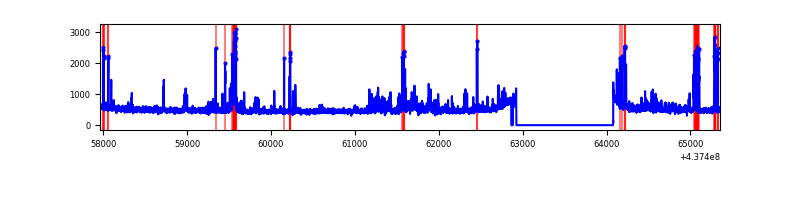 |
| C | 7389 | 6216 | 4 | 4 | 0.05% | 0.06% | 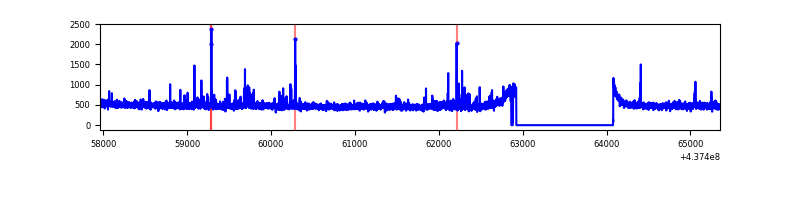 |
| D | 7389 | 6216 | 237 | 237 | 3.21% | 3.81% | 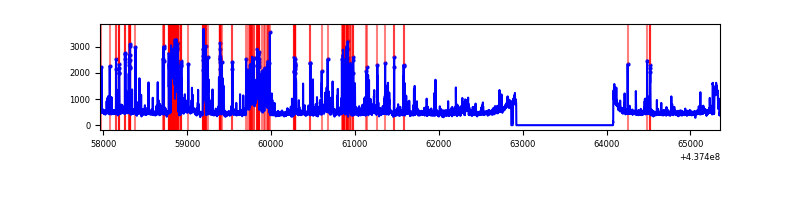 |
Top three noisy pixels from each quadrant. If the there are fewer than three noisy pixels in the level2.evt file, extra rows are filled as -1
| Pixel properties | Quadrant properties | ||||||
|---|---|---|---|---|---|---|---|
| Quadrant | DetID | PixID | Counts | Sigma | Mean | Median | Sigma |
| A | 10 | 83 | 1023007 | 6743.46 | 741 | 727 | 151.6 |
| A | 15 | 222 | 348279 | 2292.62 | 741 | 727 | 151.6 |
| A | 15 | 223 | 222471 | 1462.73 | 741 | 727 | 151.6 |
| B | 5 | 172 | 267729 | 1850.15 | 741 | 720 | 144.3 |
| B | 0 | 213 | 119803 | 825.15 | 741 | 720 | 144.3 |
| B | 0 | 245 | 61729 | 422.74 | 741 | 720 | 144.3 |
| C | 10 | 22 | 108314 | 623.9 | 738 | 743 | 172.4 |
| C | 14 | 254 | 70527 | 404.74 | 738 | 743 | 172.4 |
| C | 3 | 233 | 17646 | 98.03 | 738 | 743 | 172.4 |
| D | 7 | 80 | 760365 | 4226.39 | 721 | 700 | 179.7 |
| D | 5 | 235 | 119630 | 661.67 | 721 | 700 | 179.7 |
| D | 1 | 52 | 100239 | 553.79 | 721 | 700 | 179.7 |
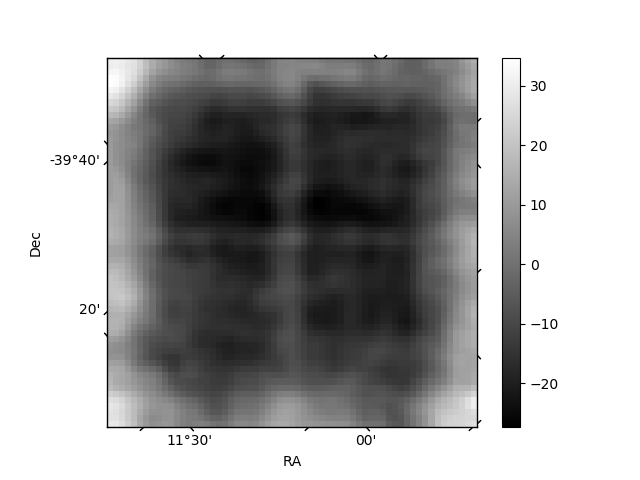
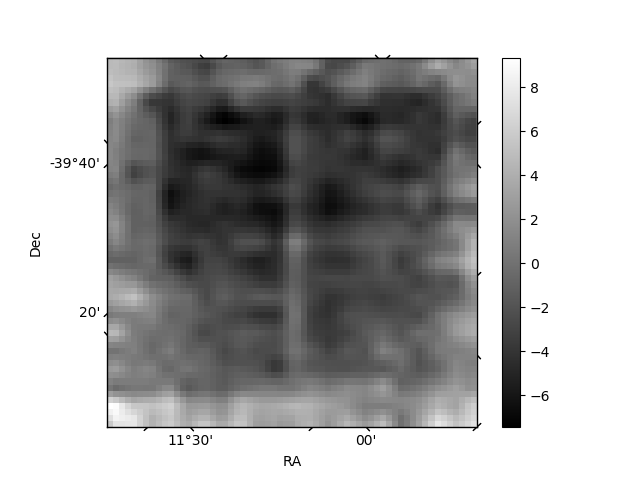
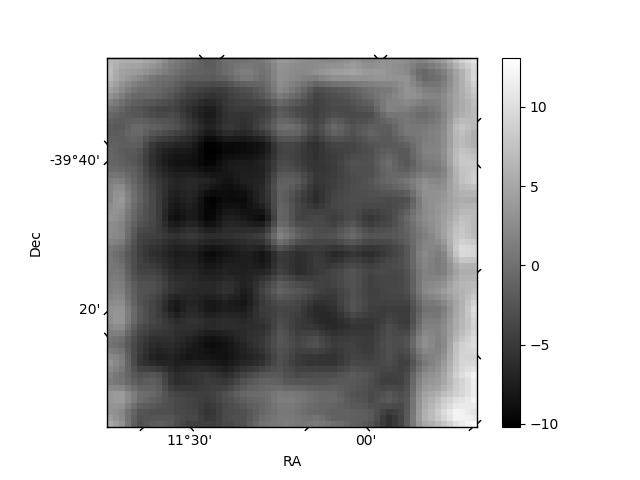
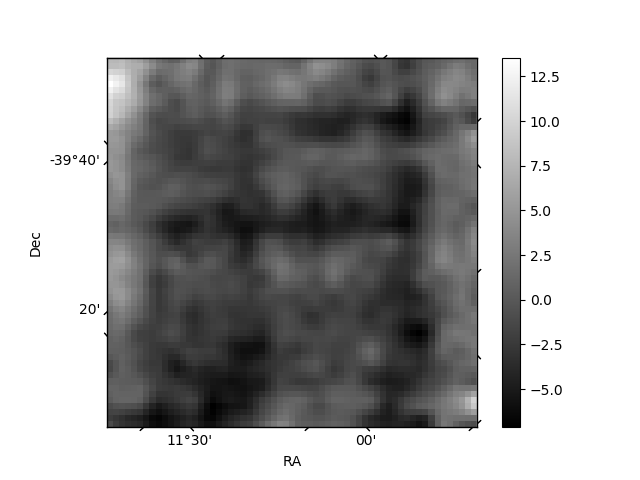
Histogram calculated using DETX and DETY for each event in the final _common_clean file
| Quadrant A | 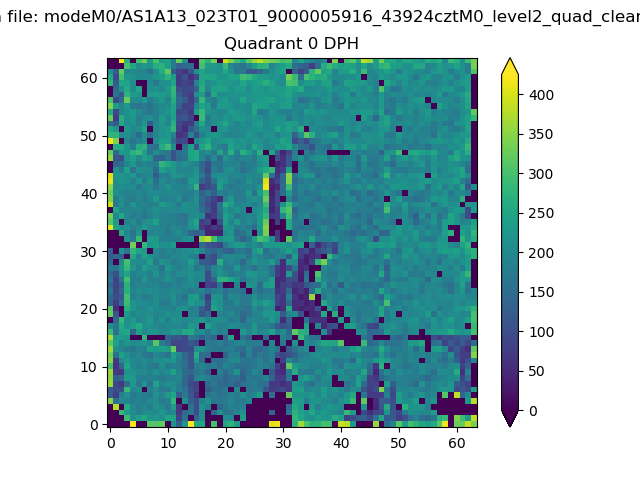 |
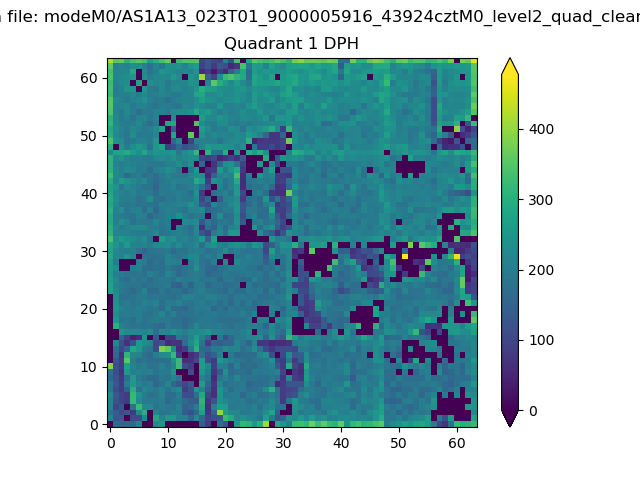 |
Quadrant B |
|---|---|---|---|
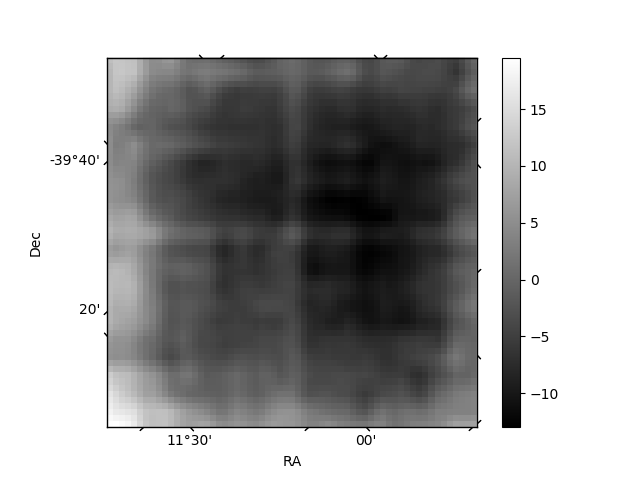
| Quadrant D | 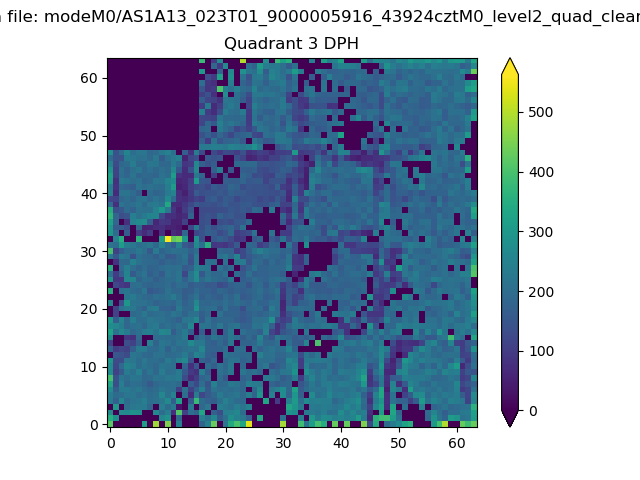 |
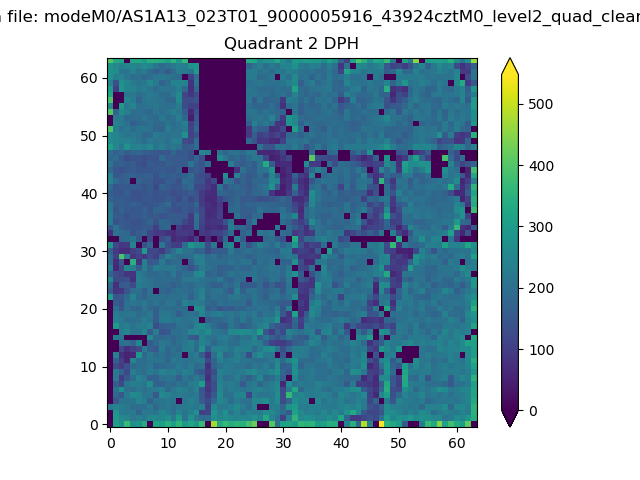 |
Quadrant C |
| Plot type | Count rate plots | Images |
|---|---|---|
| Comparison with Poisson distribution Blue bars denote a histogram of data divided into 1 sec bins. Red curve is a Poisson curve with rate = median count rate of data. |
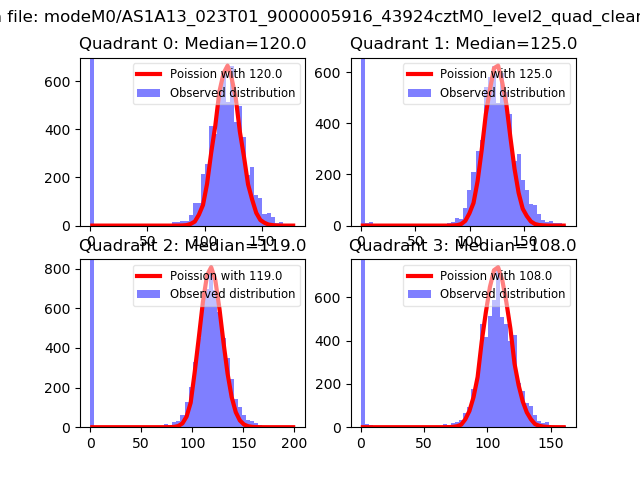 |
 |
| Quadrant-wise count rates Data is divided into 100 sec bins |
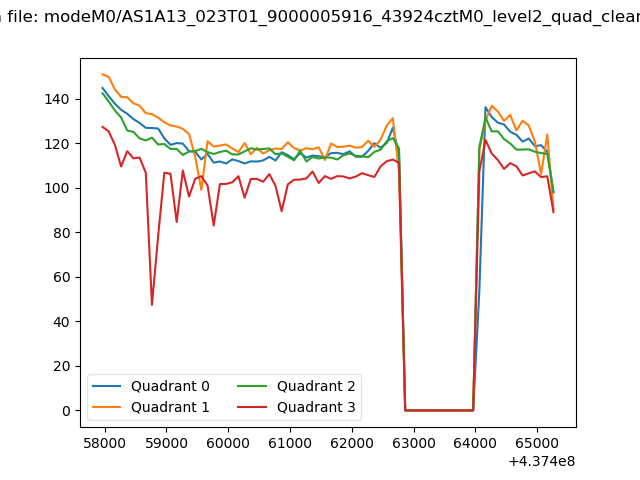 |
|
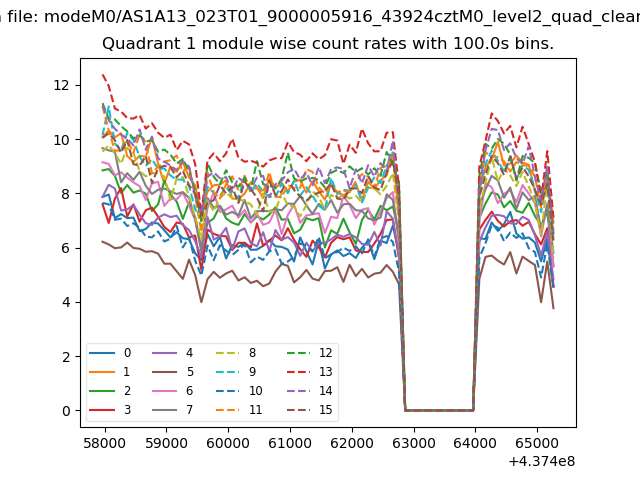
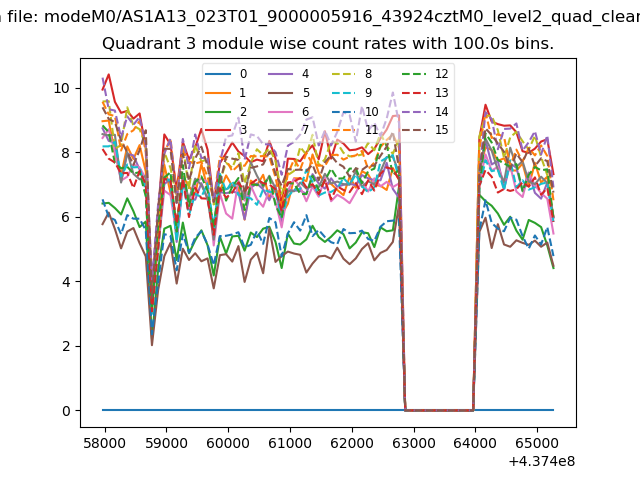
| Module-wise count rates for Quadrant A Data is divided into 100 sec bins |
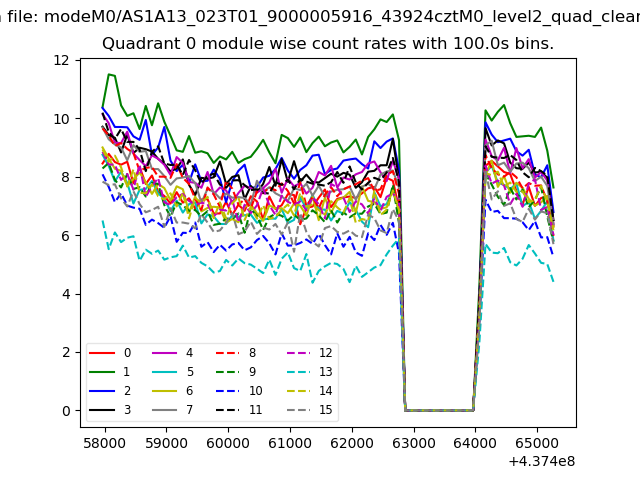 |
 |
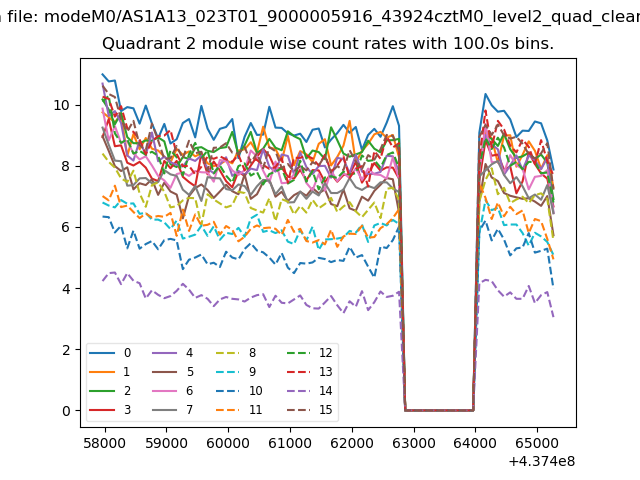
| Module-wise count rates for Quadrant B Data is divided into 100 sec bins |
 |
 |
| Module-wise count rates for Quadrant C Data is divided into 100 sec bins |
 |
 |
| Module-wise count rates for Quadrant D Data is divided into 100 sec bins |
 |
 |
| Parameter | Plot |
|---|---|
| CZT HV Monitor | 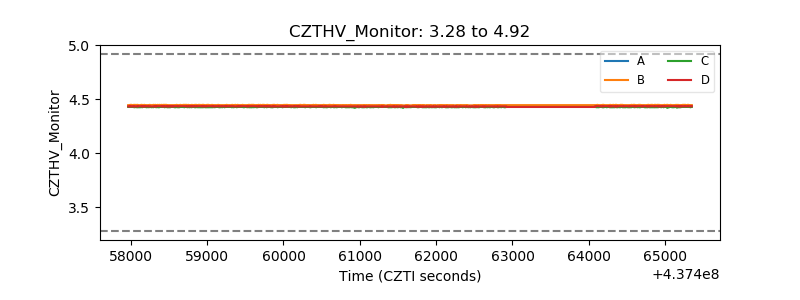 |
| D_VDD | 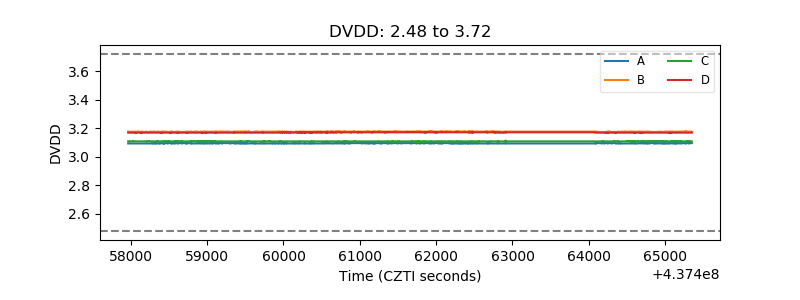 |
| Temperature 1 | 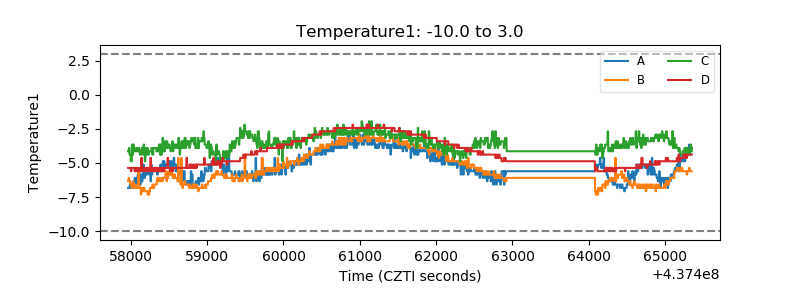 |
| Veto HV Monitor | 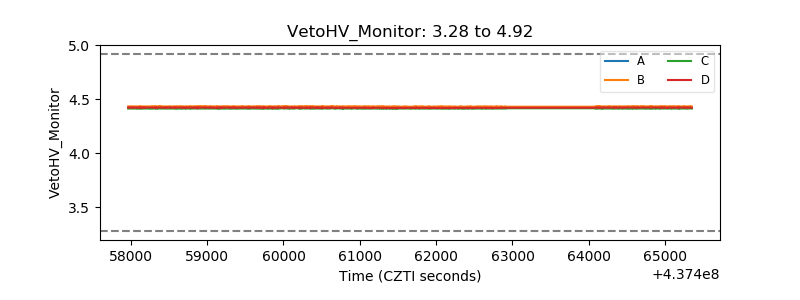 |
| Veto LLD | 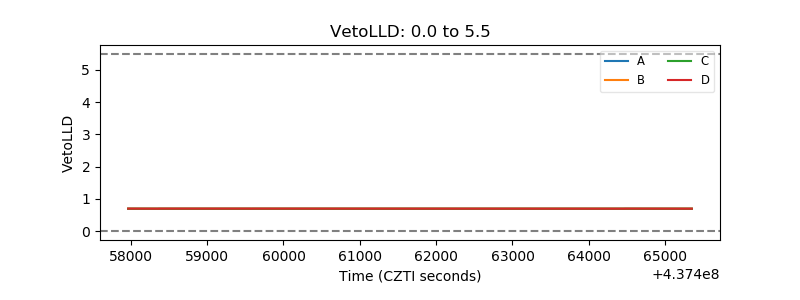 |
| Alpha Counter | 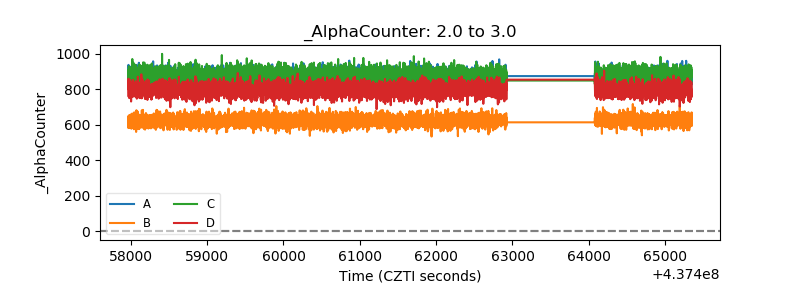 |
| _CPM_Rate | 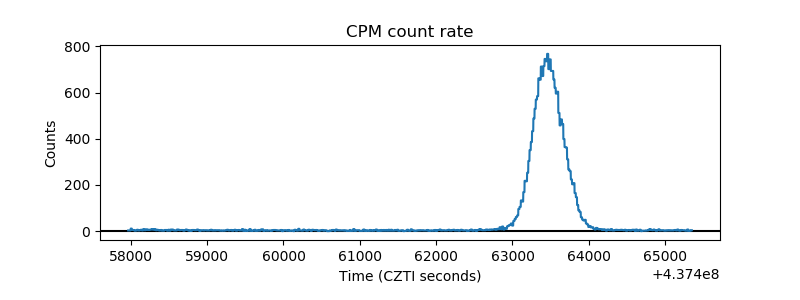 |
| CZT Counter | 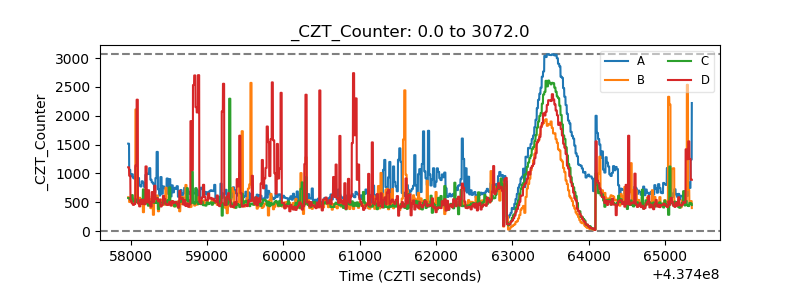 |
| +2.5 Volts monitor | 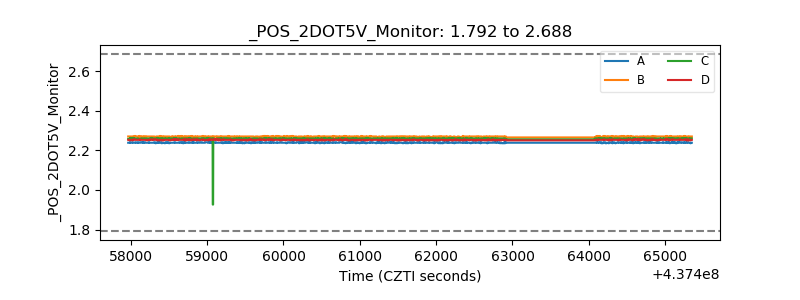 |
| +5 Volts monitor | 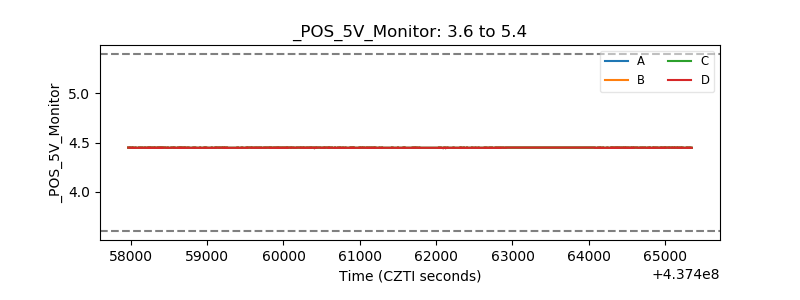 |
| _ROLL_ROT | 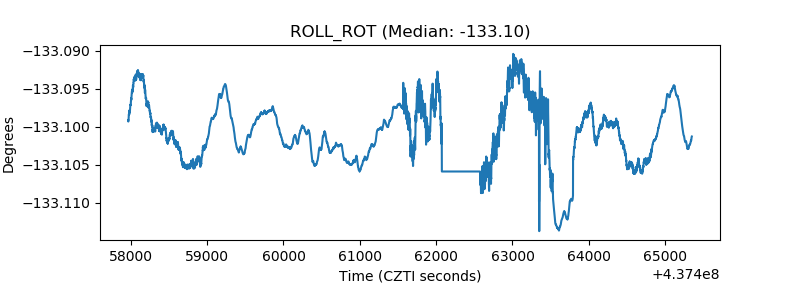 |
| _Roll_DEC | 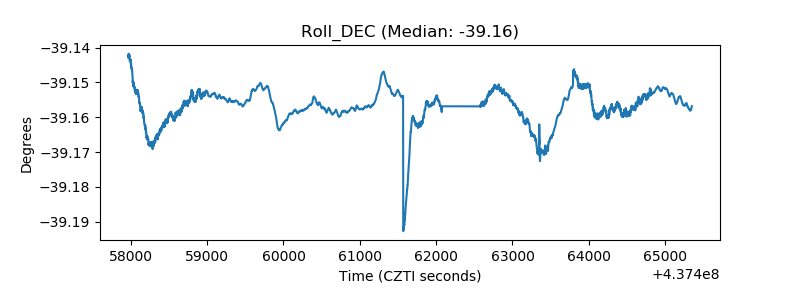 |
| _Roll_RA | 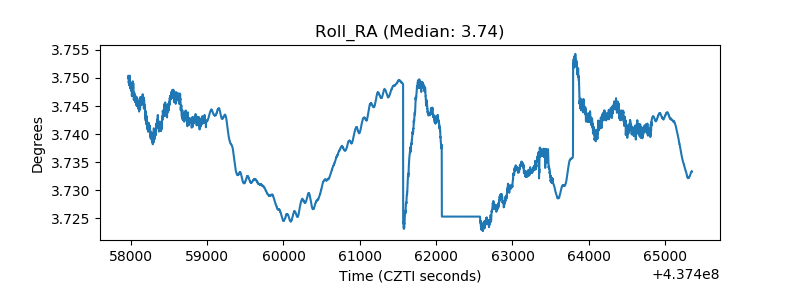 |
| Veto Counter | 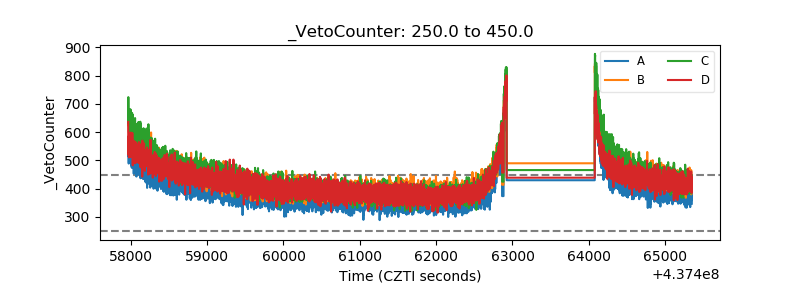 |