| Param | Original file | Final file |
|---|---|---|
| Filename | modeM0/AS1A13_023T01_9000005916_43925cztM0_level2.fits | modeM0/AS1A13_023T01_9000005916_43925cztM0_level2_quad_clean.evt |
| Size (bytes) | 496,321,920 | 115,750,080 |
| Size | 473.3 MB | 110.4 MB |
| Events in quadrant A | 5,726,690 | 760,756 |
| Events in quadrant B | 4,332,025 | 792,422 |
| Events in quadrant C | 3,500,320 | 777,299 |
| Events in quadrant D | 4,276,108 | 692,780 |
| Mode SS | |||
|---|---|---|---|
| Quadrant | BADHDUFLAG | Total packets | Discarded packets |
| A | 0 | 142 | 0 |
| B | 0 | 142 | 0 |
| C | 0 | 142 | 0 |
| D | 0 | 142 | 0 |
| Mode M9 | |||
|---|---|---|---|
| Quadrant | BADHDUFLAG | Total packets | Discarded packets |
| A | 0 | 21 | 0 |
| B | 0 | 21 | 0 |
| C | 0 | 21 | 0 |
| D | 0 | 21 | 0 |
| Mode M0 | |||
|---|---|---|---|
| Quadrant | BADHDUFLAG | Total packets | Discarded packets |
| A | 0 | 22419 | 3 |
| B | 0 | 17343 | 2 |
| C | 0 | 15019 | 2 |
| D | 0 | 17366 | 2 |
| Quadrant | Total seconds | Saturated seconds | Saturation percentage |
|---|---|---|---|
| A | 6915 | 436 | 6.305134% |
| B | 6916 | 458 | 6.622325% |
| C | 6916 | 223 | 3.224407% |
| D | 6916 | 370 | 5.349913% |
Noise dominated data is calculated using 1-second bins in cleaned event files. If a bin has >2000 counts, and if more than 50% of those come from <1% of pixels, then it is considered to be noise-dominated and hence unusable.
| Quadrant | # 1 sec bins | Bins with >0 counts | Bins with >2000 counts | High rate bins dominated by noise | Noise dominated (total time) | Noise dominated (detector-on time) | Marked lightcurve |
|---|---|---|---|---|---|---|---|
| A | 9065 | 6918 | 59 | 59 | 0.65% | 0.85% | 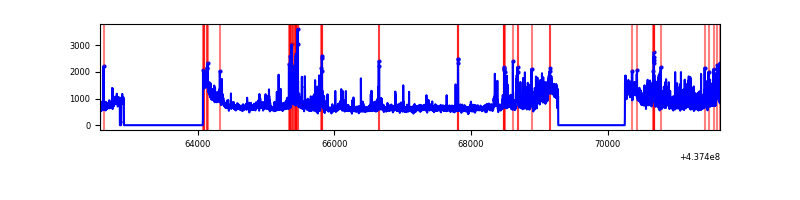 |
| B | 9066 | 6919 | 122 | 122 | 1.35% | 1.76% | 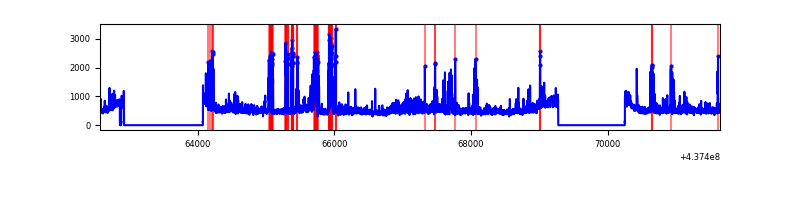 |
| C | 9066 | 6919 | 16 | 16 | 0.18% | 0.23% | 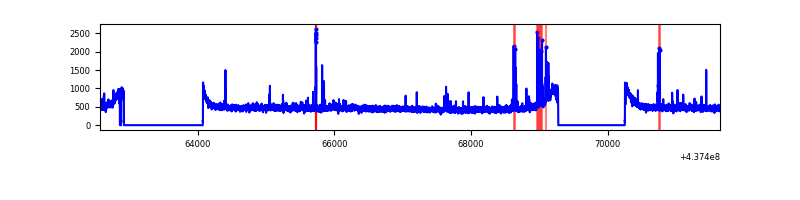 |
| D | 9066 | 6919 | 161 | 161 | 1.78% | 2.33% | 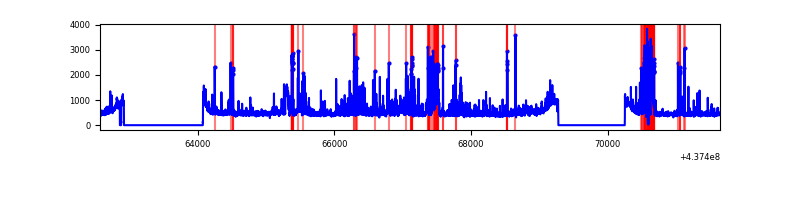 |
Top three noisy pixels from each quadrant. If the there are fewer than three noisy pixels in the level2.evt file, extra rows are filled as -1
| Pixel properties | Quadrant properties | ||||||
|---|---|---|---|---|---|---|---|
| Quadrant | DetID | PixID | Counts | Sigma | Mean | Median | Sigma |
| A | 10 | 83 | 1172686 | 6859.36 | 827 | 809 | 170.8 |
| A | 15 | 223 | 561943 | 3284.49 | 827 | 809 | 170.8 |
| A | 15 | 222 | 552889 | 3231.49 | 827 | 809 | 170.8 |
| B | 5 | 172 | 570045 | 3427.52 | 830 | 802 | 166.1 |
| B | 0 | 213 | 209198 | 1254.79 | 830 | 802 | 166.1 |
| B | 5 | 235 | 135617 | 811.75 | 830 | 802 | 166.1 |
| C | 10 | 22 | 84241 | 423.1 | 835 | 839 | 197.1 |
| C | 14 | 254 | 78493 | 393.94 | 835 | 839 | 197.1 |
| C | 15 | 158 | 32158 | 158.88 | 835 | 839 | 197.1 |
| D | 5 | 235 | 358489 | 1705.5 | 825 | 797 | 209.7 |
| D | 1 | 52 | 285089 | 1355.52 | 825 | 797 | 209.7 |
| D | 7 | 38 | 134272 | 636.42 | 825 | 797 | 209.7 |
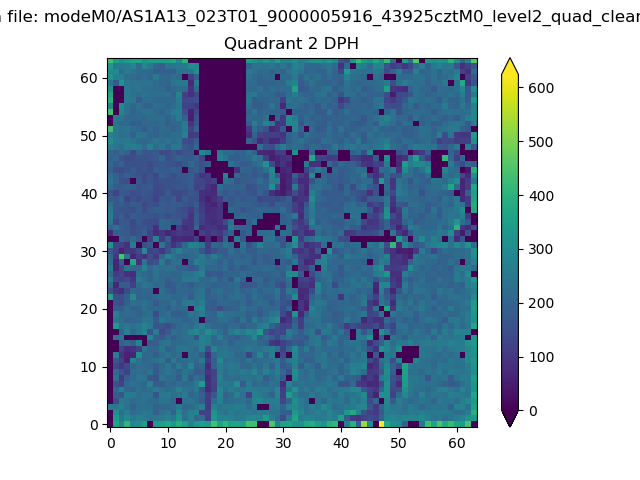
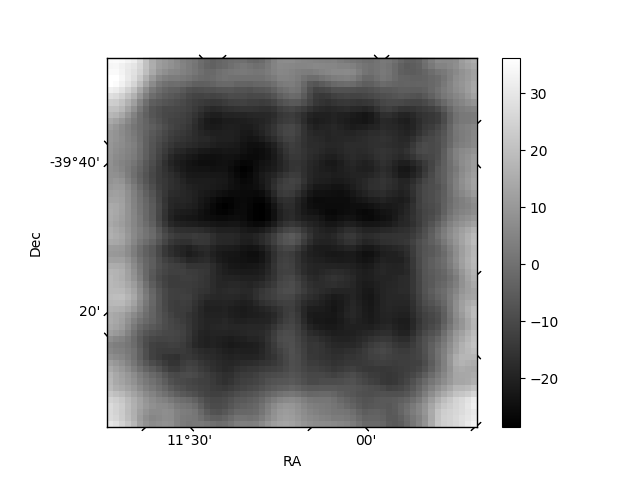
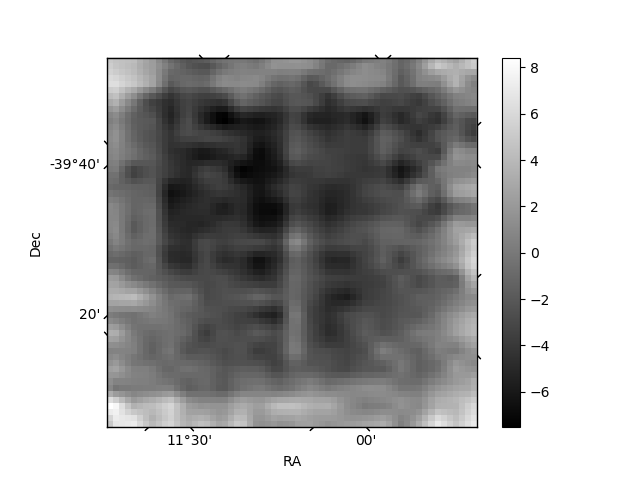
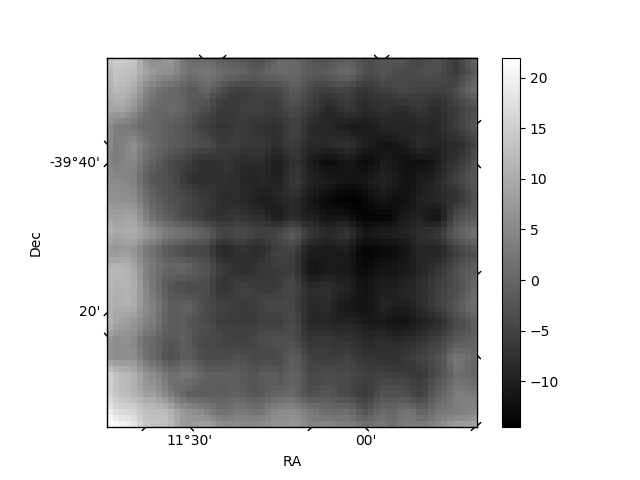
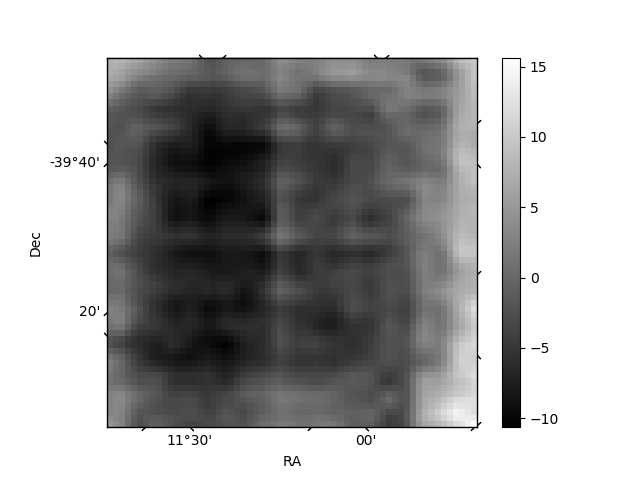
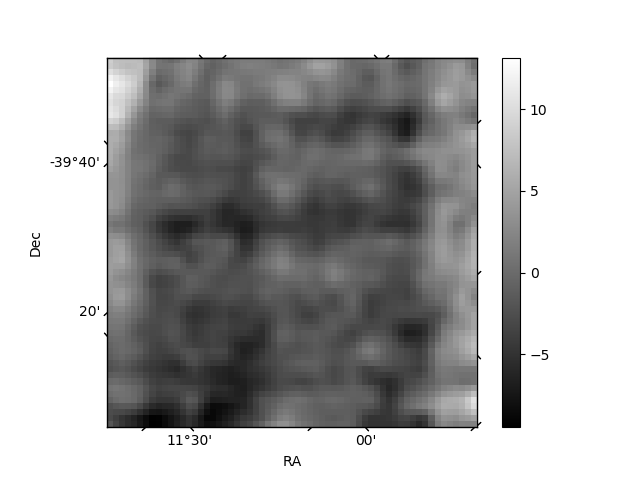
Histogram calculated using DETX and DETY for each event in the final _common_clean file
| Quadrant A | 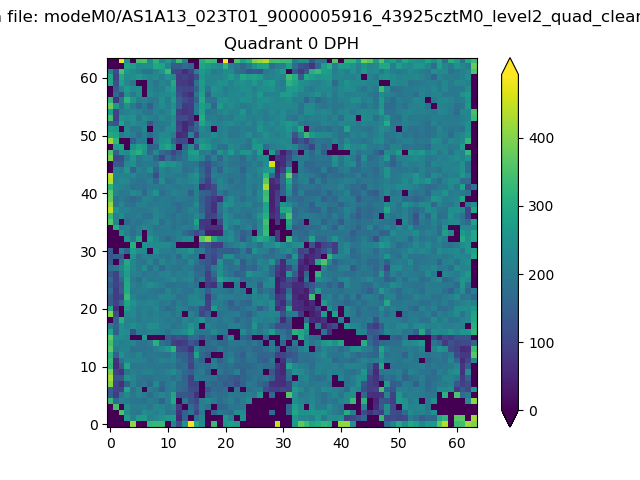 |
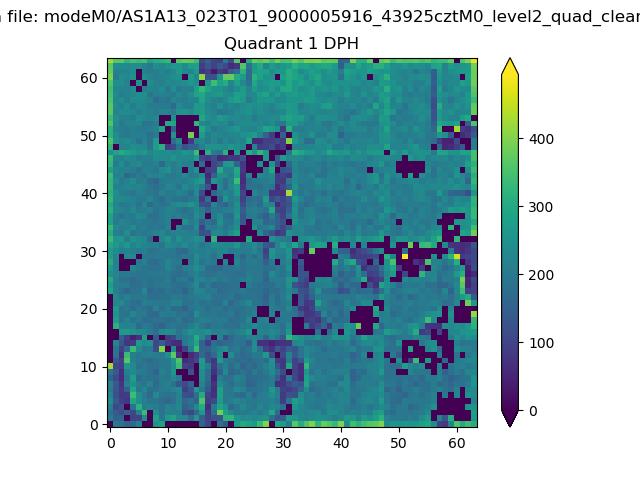 |
Quadrant B |
|---|---|---|---|
| Quadrant D | 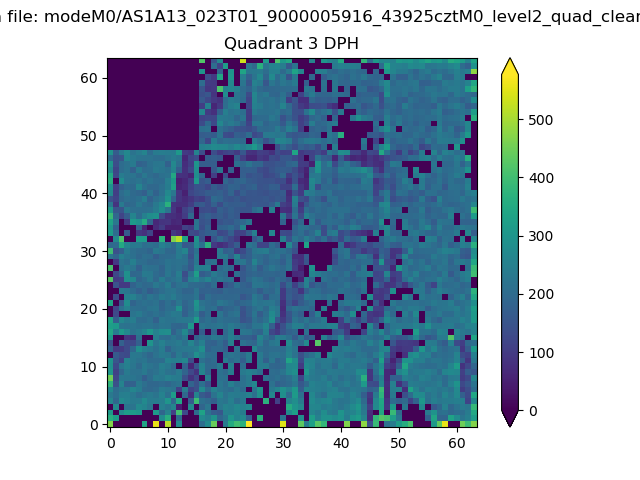 |
 |
Quadrant C |
| Plot type | Count rate plots | Images |
|---|---|---|
| Comparison with Poisson distribution Blue bars denote a histogram of data divided into 1 sec bins. Red curve is a Poisson curve with rate = median count rate of data. |
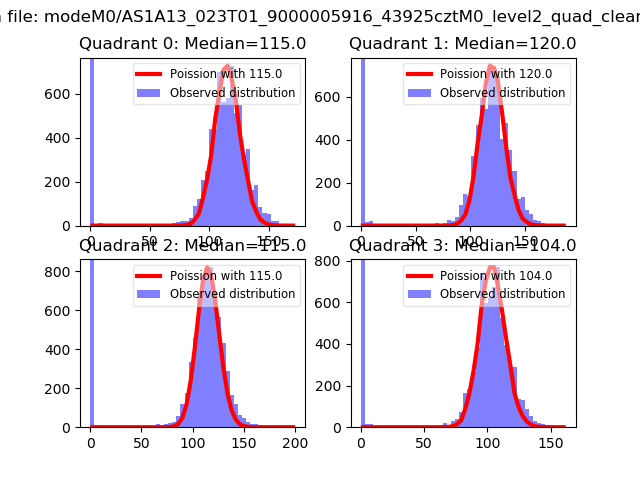 |
 |
| Quadrant-wise count rates Data is divided into 100 sec bins |
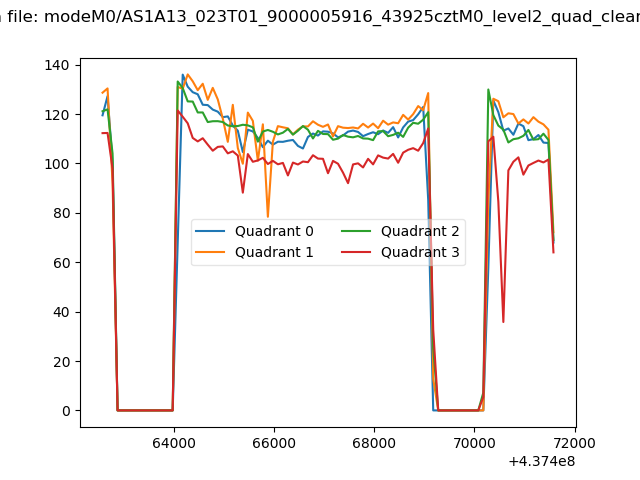 |
|
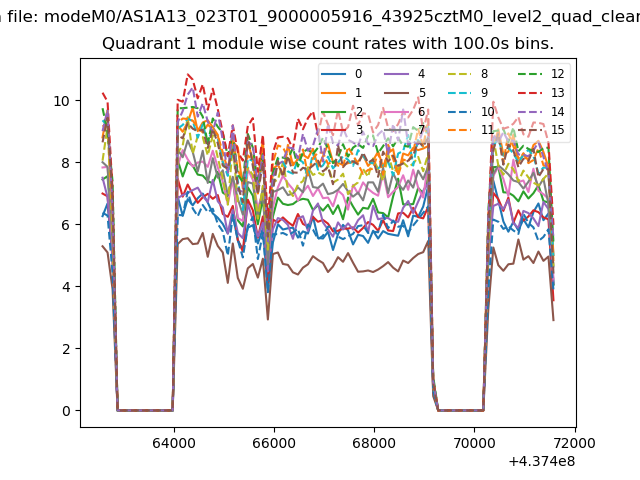
| Module-wise count rates for Quadrant A Data is divided into 100 sec bins |
 |
 |
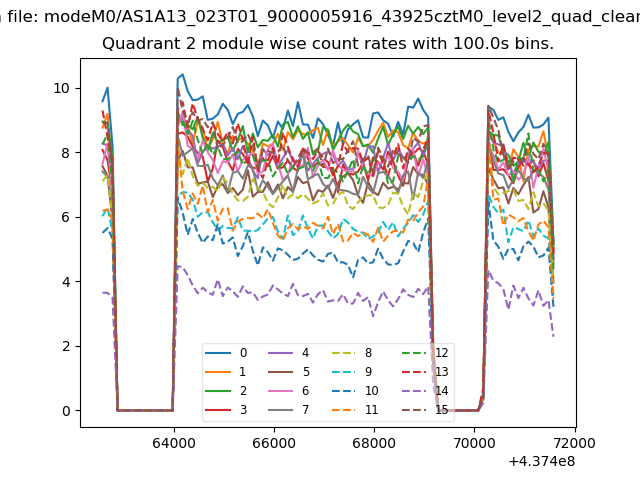
| Module-wise count rates for Quadrant B Data is divided into 100 sec bins |
 |
 |
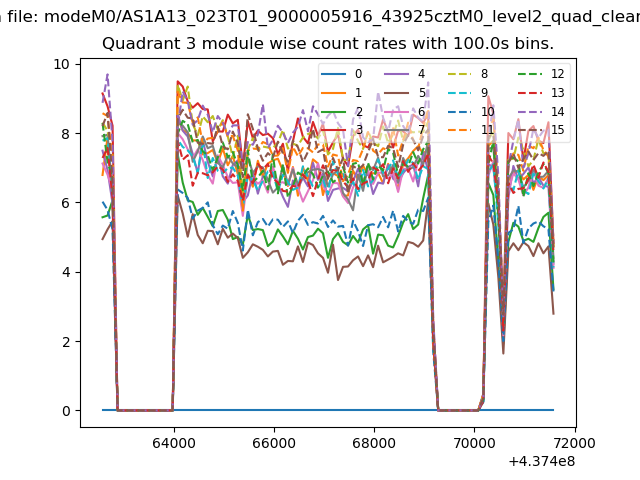
| Module-wise count rates for Quadrant C Data is divided into 100 sec bins |
 |
 |
| Module-wise count rates for Quadrant D Data is divided into 100 sec bins |
 |
 |
| Parameter | Plot |
|---|---|
| CZT HV Monitor | 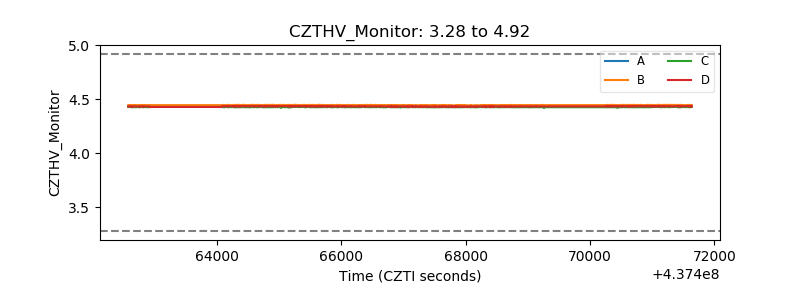 |
| D_VDD | 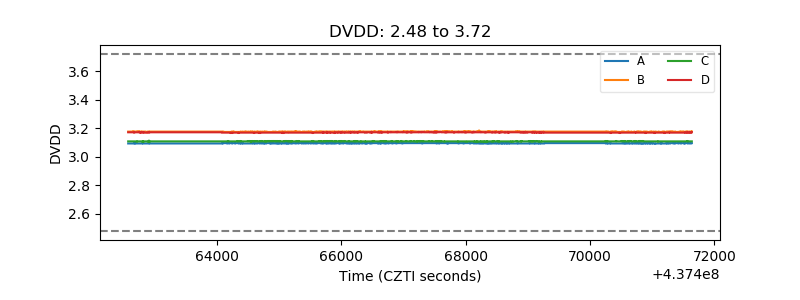 |
| Temperature 1 | 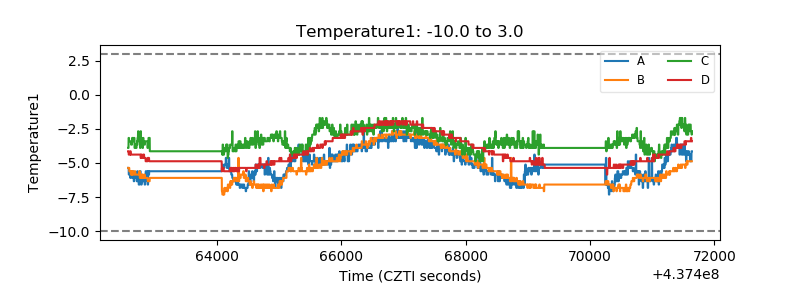 |
| Veto HV Monitor | 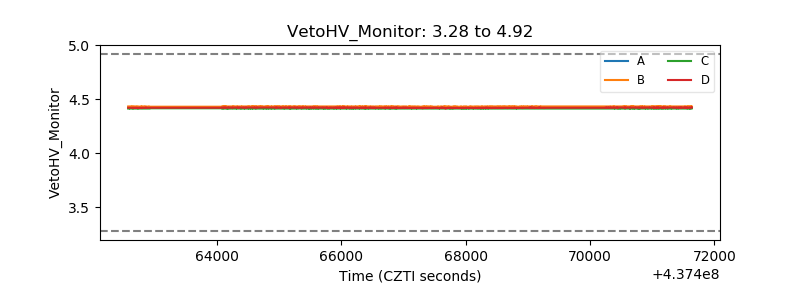 |
| Veto LLD | 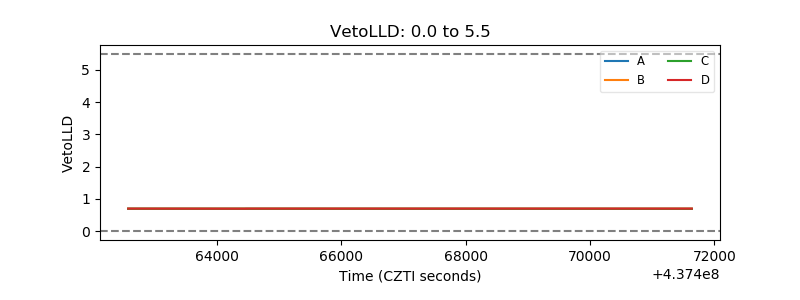 |
| Alpha Counter | 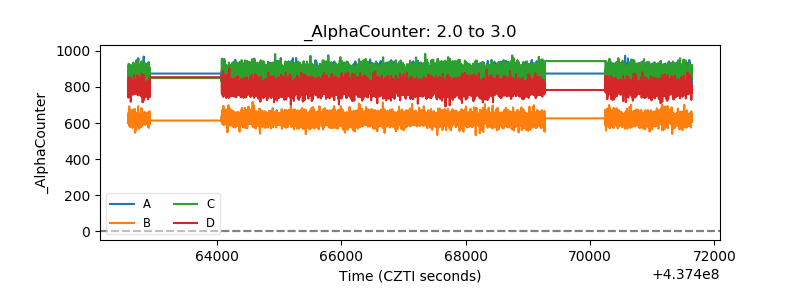 |
| _CPM_Rate | 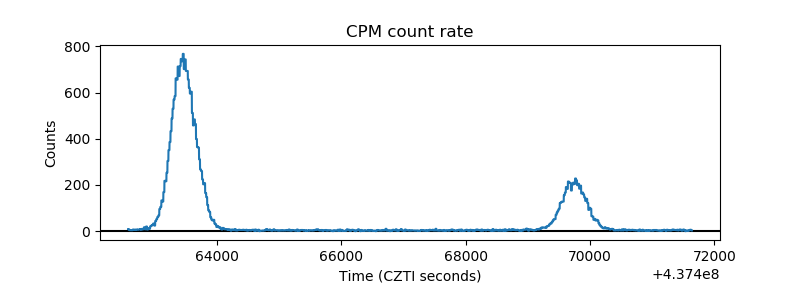 |
| CZT Counter | 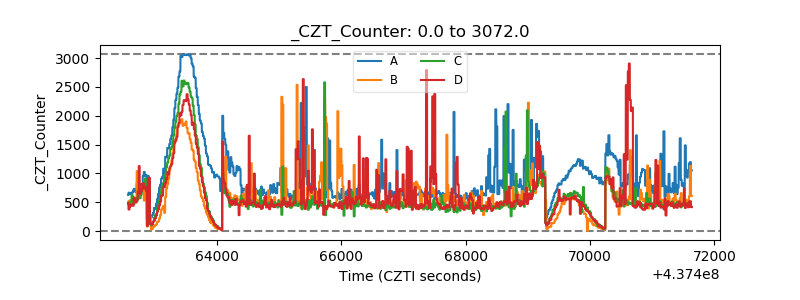 |
| +2.5 Volts monitor | 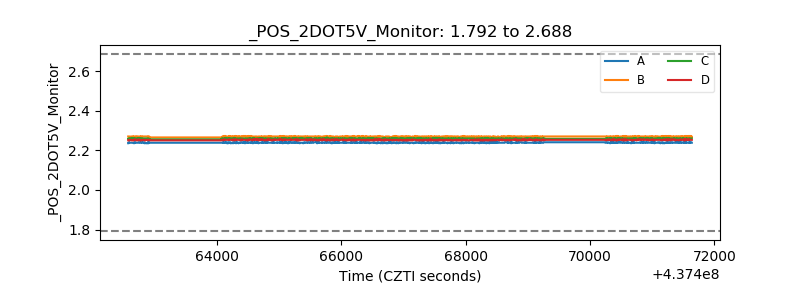 |
| +5 Volts monitor | 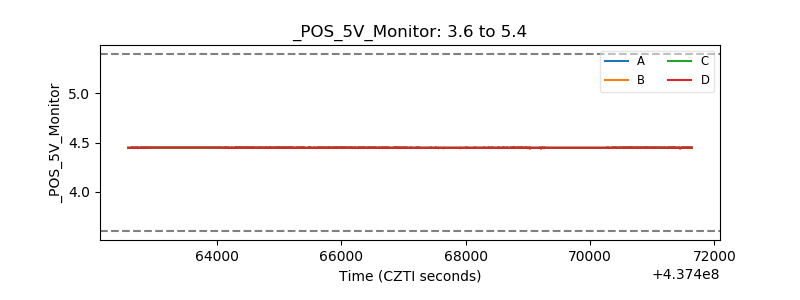 |
| _ROLL_ROT | 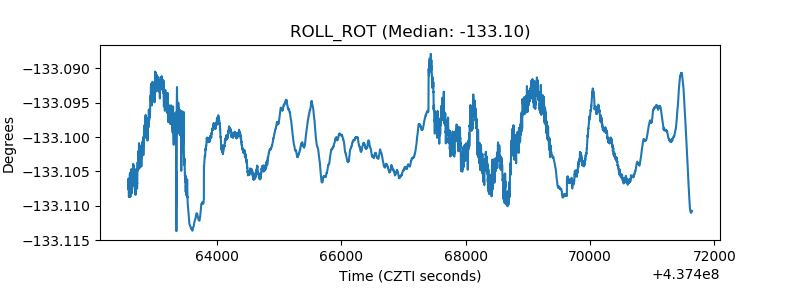 |
| _Roll_DEC | 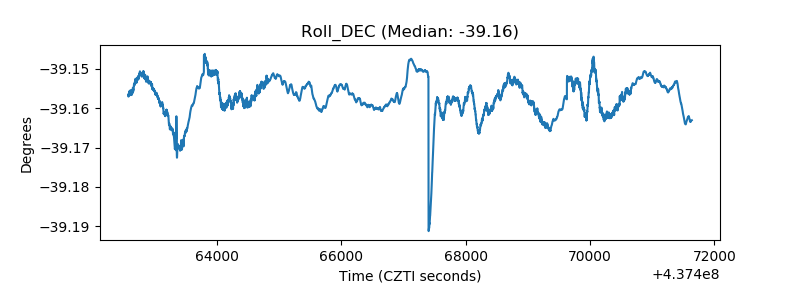 |
| _Roll_RA | 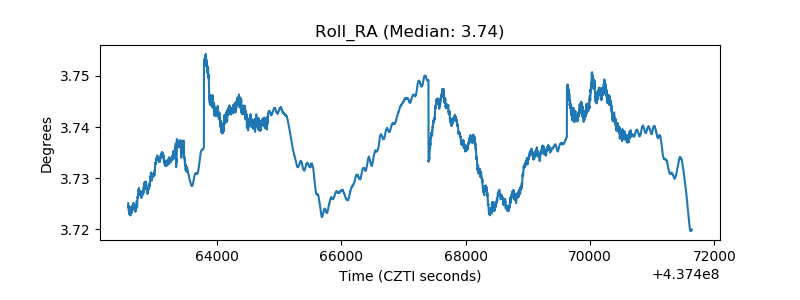 |
| Veto Counter | 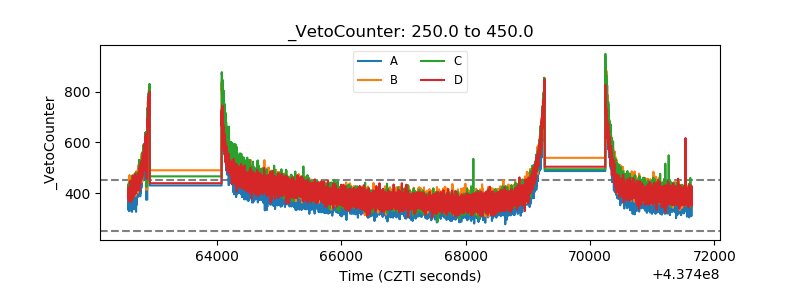 |