| Param | Original file | Final file |
|---|---|---|
| Filename | modeM0/AS1A13_023T01_9000005916_43926cztM0_level2.fits | modeM0/AS1A13_023T01_9000005916_43926cztM0_level2_quad_clean.evt |
| Size (bytes) | 568,244,160 | 119,148,480 |
| Size | 541.9 MB | 113.6 MB |
| Events in quadrant A | 7,518,819 | 768,010 |
| Events in quadrant B | 4,419,150 | 819,901 |
| Events in quadrant C | 3,708,045 | 800,550 |
| Events in quadrant D | 4,811,677 | 701,461 |
| Mode SS | |||
|---|---|---|---|
| Quadrant | BADHDUFLAG | Total packets | Discarded packets |
| A | 0 | 154 | 0 |
| B | 0 | 154 | 0 |
| C | 0 | 154 | 0 |
| D | 0 | 154 | 0 |
| Mode M9 | |||
|---|---|---|---|
| Quadrant | BADHDUFLAG | Total packets | Discarded packets |
| A | 0 | 16 | 0 |
| B | 0 | 16 | 0 |
| C | 0 | 16 | 0 |
| D | 0 | 16 | 0 |
| Mode M0 | |||
|---|---|---|---|
| Quadrant | BADHDUFLAG | Total packets | Discarded packets |
| A | 0 | 27732 | 2 |
| B | 0 | 18018 | 2 |
| C | 0 | 16272 | 2 |
| D | 0 | 19426 | 2 |
| Quadrant | Total seconds | Saturated seconds | Saturation percentage |
|---|---|---|---|
| A | 7437 | 603 | 8.108108% |
| B | 7438 | 420 | 5.646679% |
| C | 7437 | 256 | 3.442248% |
| D | 7437 | 547 | 7.355116% |
Noise dominated data is calculated using 1-second bins in cleaned event files. If a bin has >2000 counts, and if more than 50% of those come from <1% of pixels, then it is considered to be noise-dominated and hence unusable.
| Quadrant | # 1 sec bins | Bins with >0 counts | Bins with >2000 counts | High rate bins dominated by noise | Noise dominated (total time) | Noise dominated (detector-on time) | Marked lightcurve |
|---|---|---|---|---|---|---|---|
| A | 9107 | 7439 | 92 | 92 | 1.01% | 1.24% | 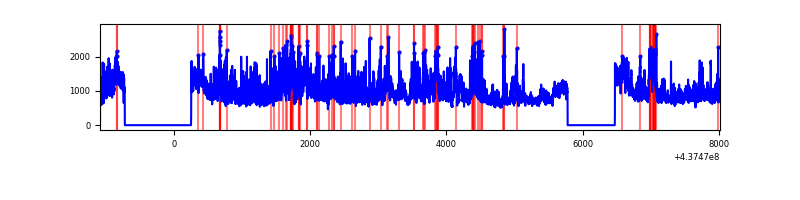 |
| B | 9108 | 7440 | 61 | 61 | 0.67% | 0.82% | 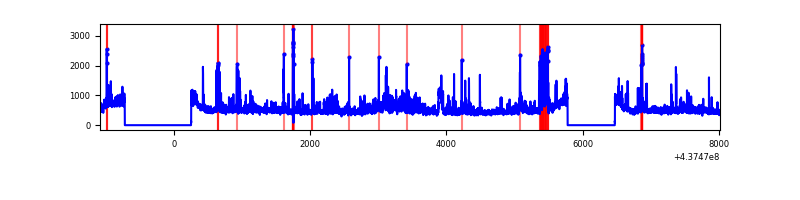 |
| C | 9107 | 7439 | 16 | 16 | 0.18% | 0.22% | 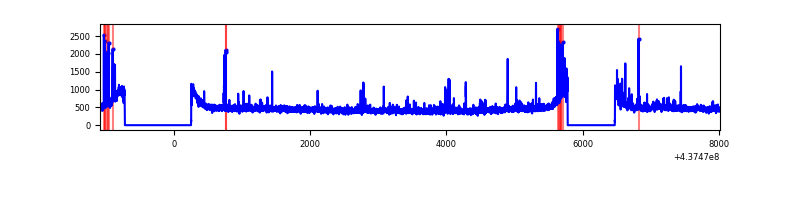 |
| D | 9107 | 7439 | 309 | 309 | 3.39% | 4.15% | 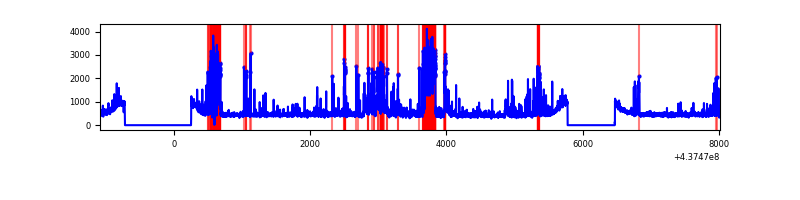 |
Top three noisy pixels from each quadrant. If the there are fewer than three noisy pixels in the level2.evt file, extra rows are filled as -1
| Pixel properties | Quadrant properties | ||||||
|---|---|---|---|---|---|---|---|
| Quadrant | DetID | PixID | Counts | Sigma | Mean | Median | Sigma |
| A | 15 | 222 | 2171070 | 12112.2 | 867 | 847 | 179.2 |
| A | 10 | 83 | 1211207 | 6755.12 | 867 | 847 | 179.2 |
| A | 15 | 223 | 444950 | 2478.58 | 867 | 847 | 179.2 |
| B | 5 | 172 | 226169 | 1275.76 | 876 | 847 | 176.6 |
| B | 0 | 213 | 212329 | 1197.4 | 876 | 847 | 176.6 |
| B | 5 | 235 | 209506 | 1181.41 | 876 | 847 | 176.6 |
| C | 14 | 254 | 72474 | 343.12 | 877 | 882 | 208.7 |
| C | 10 | 22 | 67023 | 316.99 | 877 | 882 | 208.7 |
| C | 15 | 158 | 64712 | 305.92 | 877 | 882 | 208.7 |
| D | 5 | 235 | 746459 | 3439.35 | 858 | 830 | 216.8 |
| D | 1 | 52 | 164163 | 753.4 | 858 | 830 | 216.8 |
| D | 13 | 171 | 161214 | 739.8 | 858 | 830 | 216.8 |
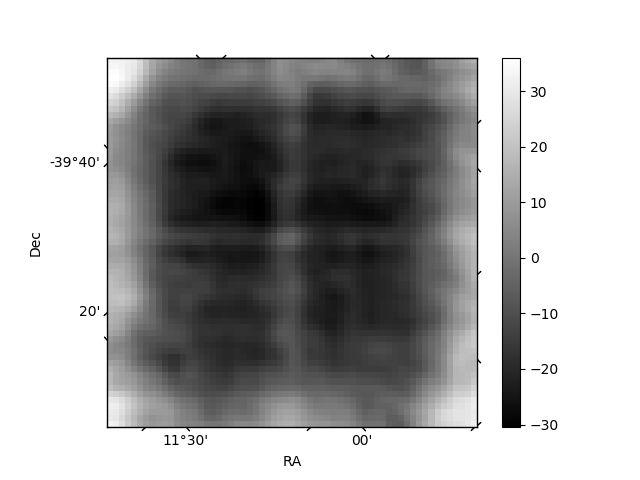
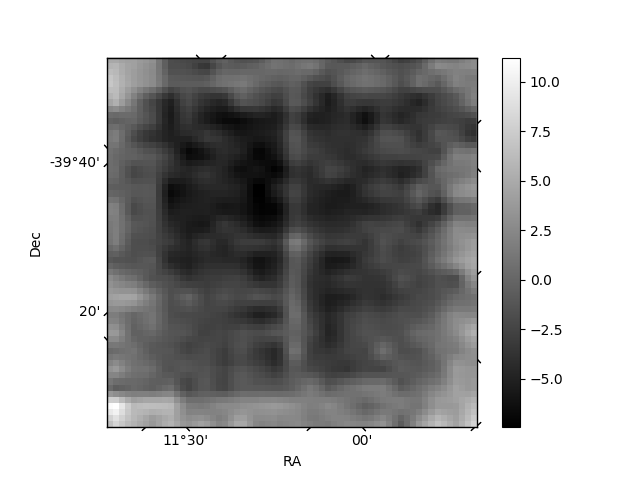
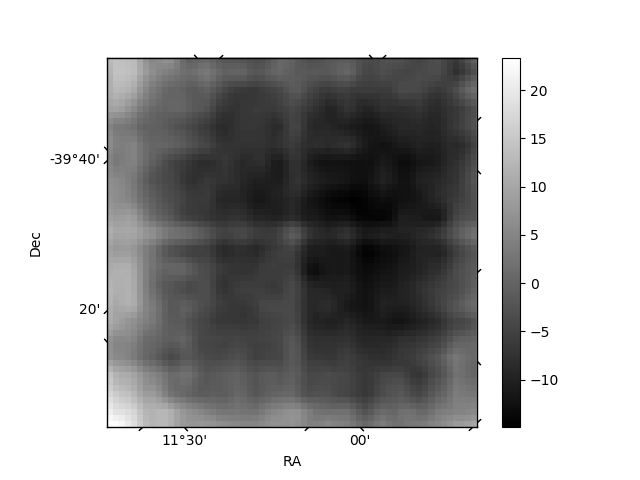
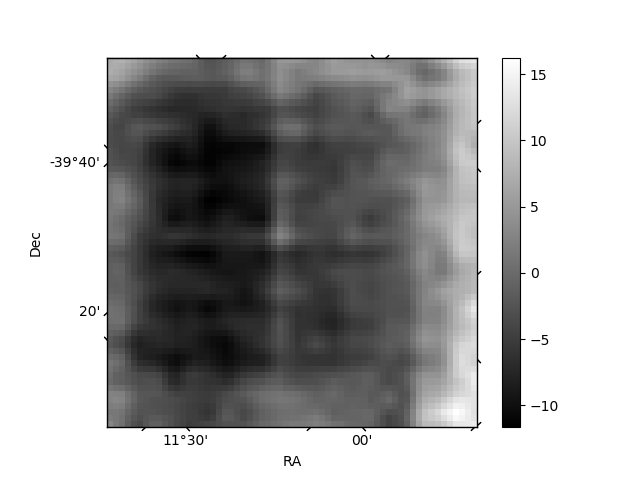
Histogram calculated using DETX and DETY for each event in the final _common_clean file
| Quadrant A | 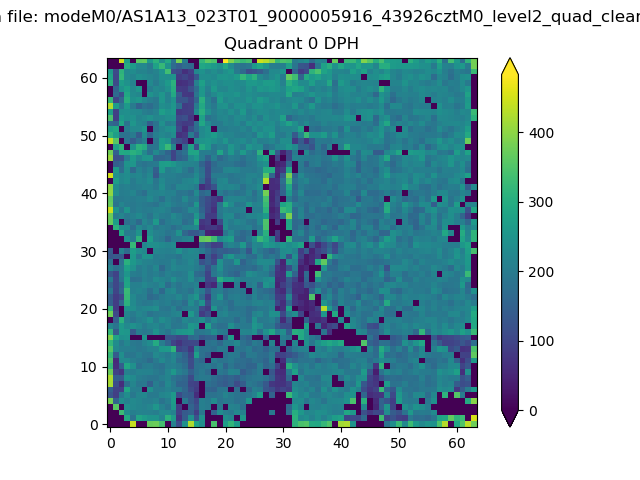 |
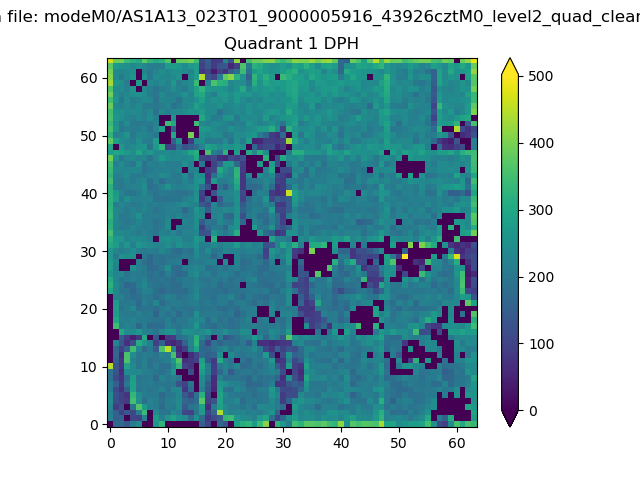 |
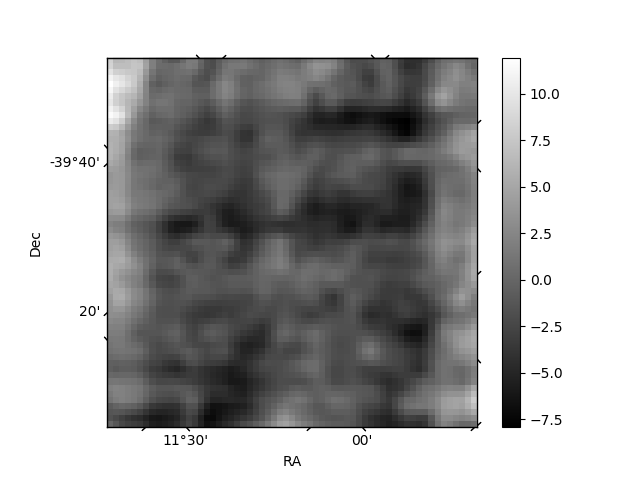
Quadrant B |
|---|---|---|---|
| Quadrant D | 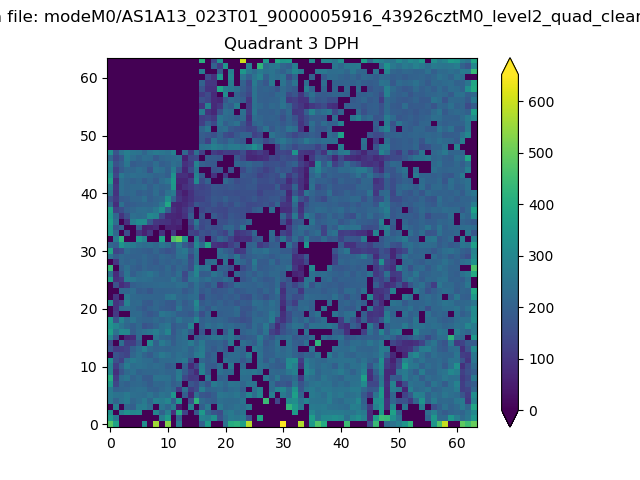 |
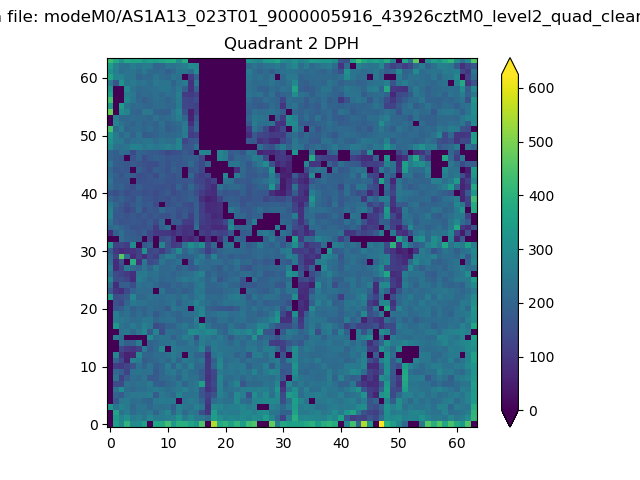 |
Quadrant C |
| Plot type | Count rate plots | Images |
|---|---|---|
| Comparison with Poisson distribution Blue bars denote a histogram of data divided into 1 sec bins. Red curve is a Poisson curve with rate = median count rate of data. |
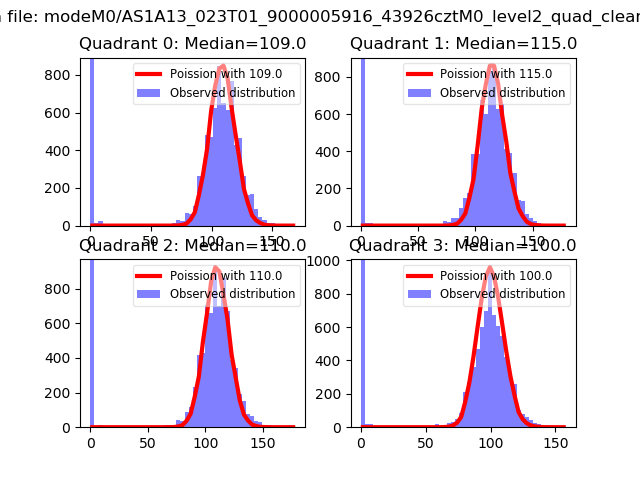 |
 |
| Quadrant-wise count rates Data is divided into 100 sec bins |
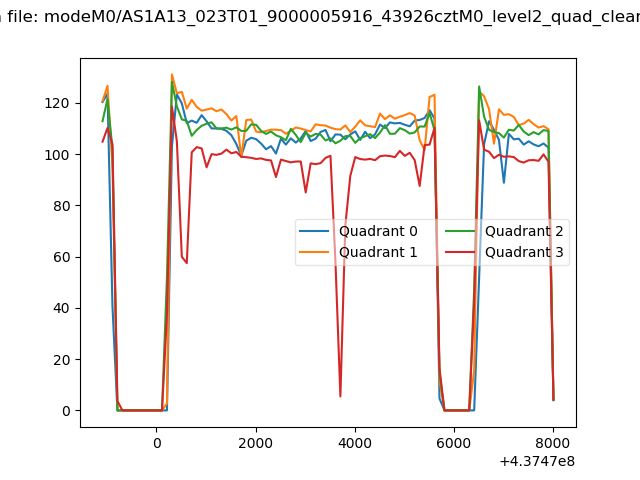 |
|
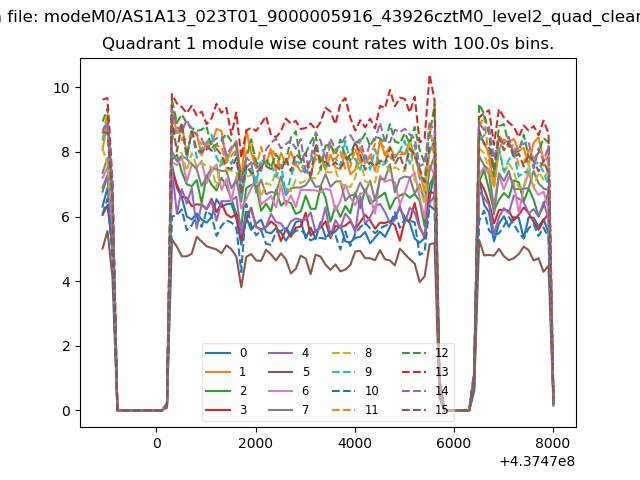
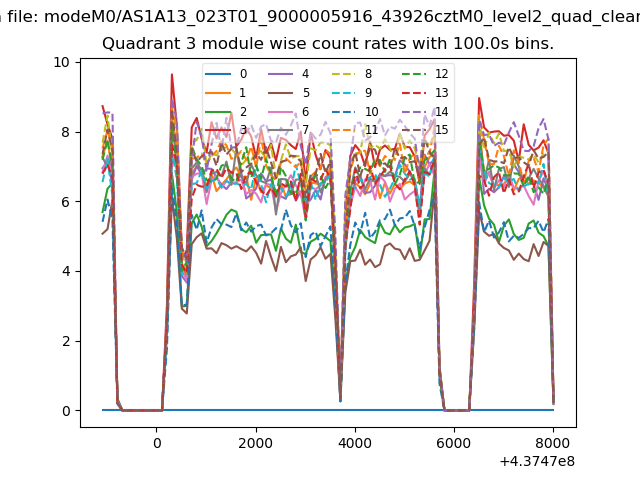
| Module-wise count rates for Quadrant A Data is divided into 100 sec bins |
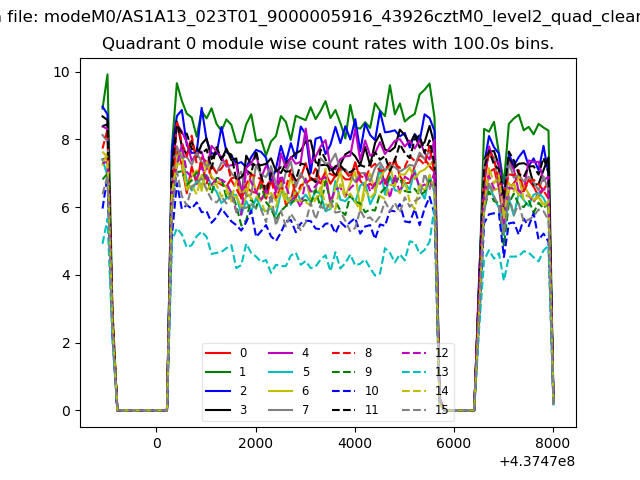 |
 |
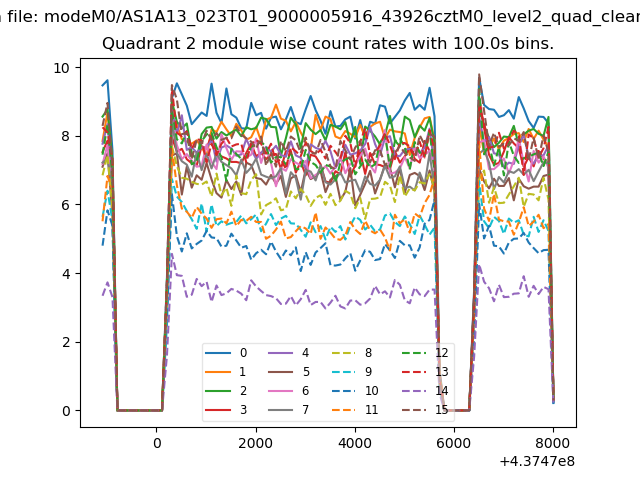
| Module-wise count rates for Quadrant B Data is divided into 100 sec bins |
 |
 |
| Module-wise count rates for Quadrant C Data is divided into 100 sec bins |
 |
 |
| Module-wise count rates for Quadrant D Data is divided into 100 sec bins |
 |
 |
| Parameter | Plot |
|---|---|
| CZT HV Monitor | 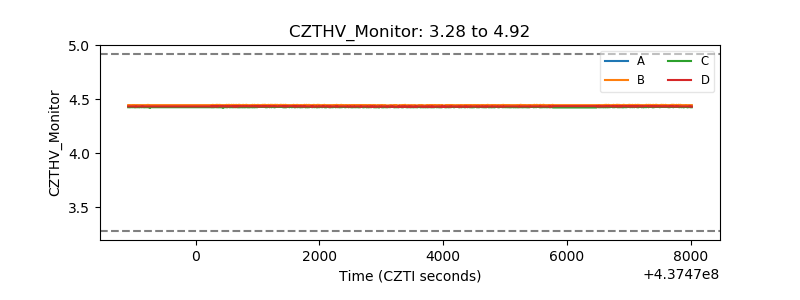 |
| D_VDD | 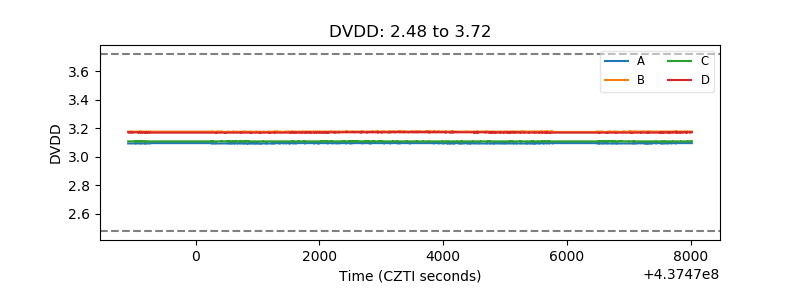 |
| Temperature 1 | 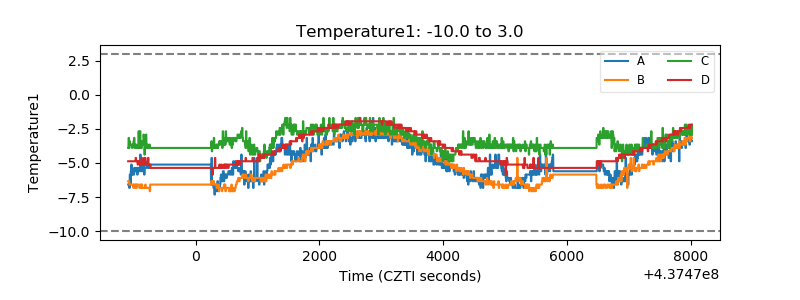 |
| Veto HV Monitor | 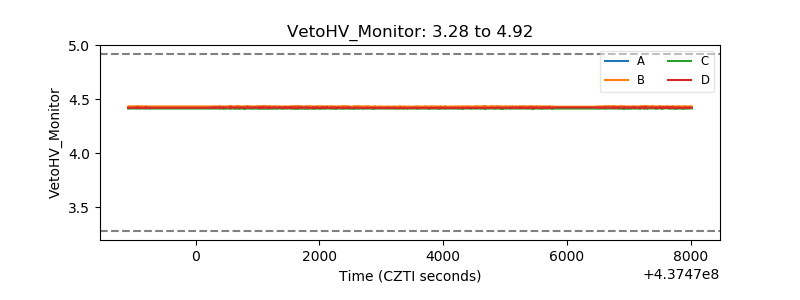 |
| Veto LLD | 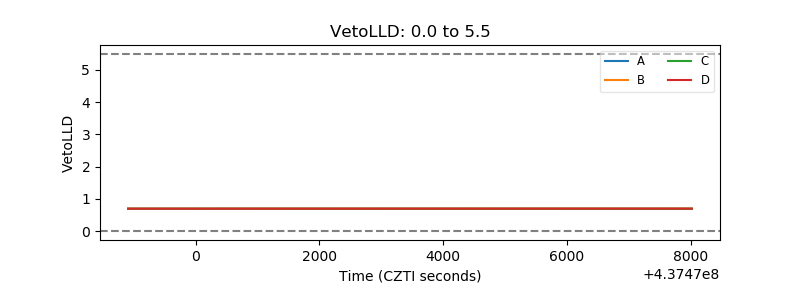 |
| Alpha Counter | 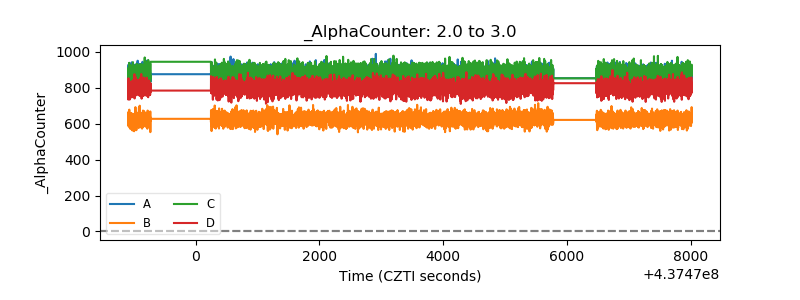 |
| _CPM_Rate | 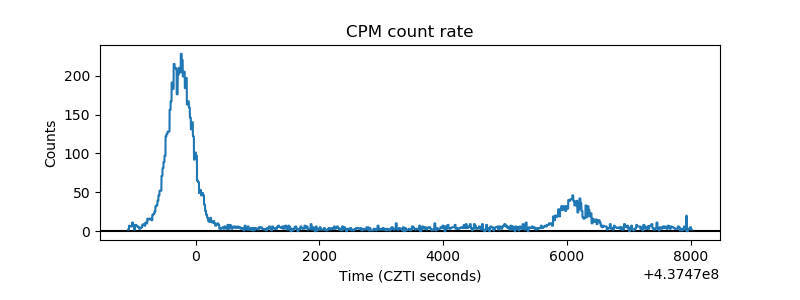 |
| CZT Counter | 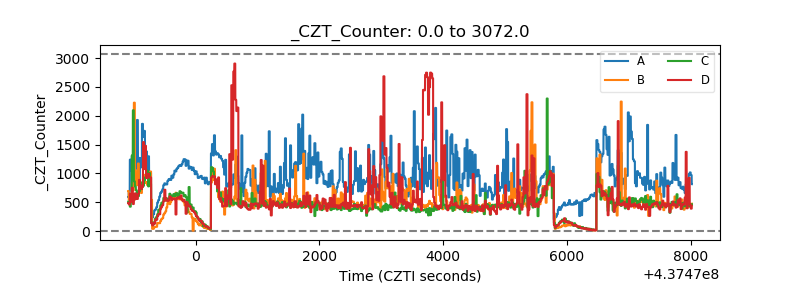 |
| +2.5 Volts monitor | 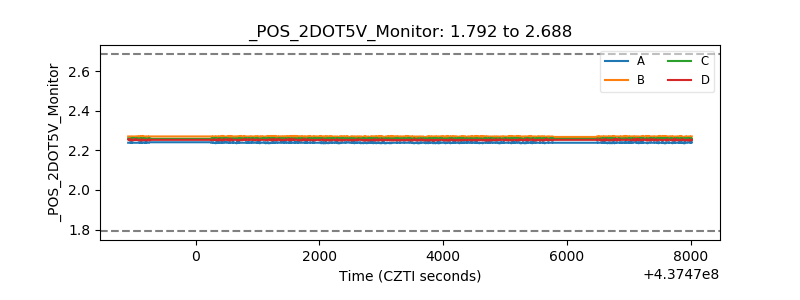 |
| +5 Volts monitor |  |
| _ROLL_ROT | 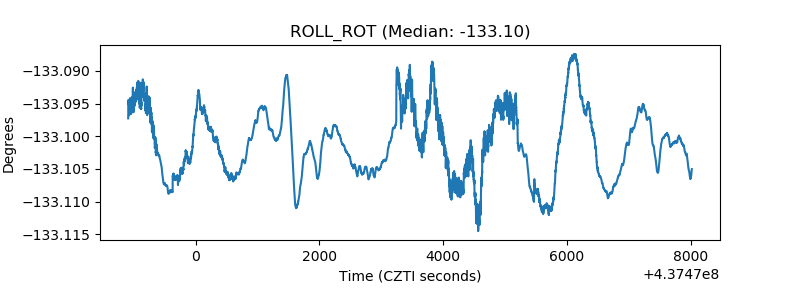 |
| _Roll_DEC | 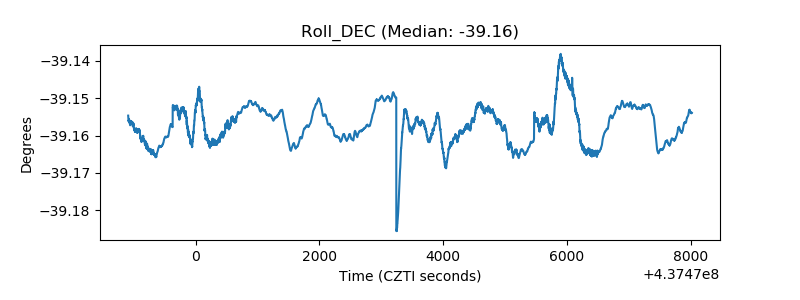 |
| _Roll_RA | 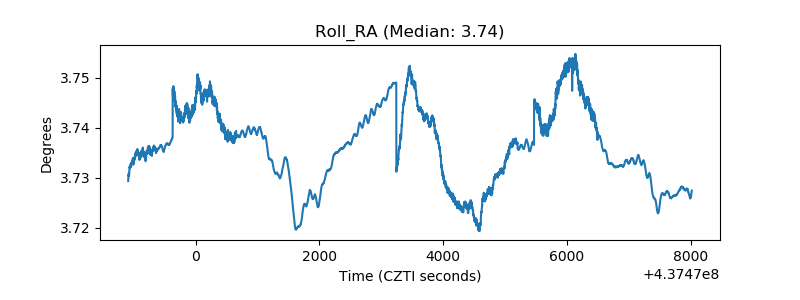 |
| Veto Counter | 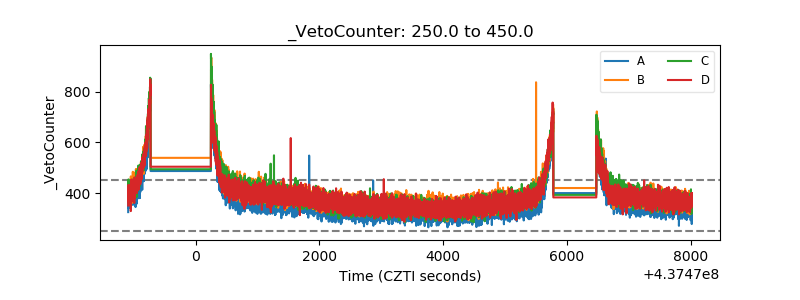 |