| Param | Original file | Final file |
|---|---|---|
| Filename | modeM0/AS1A13_023T01_9000005916_43928cztM0_level2.fits | modeM0/AS1A13_023T01_9000005916_43928cztM0_level2_quad_clean.evt |
| Size (bytes) | 262,615,680 | 56,528,640 |
| Size | 250.4 MB | 53.9 MB |
| Events in quadrant A | 3,303,191 | 371,051 |
| Events in quadrant B | 1,790,311 | 385,737 |
| Events in quadrant C | 1,712,953 | 374,261 |
| Events in quadrant D | 2,636,624 | 328,836 |
| Mode SS | |||
|---|---|---|---|
| Quadrant | BADHDUFLAG | Total packets | Discarded packets |
| A | 0 | 70 | 0 |
| B | 0 | 70 | 0 |
| C | 0 | 70 | 0 |
| D | 0 | 70 | 0 |
| Mode M0 | |||
|---|---|---|---|
| Quadrant | BADHDUFLAG | Total packets | Discarded packets |
| A | 0 | 12503 | 0 |
| B | 0 | 7721 | 0 |
| C | 0 | 7708 | 0 |
| D | 0 | 10243 | 0 |
| Quadrant | Total seconds | Saturated seconds | Saturation percentage |
|---|---|---|---|
| A | 3562 | 64 | 1.796743% |
| B | 3562 | 25 | 0.701853% |
| C | 3562 | 25 | 0.701853% |
| D | 3562 | 194 | 5.446378% |
Noise dominated data is calculated using 1-second bins in cleaned event files. If a bin has >2000 counts, and if more than 50% of those come from <1% of pixels, then it is considered to be noise-dominated and hence unusable.
| Quadrant | # 1 sec bins | Bins with >0 counts | Bins with >2000 counts | High rate bins dominated by noise | Noise dominated (total time) | Noise dominated (detector-on time) | Marked lightcurve |
|---|---|---|---|---|---|---|---|
| A | 3562 | 3562 | 36 | 36 | 1.01% | 1.01% | 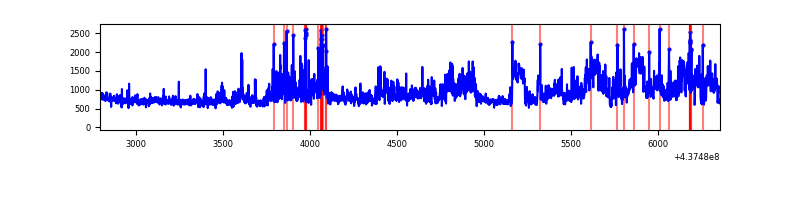 |
| B | 3562 | 3562 | 14 | 14 | 0.39% | 0.39% | 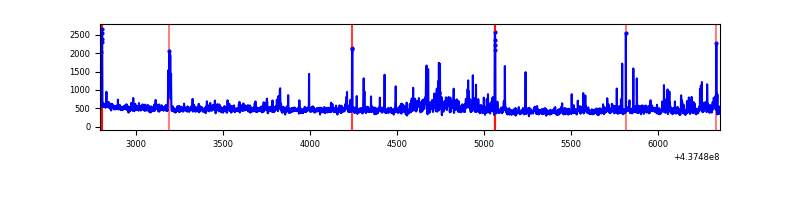 |
| C | 3562 | 3562 | 31 | 31 | 0.87% | 0.87% | 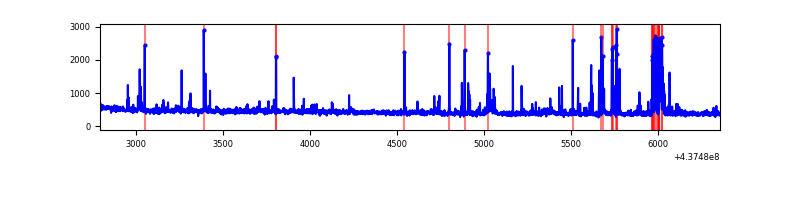 |
| D | 3562 | 3562 | 189 | 189 | 5.31% | 5.31% | 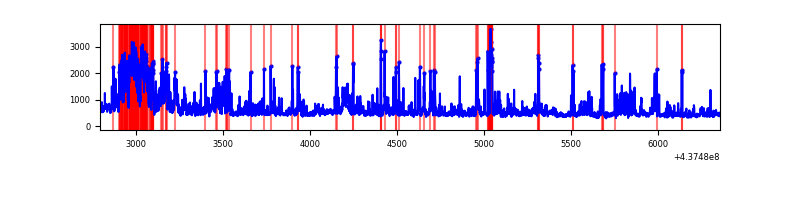 |
Top three noisy pixels from each quadrant. If the there are fewer than three noisy pixels in the level2.evt file, extra rows are filled as -1
| Pixel properties | Quadrant properties | ||||||
|---|---|---|---|---|---|---|---|
| Quadrant | DetID | PixID | Counts | Sigma | Mean | Median | Sigma |
| A | 15 | 222 | 1163436 | 14432.0 | 383 | 375 | 80.6 |
| A | 10 | 83 | 521374 | 6464.89 | 383 | 375 | 80.6 |
| A | 7 | 191 | 74581 | 920.8 | 383 | 375 | 80.6 |
| B | 0 | 200 | 59994 | 770.63 | 381 | 369 | 77.4 |
| B | 0 | 213 | 58700 | 753.9 | 381 | 369 | 77.4 |
| B | 5 | 172 | 49445 | 634.29 | 381 | 369 | 77.4 |
| C | 15 | 158 | 100016 | 1117.48 | 373 | 373 | 89.2 |
| C | 14 | 254 | 53646 | 597.45 | 373 | 373 | 89.2 |
| C | 15 | 157 | 31197 | 345.69 | 373 | 373 | 89.2 |
| D | 1 | 52 | 548426 | 5877.99 | 366 | 355 | 93.2 |
| D | 6 | 239 | 200492 | 2146.44 | 366 | 355 | 93.2 |
| D | 2 | 249 | 87239 | 931.82 | 366 | 355 | 93.2 |
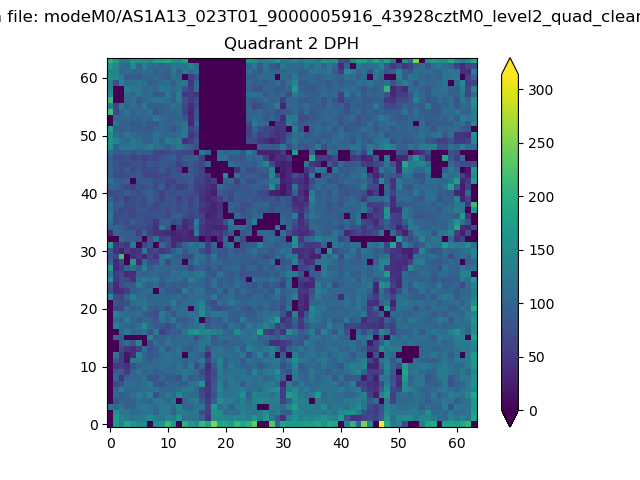
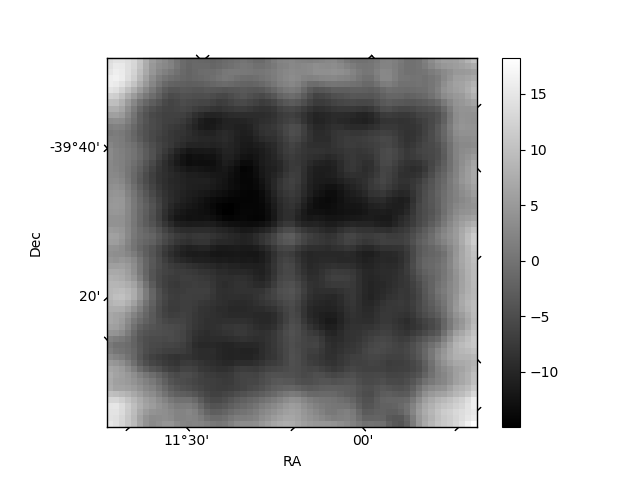
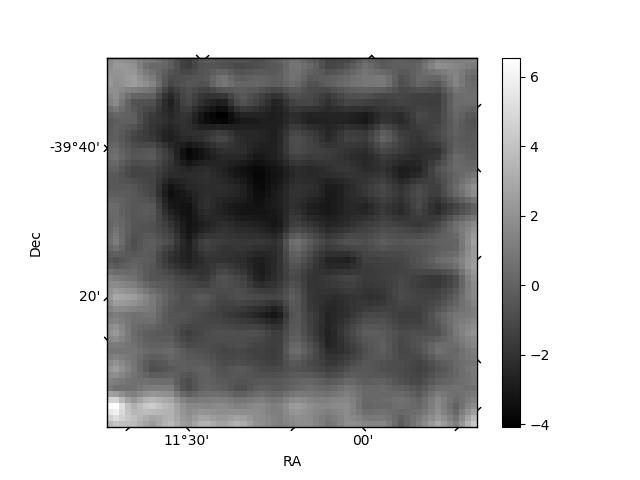
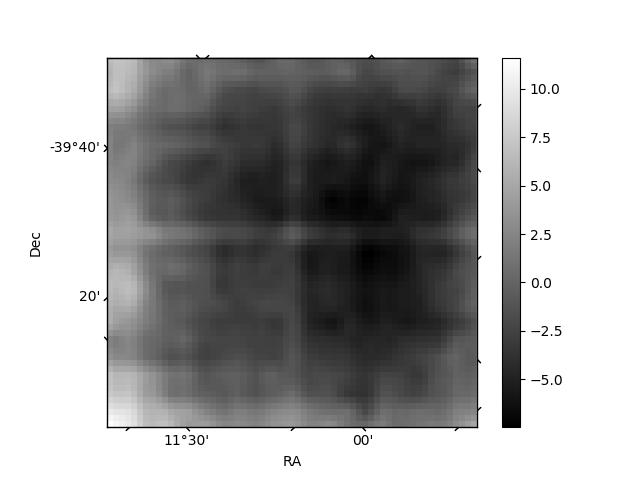
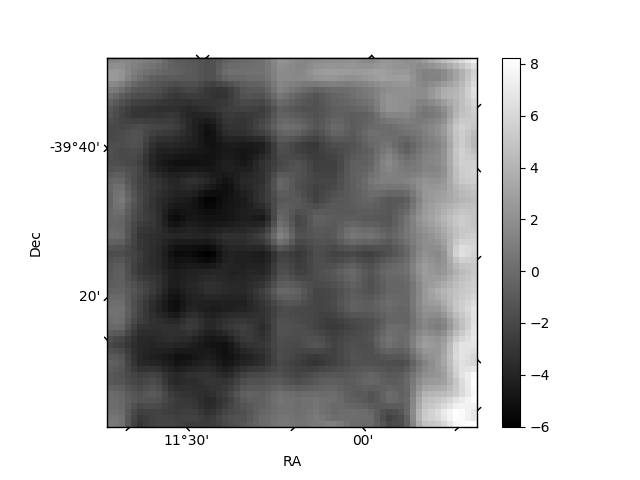
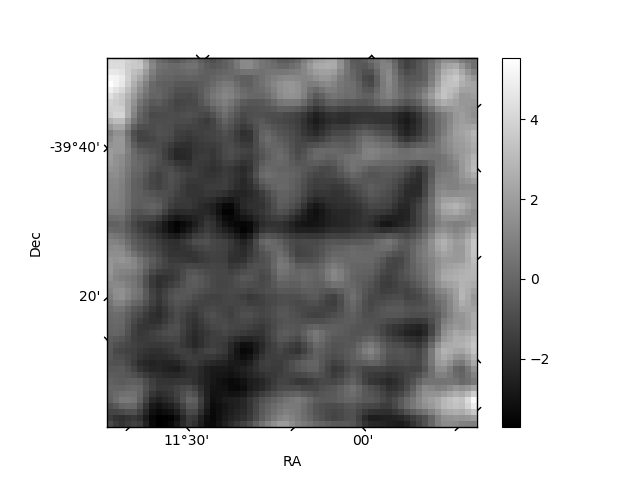
Histogram calculated using DETX and DETY for each event in the final _common_clean file
| Quadrant A | 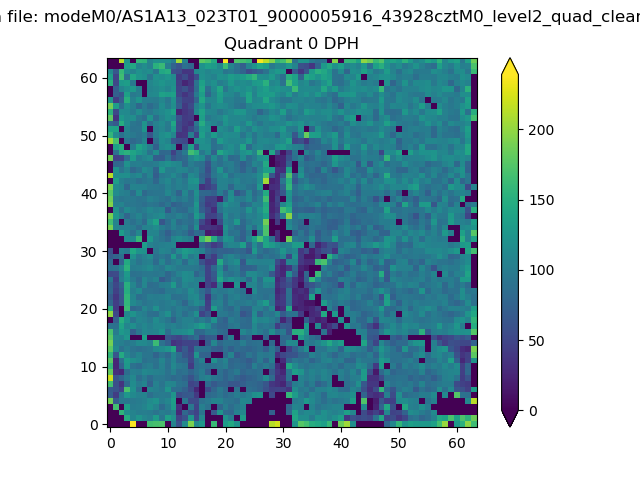 |
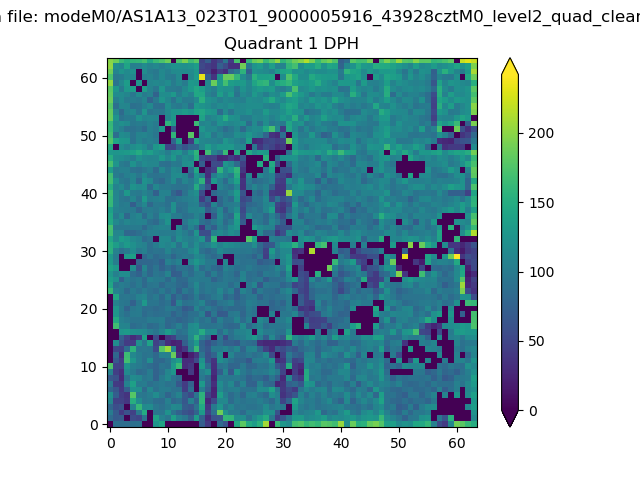 |
Quadrant B |
|---|---|---|---|
| Quadrant D | 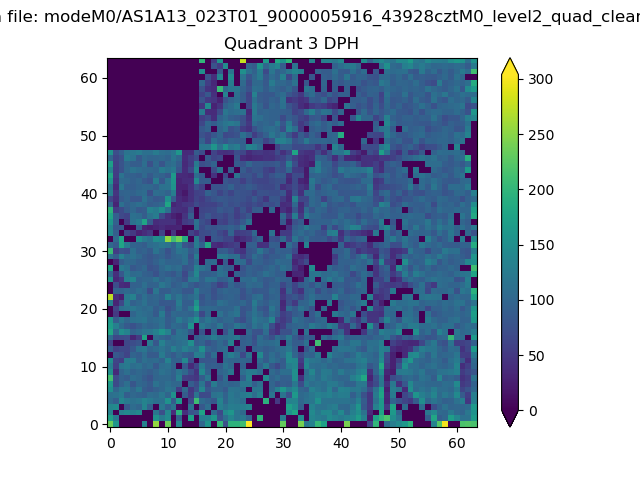 |
 |
Quadrant C |
| Plot type | Count rate plots | Images |
|---|---|---|
| Comparison with Poisson distribution Blue bars denote a histogram of data divided into 1 sec bins. Red curve is a Poisson curve with rate = median count rate of data. |
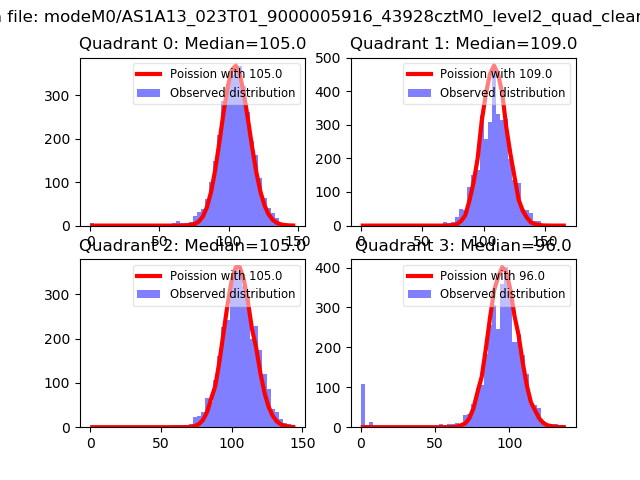 |
 |
| Quadrant-wise count rates Data is divided into 100 sec bins |
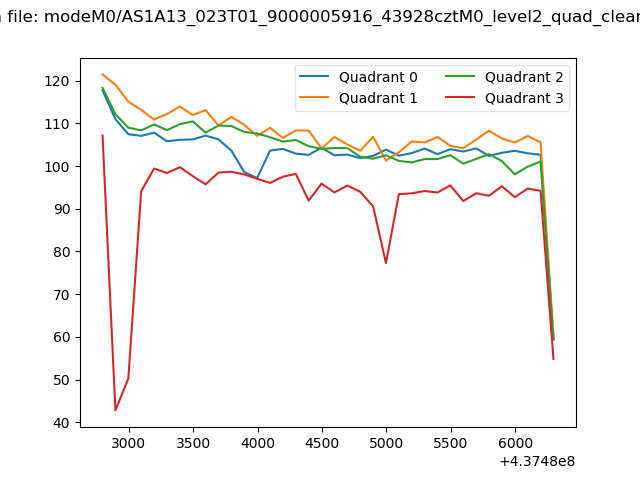 |
|
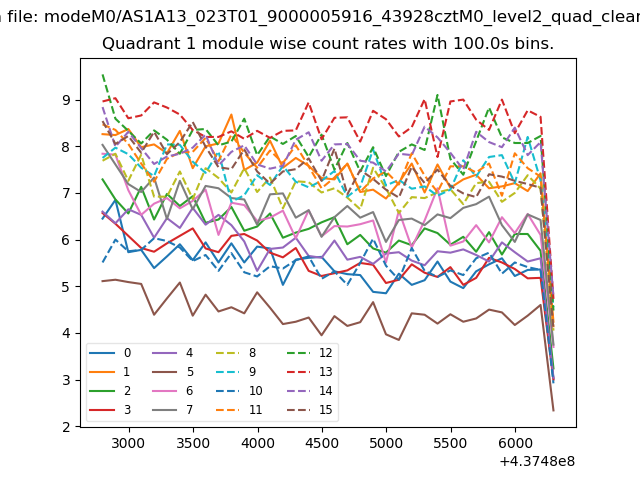
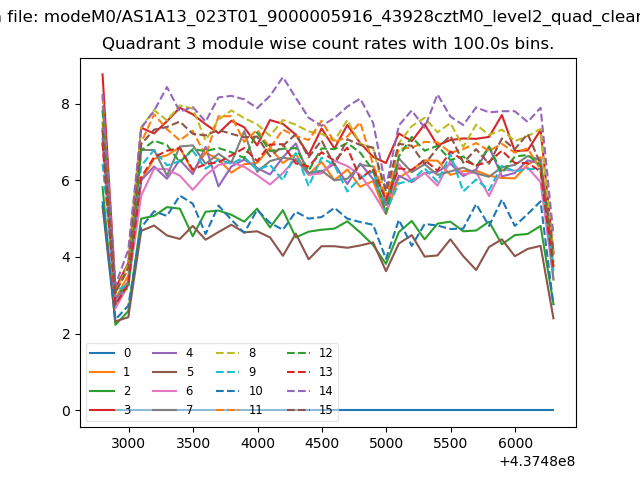
| Module-wise count rates for Quadrant A Data is divided into 100 sec bins |
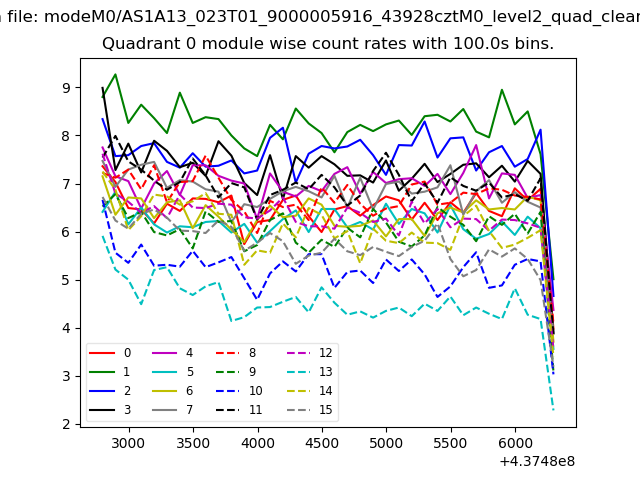 |
 |
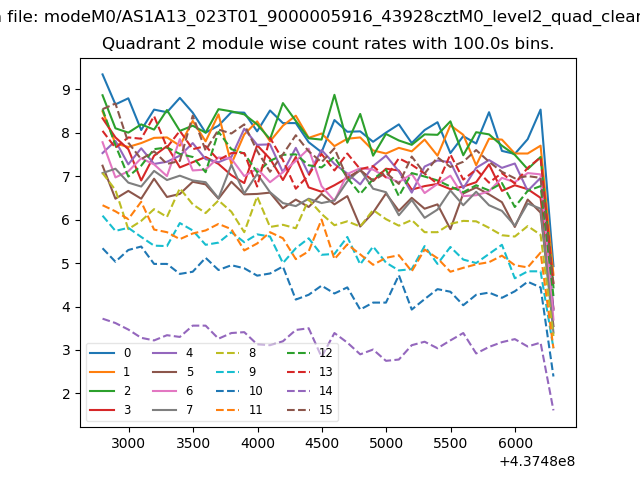
| Module-wise count rates for Quadrant B Data is divided into 100 sec bins |
 |
 |
| Module-wise count rates for Quadrant C Data is divided into 100 sec bins |
 |
 |
| Module-wise count rates for Quadrant D Data is divided into 100 sec bins |
 |
 |
| Parameter | Plot |
|---|---|
| CZT HV Monitor | 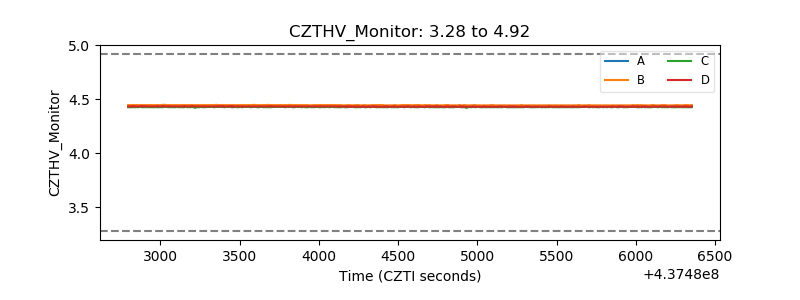 |
| D_VDD | 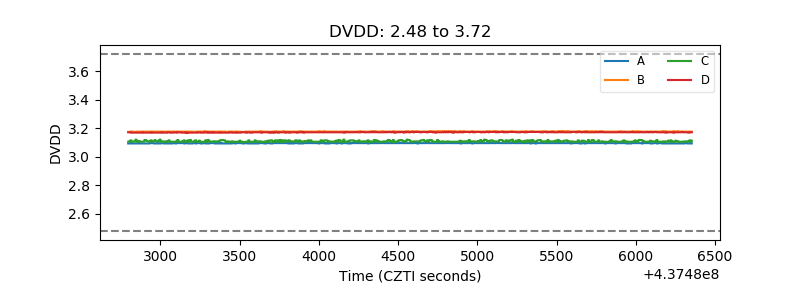 |
| Temperature 1 | 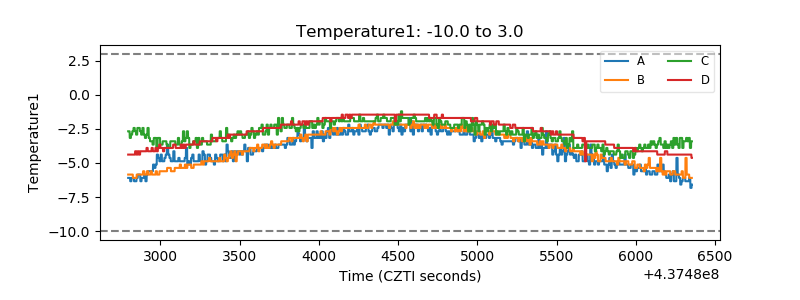 |
| Veto HV Monitor |  |
| Veto LLD | 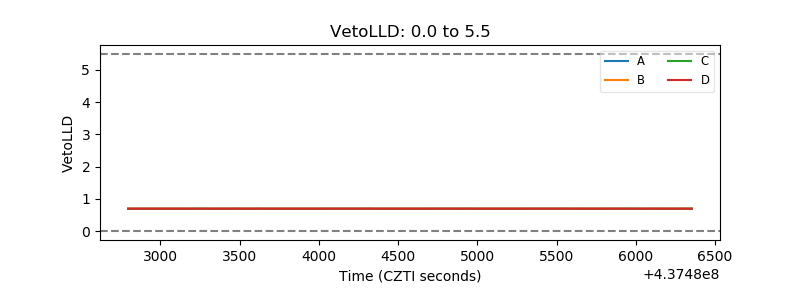 |
| Alpha Counter | 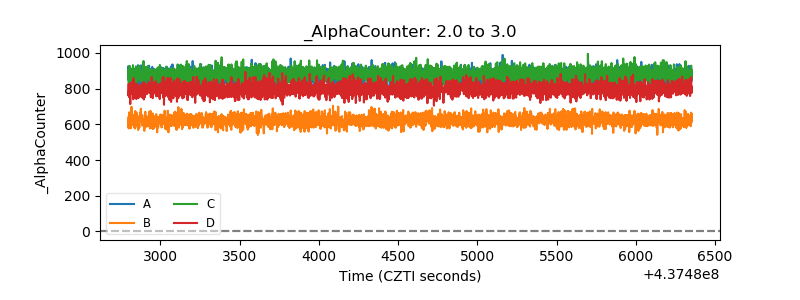 |
| _CPM_Rate | 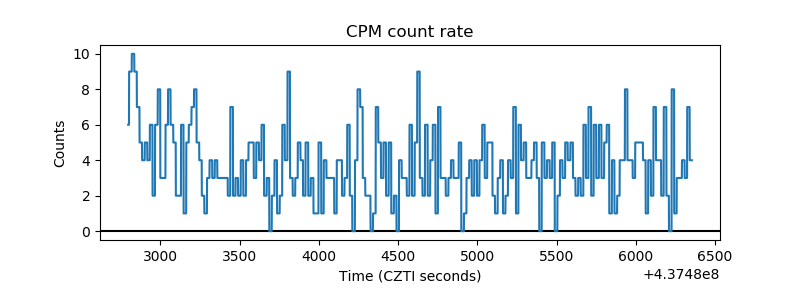 |
| CZT Counter | 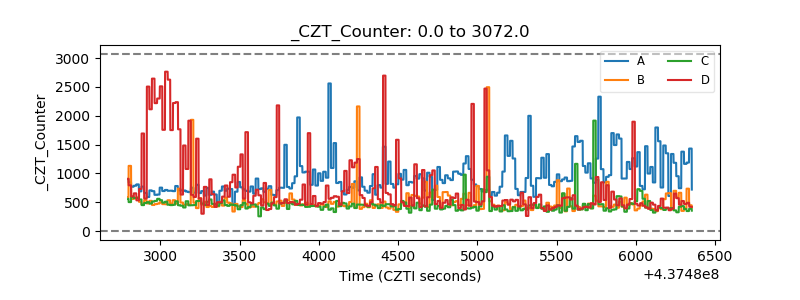 |
| +2.5 Volts monitor | 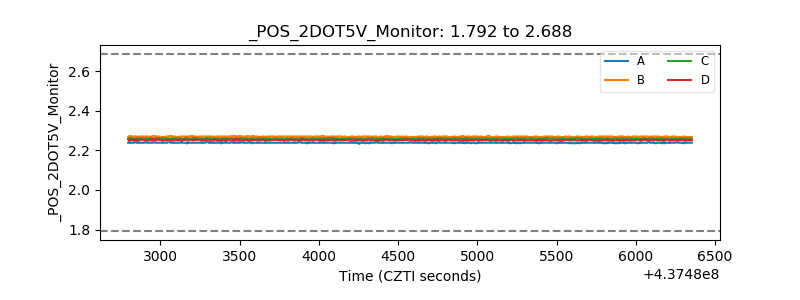 |
| +5 Volts monitor | 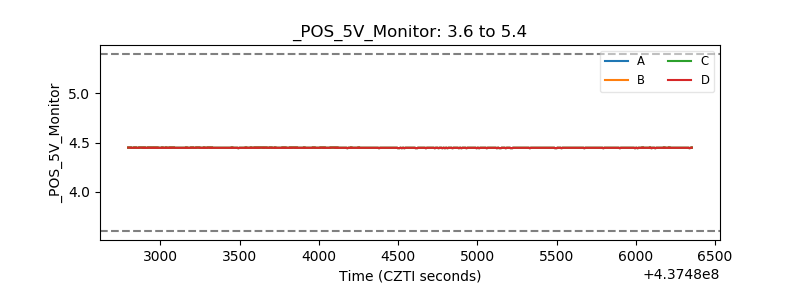 |
| _ROLL_ROT | 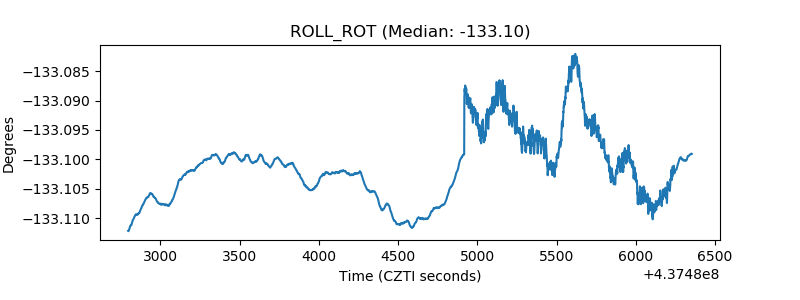 |
| _Roll_DEC | 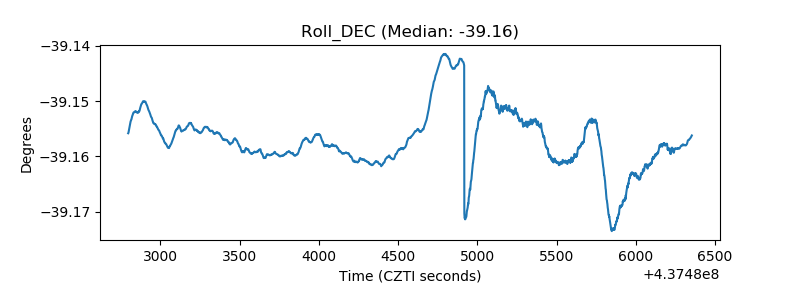 |
| _Roll_RA | 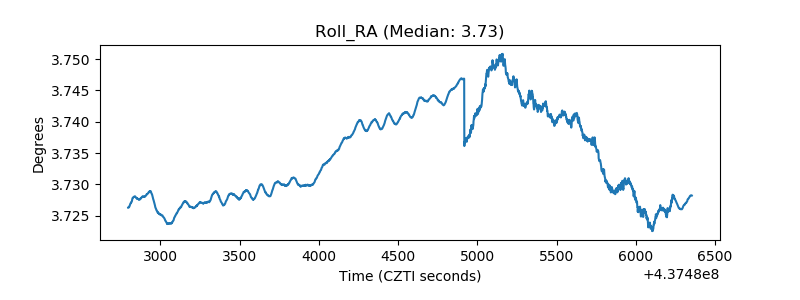 |
| Veto Counter | 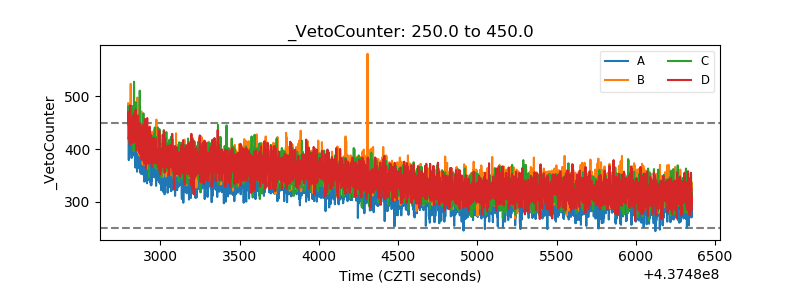 |