| Param | Original file | Final file |
|---|---|---|
| Filename | modeM0/AS1A13_024T02_9000005918_43929cztM0_level2.fits | modeM0/AS1A13_024T02_9000005918_43929cztM0_level2_quad_clean.evt |
| Size (bytes) | 584,821,440 | 110,041,920 |
| Size | 557.7 MB | 104.9 MB |
| Events in quadrant A | 5,220,803 | 760,437 |
| Events in quadrant B | 4,193,383 | 774,985 |
| Events in quadrant C | 4,735,020 | 727,014 |
| Events in quadrant D | 6,948,231 | 574,586 |
| Mode M0 | |||
|---|---|---|---|
| Quadrant | BADHDUFLAG | Total packets | Discarded packets |
| A | 0 | 21063 | 0 |
| B | 0 | 17352 | 0 |
| C | 0 | 19075 | 0 |
| D | 0 | 25549 | 0 |
| Mode SS | |||
|---|---|---|---|
| Quadrant | BADHDUFLAG | Total packets | Discarded packets |
| A | 0 | 142 | 0 |
| B | 0 | 142 | 0 |
| C | 0 | 142 | 0 |
| D | 0 | 142 | 0 |
| Quadrant | Total seconds | Saturated seconds | Saturation percentage |
|---|---|---|---|
| A | 7102 | 142 | 1.999437% |
| B | 7103 | 143 | 2.013234% |
| C | 7103 | 301 | 4.237646% |
| D | 7103 | 1199 | 16.880191% |
Noise dominated data is calculated using 1-second bins in cleaned event files. If a bin has >2000 counts, and if more than 50% of those come from <1% of pixels, then it is considered to be noise-dominated and hence unusable.
| Quadrant | # 1 sec bins | Bins with >0 counts | Bins with >2000 counts | High rate bins dominated by noise | Noise dominated (total time) | Noise dominated (detector-on time) | Marked lightcurve |
|---|---|---|---|---|---|---|---|
| A | 7102 | 7102 | 44 | 44 | 0.62% | 0.62% | 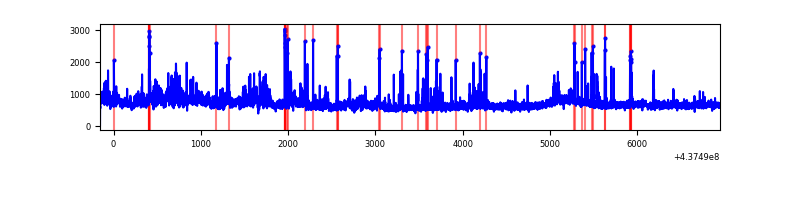 |
| B | 7103 | 7103 | 55 | 55 | 0.77% | 0.77% | 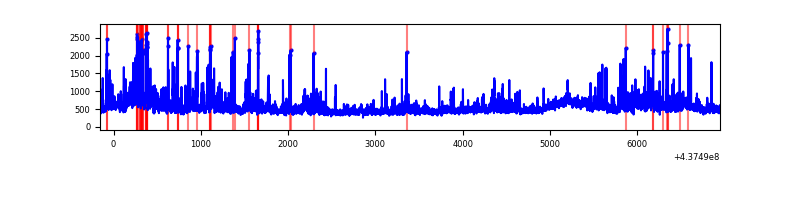 |
| C | 7103 | 7103 | 242 | 242 | 3.41% | 3.41% | 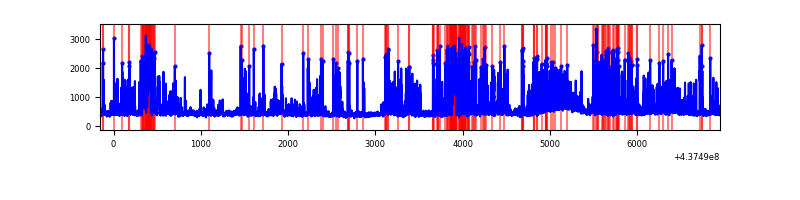 |
| D | 7103 | 7103 | 996 | 996 | 14.02% | 14.02% | 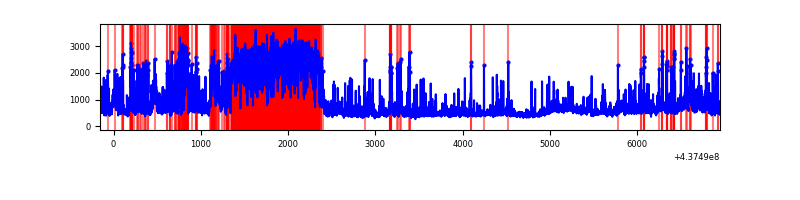 |
Top three noisy pixels from each quadrant. If the there are fewer than three noisy pixels in the level2.evt file, extra rows are filled as -1
| Pixel properties | Quadrant properties | ||||||
|---|---|---|---|---|---|---|---|
| Quadrant | DetID | PixID | Counts | Sigma | Mean | Median | Sigma |
| A | 10 | 83 | 1066704 | 6551.33 | 784 | 766 | 162.7 |
| A | 15 | 222 | 867396 | 5326.37 | 784 | 766 | 162.7 |
| A | 15 | 223 | 61150 | 371.12 | 784 | 766 | 162.7 |
| B | 0 | 213 | 315653 | 2076.48 | 778 | 755 | 151.6 |
| B | 0 | 200 | 171904 | 1128.58 | 778 | 755 | 151.6 |
| B | 15 | 36 | 132224 | 866.92 | 778 | 755 | 151.6 |
| C | 15 | 158 | 1376349 | 7689.86 | 756 | 761 | 178.9 |
| C | 14 | 254 | 150804 | 838.78 | 756 | 761 | 178.9 |
| C | 3 | 233 | 116125 | 644.91 | 756 | 761 | 178.9 |
| D | 12 | 17 | 2107889 | 11585.16 | 703 | 679 | 181.9 |
| D | 1 | 52 | 577099 | 3169.08 | 703 | 679 | 181.9 |
| D | 5 | 235 | 386672 | 2122.14 | 703 | 679 | 181.9 |
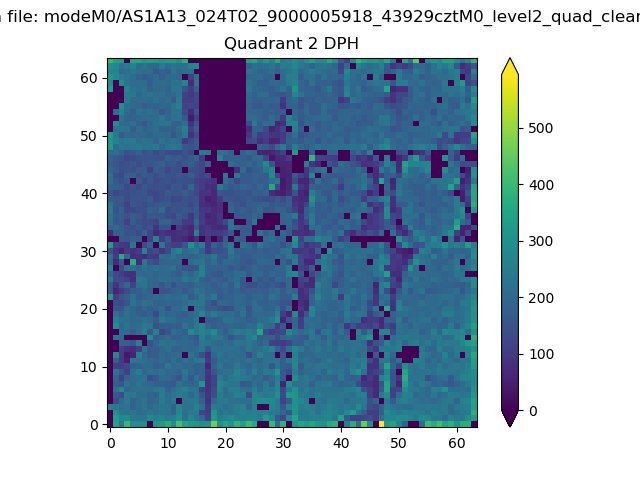
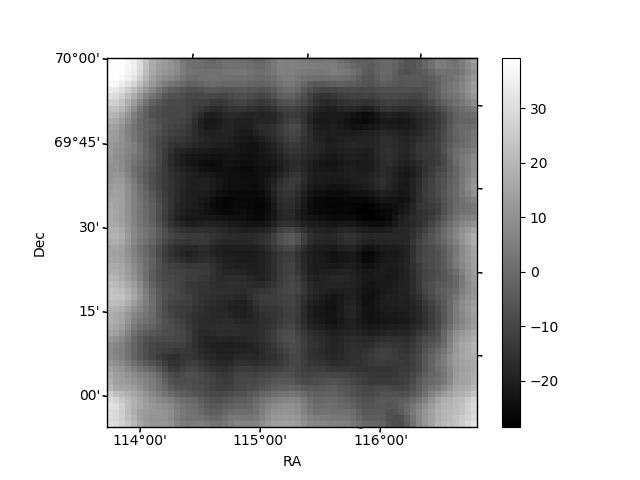
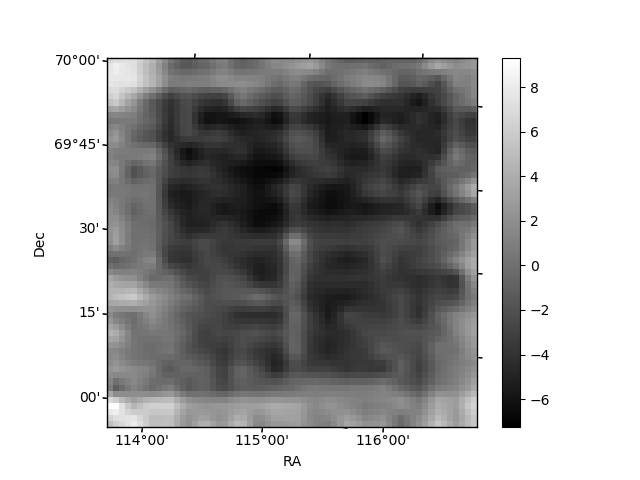
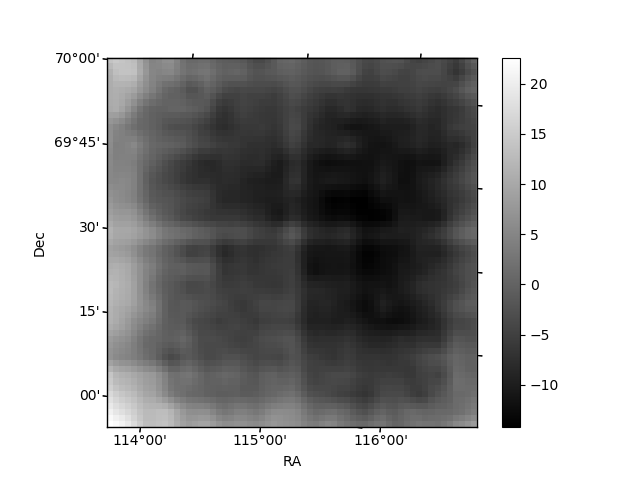
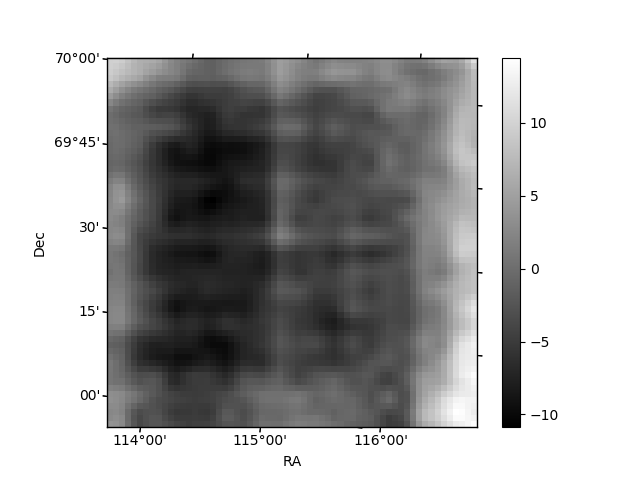
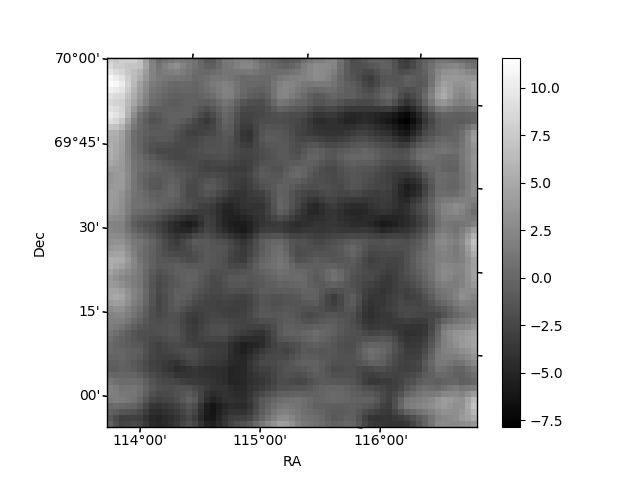
Histogram calculated using DETX and DETY for each event in the final _common_clean file
| Quadrant A | 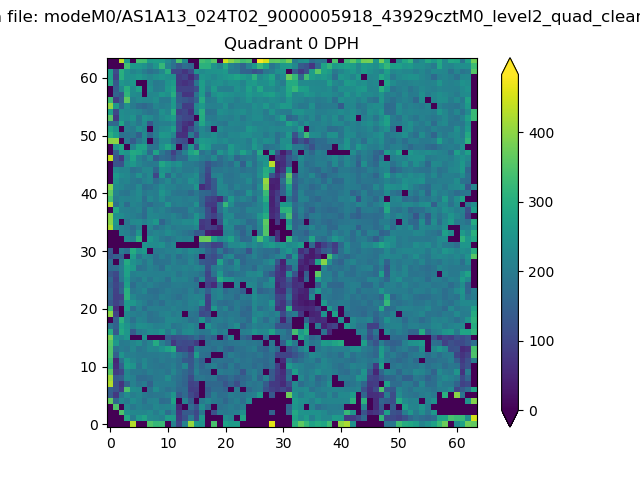 |
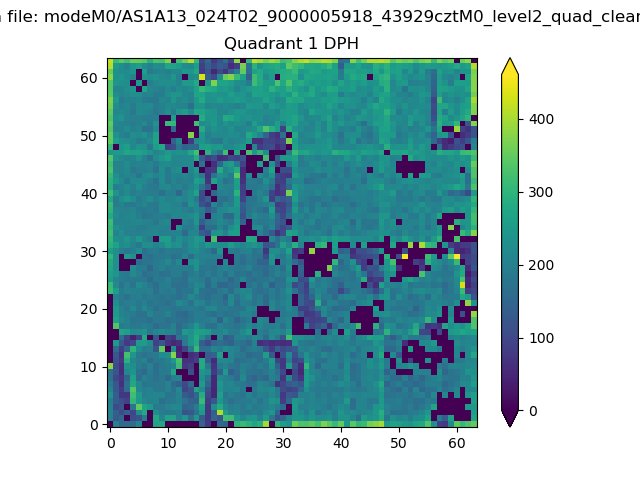 |
Quadrant B |
|---|---|---|---|
| Quadrant D | 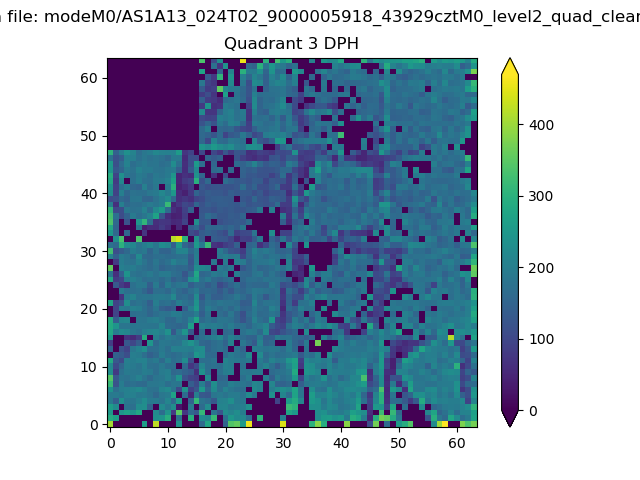 |
 |
Quadrant C |
| Plot type | Count rate plots | Images |
|---|---|---|
| Comparison with Poisson distribution Blue bars denote a histogram of data divided into 1 sec bins. Red curve is a Poisson curve with rate = median count rate of data. |
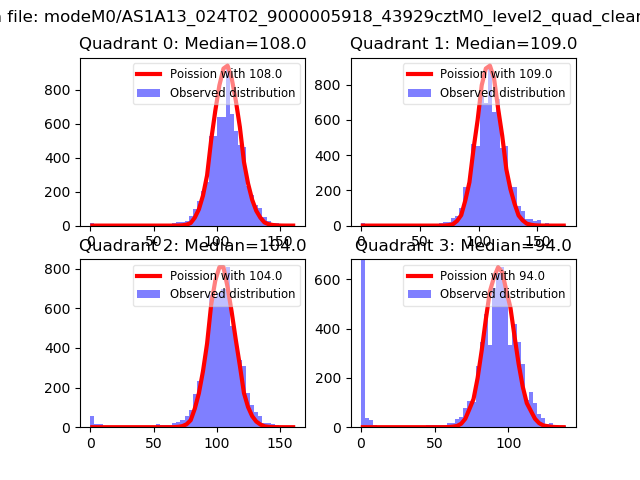 |
 |
| Quadrant-wise count rates Data is divided into 100 sec bins |
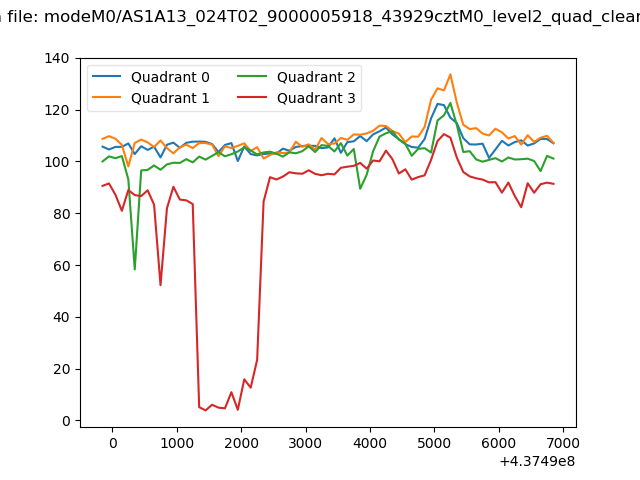 |
|
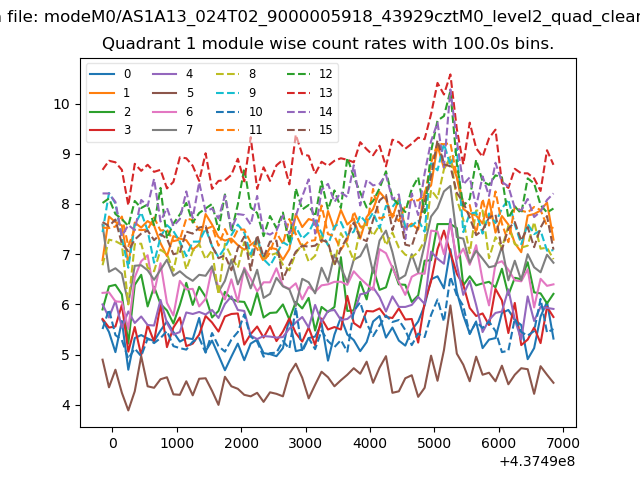
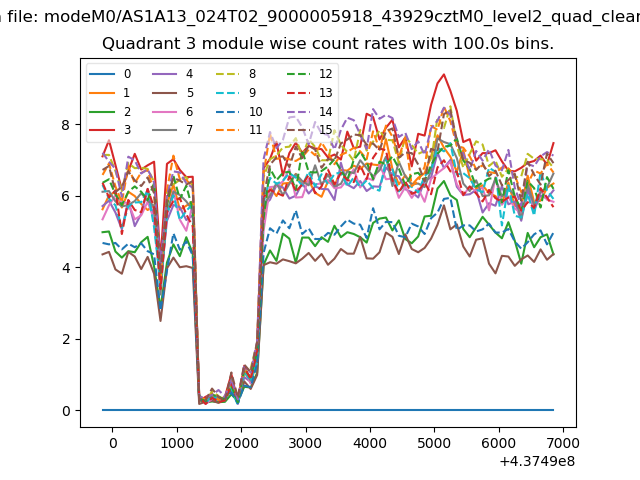
| Module-wise count rates for Quadrant A Data is divided into 100 sec bins |
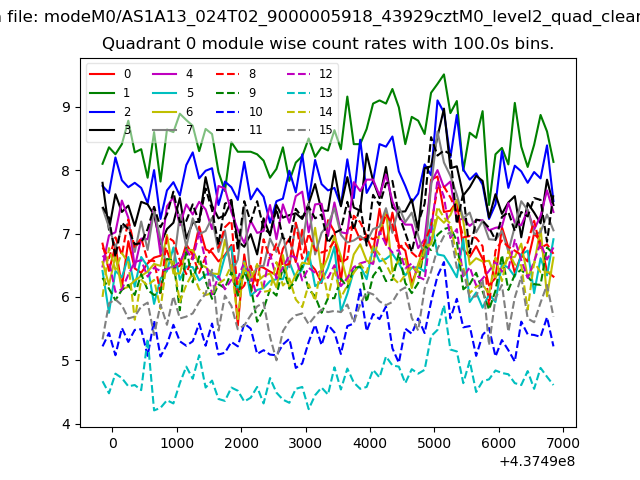 |
 |
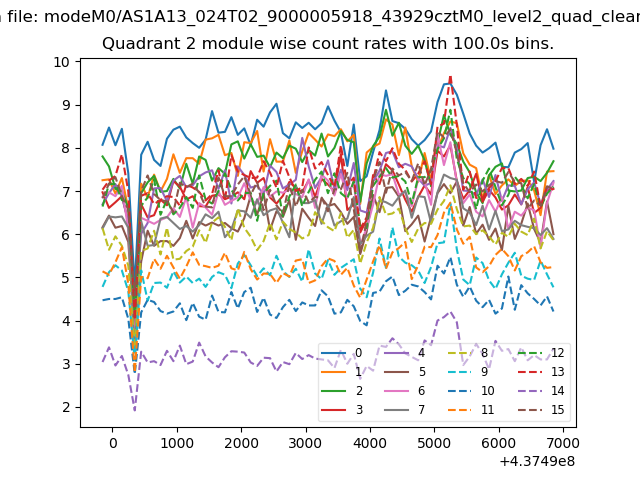
| Module-wise count rates for Quadrant B Data is divided into 100 sec bins |
 |
 |
| Module-wise count rates for Quadrant C Data is divided into 100 sec bins |
 |
 |
| Module-wise count rates for Quadrant D Data is divided into 100 sec bins |
 |
 |
| Parameter | Plot |
|---|---|
| CZT HV Monitor | 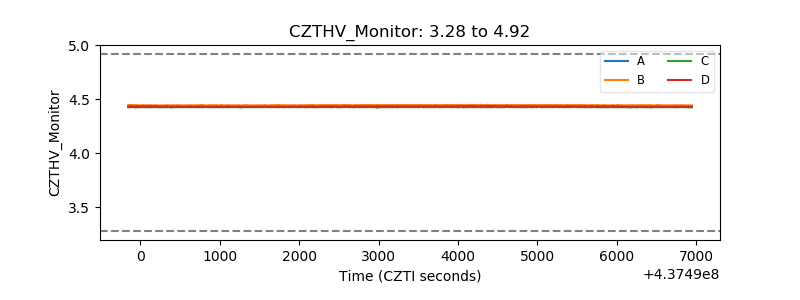 |
| D_VDD | 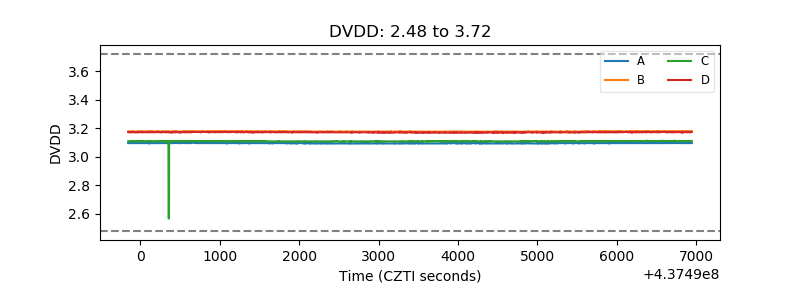 |
| Temperature 1 | 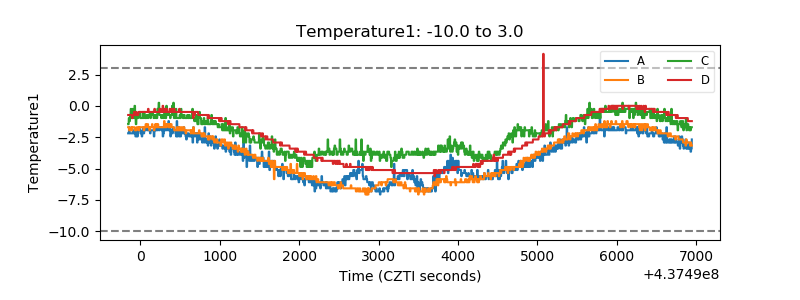 |
| Veto HV Monitor | 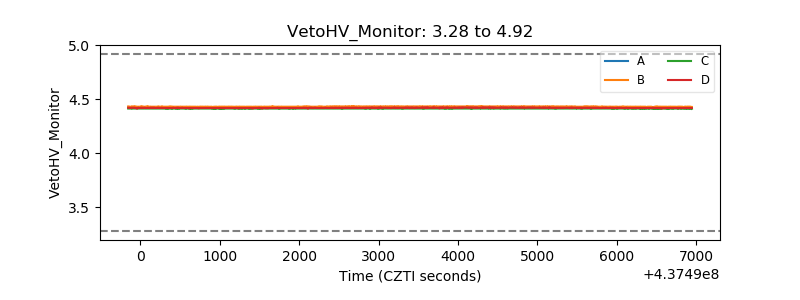 |
| Veto LLD | 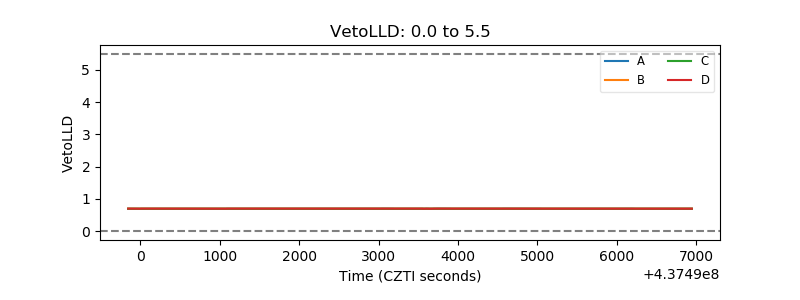 |
| Alpha Counter | 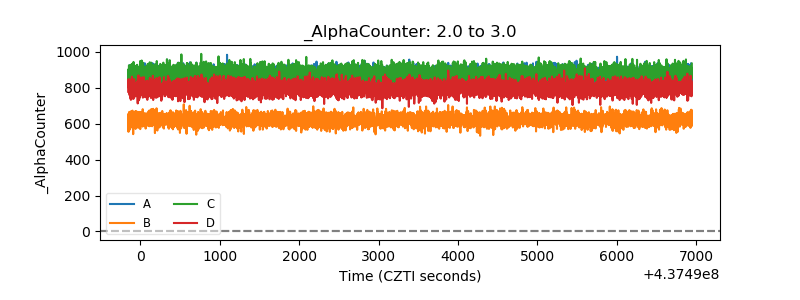 |
| _CPM_Rate | 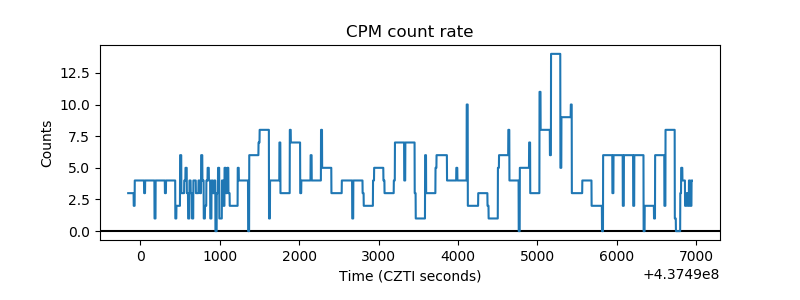 |
| CZT Counter | 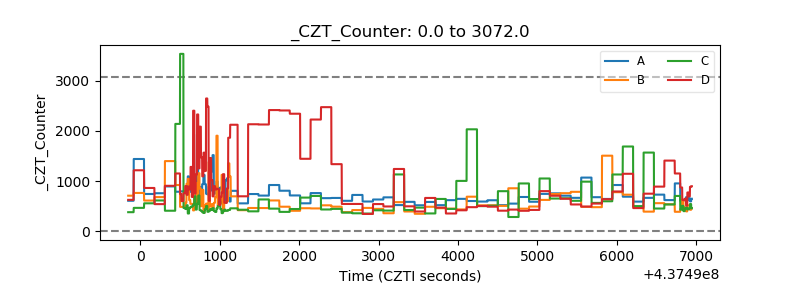 |
| +2.5 Volts monitor | 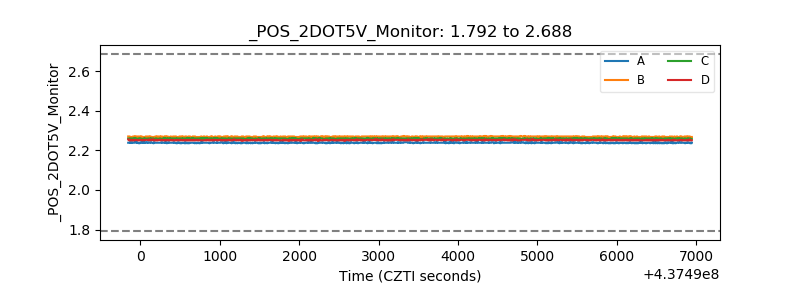 |
| +5 Volts monitor | 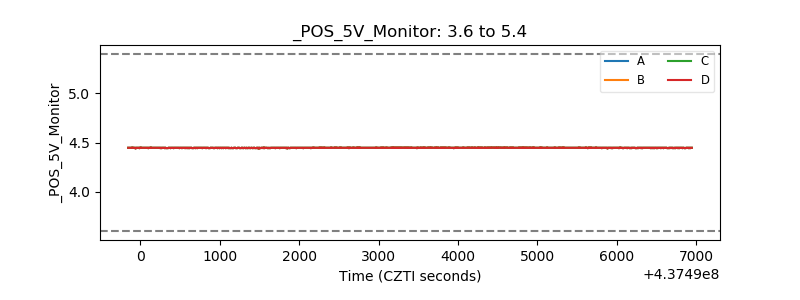 |
| _ROLL_ROT | 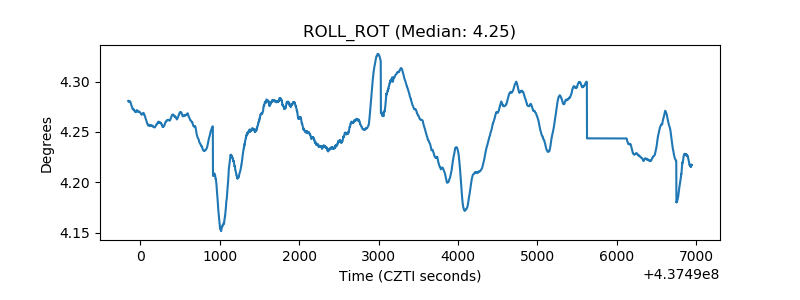 |
| _Roll_DEC | 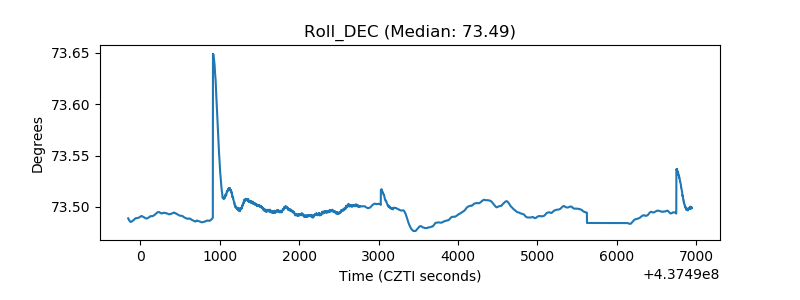 |
| _Roll_RA | 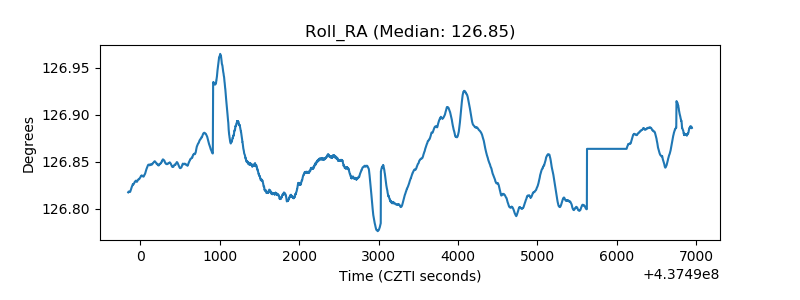 |
| Veto Counter | 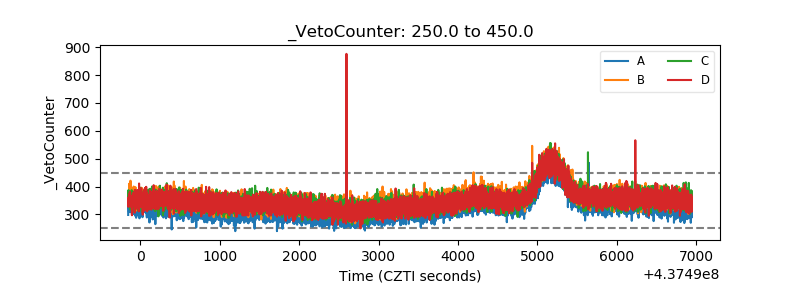 |