| Param | Original file | Final file |
|---|---|---|
| Filename | modeM0/AS1A13_024T02_9000005918_43932cztM0_level2.fits | modeM0/AS1A13_024T02_9000005918_43932cztM0_level2_quad_clean.evt |
| Size (bytes) | 1,291,032,000 | 280,791,360 |
| Size | 1.2 GB | 267.8 MB |
| Events in quadrant A | 12,316,899 | 1,887,715 |
| Events in quadrant B | 10,629,483 | 1,896,719 |
| Events in quadrant C | 9,913,349 | 1,845,495 |
| Events in quadrant D | 13,539,157 | 1,630,876 |
| Mode M0 | |||
|---|---|---|---|
| Quadrant | BADHDUFLAG | Total packets | Discarded packets |
| A | 0 | 49685 | 4 |
| B | 0 | 43786 | 3 |
| C | 0 | 42353 | 3 |
| D | 0 | 52881 | 3 |
| Mode SS | |||
|---|---|---|---|
| Quadrant | BADHDUFLAG | Total packets | Discarded packets |
| A | 0 | 364 | 0 |
| B | 0 | 364 | 0 |
| C | 0 | 364 | 0 |
| D | 0 | 364 | 0 |
| Mode M9 | |||
|---|---|---|---|
| Quadrant | BADHDUFLAG | Total packets | Discarded packets |
| A | 0 | 18 | 0 |
| B | 0 | 18 | 0 |
| C | 0 | 18 | 0 |
| D | 0 | 18 | 0 |
| Quadrant | Total seconds | Saturated seconds | Saturation percentage |
|---|---|---|---|
| A | 17996 | 227 | 1.261391% |
| B | 17997 | 392 | 2.178141% |
| C | 17997 | 389 | 2.161471% |
| D | 17997 | 1109 | 6.162138% |
Noise dominated data is calculated using 1-second bins in cleaned event files. If a bin has >2000 counts, and if more than 50% of those come from <1% of pixels, then it is considered to be noise-dominated and hence unusable.
| Quadrant | # 1 sec bins | Bins with >0 counts | Bins with >2000 counts | High rate bins dominated by noise | Noise dominated (total time) | Noise dominated (detector-on time) | Marked lightcurve |
|---|---|---|---|---|---|---|---|
| A | 19701 | 17999 | 63 | 63 | 0.32% | 0.35% | 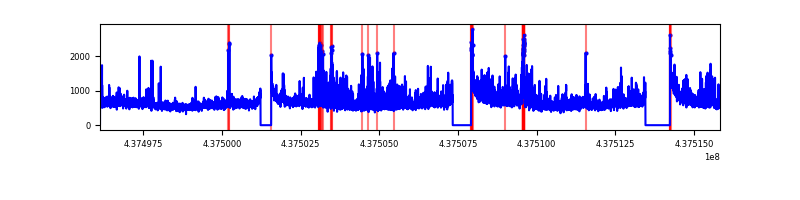 |
| B | 19702 | 18000 | 213 | 213 | 1.08% | 1.18% | 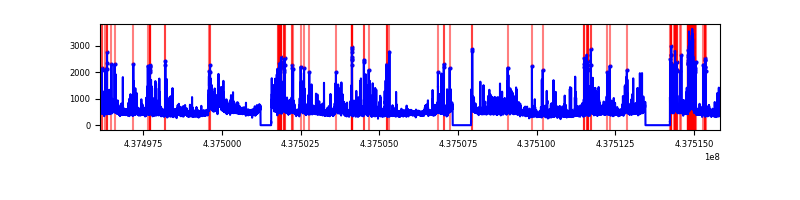 |
| C | 19702 | 18000 | 323 | 323 | 1.64% | 1.79% | 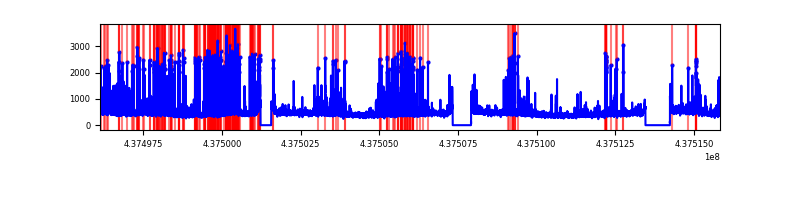 |
| D | 19702 | 18000 | 862 | 862 | 4.38% | 4.79% | 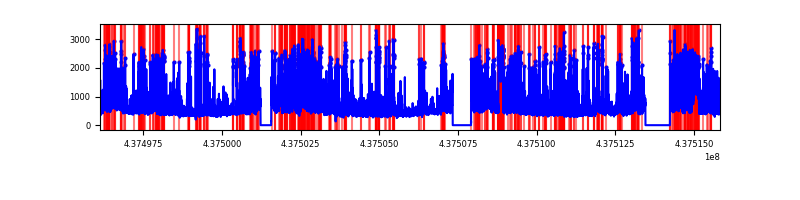 |
Top three noisy pixels from each quadrant. If the there are fewer than three noisy pixels in the level2.evt file, extra rows are filled as -1
| Pixel properties | Quadrant properties | ||||||
|---|---|---|---|---|---|---|---|
| Quadrant | DetID | PixID | Counts | Sigma | Mean | Median | Sigma |
| A | 10 | 83 | 2938905 | 7338.7 | 1951 | 1913 | 400.2 |
| A | 15 | 222 | 1130468 | 2819.94 | 1951 | 1913 | 400.2 |
| A | 15 | 223 | 372385 | 925.7 | 1951 | 1913 | 400.2 |
| B | 5 | 235 | 1018747 | 2730.77 | 1927 | 1868 | 372.4 |
| B | 0 | 213 | 509609 | 1363.51 | 1927 | 1868 | 372.4 |
| B | 12 | 18 | 479950 | 1283.86 | 1927 | 1868 | 372.4 |
| C | 15 | 158 | 1089094 | 2423.87 | 1908 | 1918 | 448.5 |
| C | 14 | 254 | 796210 | 1770.88 | 1908 | 1918 | 448.5 |
| C | 1 | 241 | 307602 | 681.53 | 1908 | 1918 | 448.5 |
| D | 1 | 52 | 1553662 | 3289.37 | 1882 | 1825 | 471.8 |
| D | 5 | 235 | 1209855 | 2560.62 | 1882 | 1825 | 471.8 |
| D | 12 | 17 | 449886 | 949.74 | 1882 | 1825 | 471.8 |
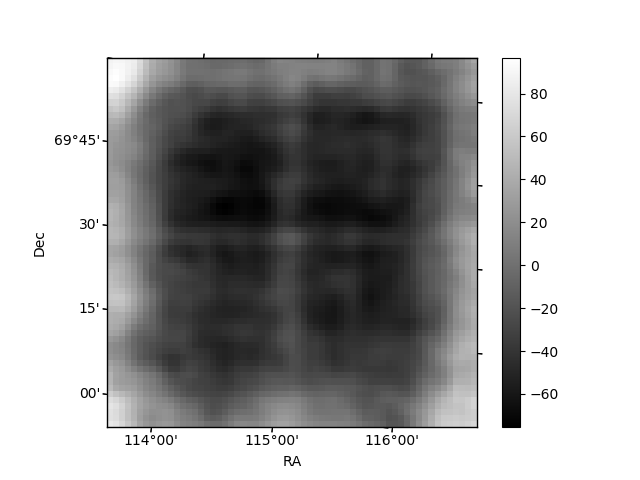
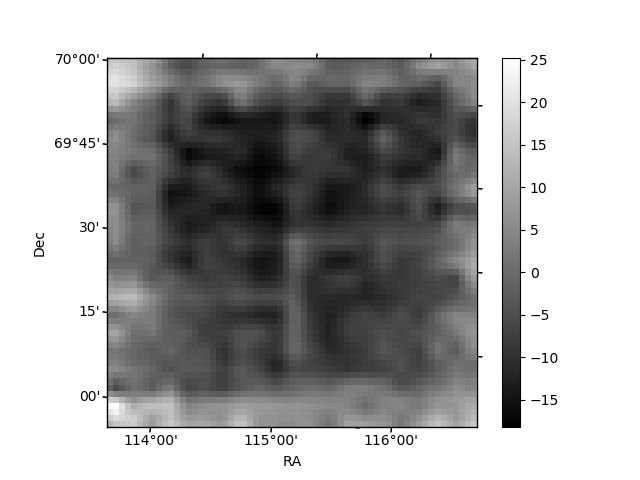
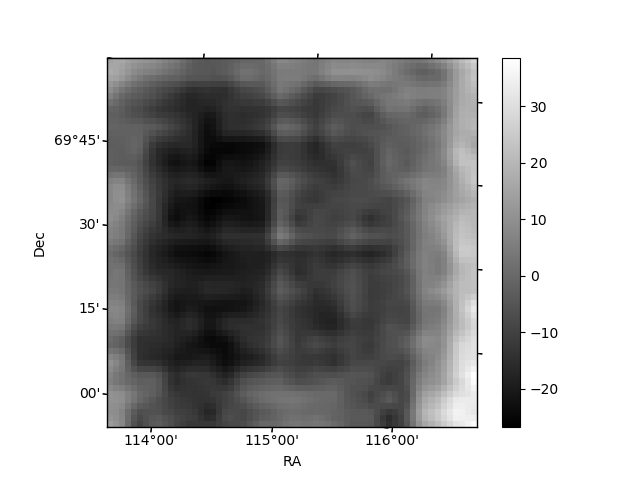
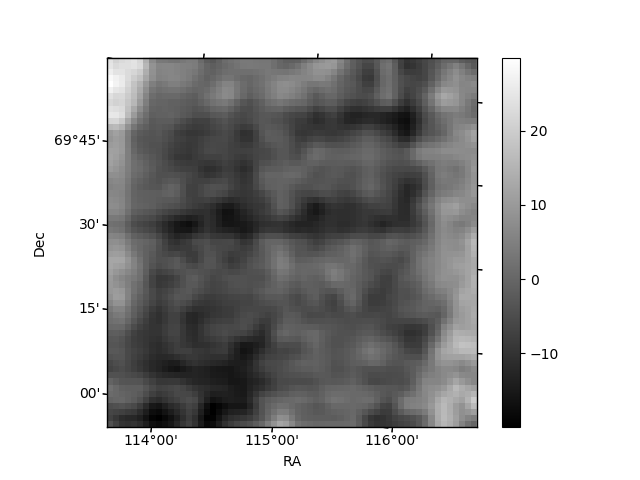
Histogram calculated using DETX and DETY for each event in the final _common_clean file
| Quadrant A | 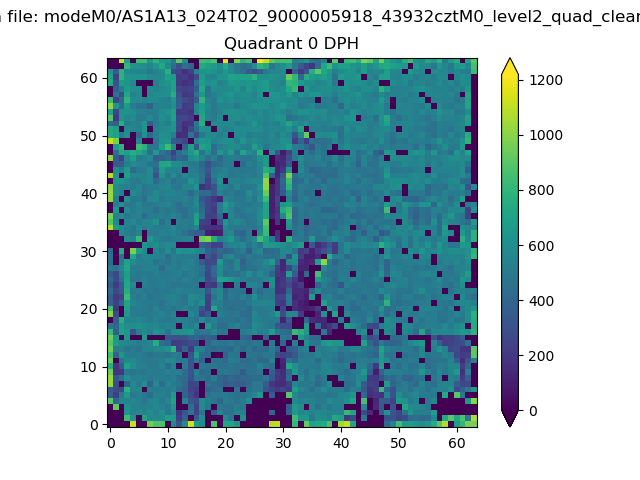 |
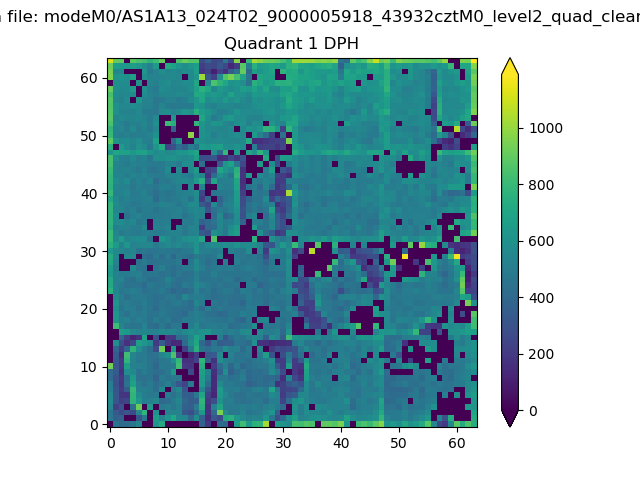 |
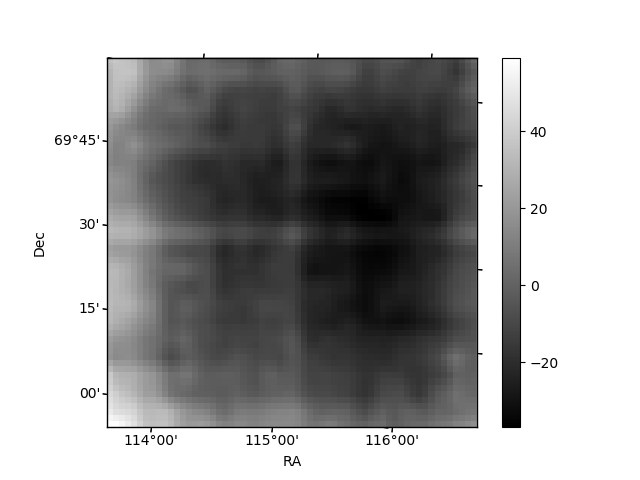
Quadrant B |
|---|---|---|---|
| Quadrant D | 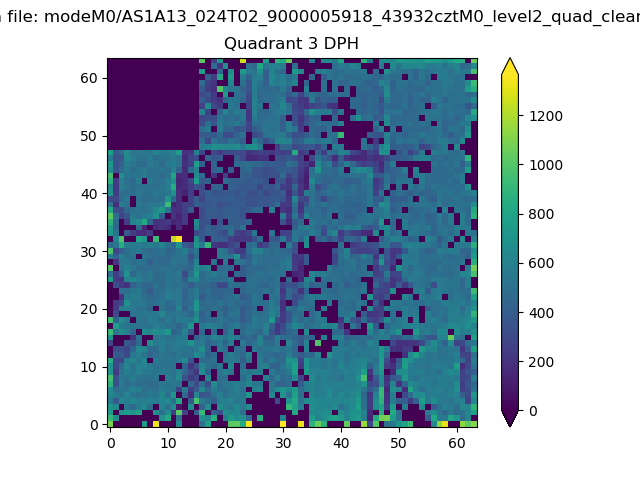 |
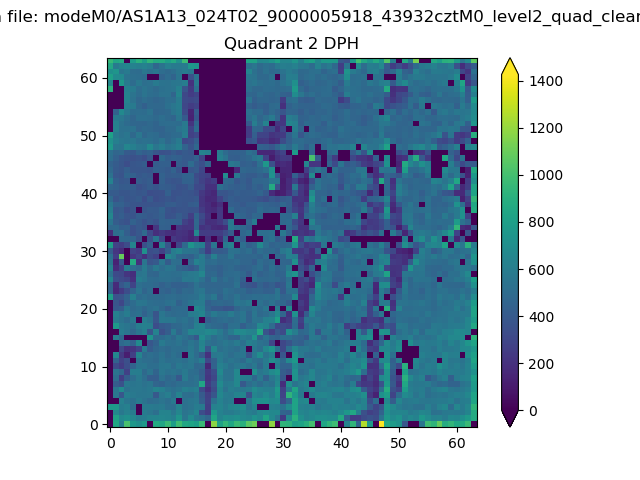 |
Quadrant C |
| Plot type | Count rate plots | Images |
|---|---|---|
| Comparison with Poisson distribution Blue bars denote a histogram of data divided into 1 sec bins. Red curve is a Poisson curve with rate = median count rate of data. |
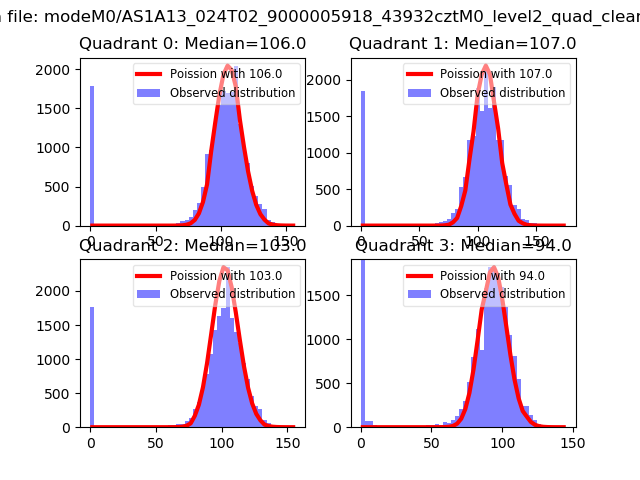 |
 |
| Quadrant-wise count rates Data is divided into 100 sec bins |
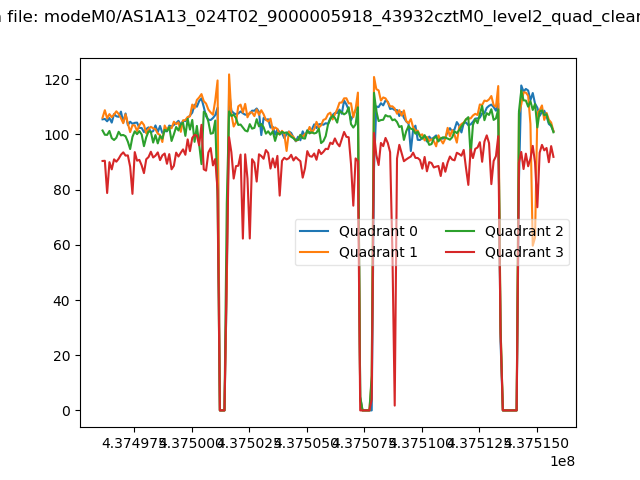 |
|
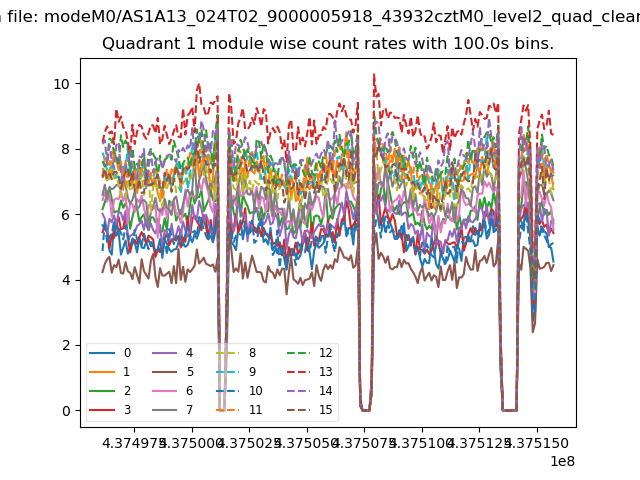
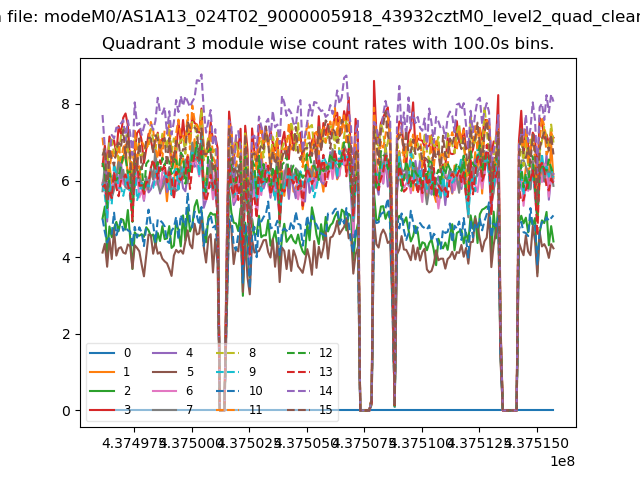
| Module-wise count rates for Quadrant A Data is divided into 100 sec bins |
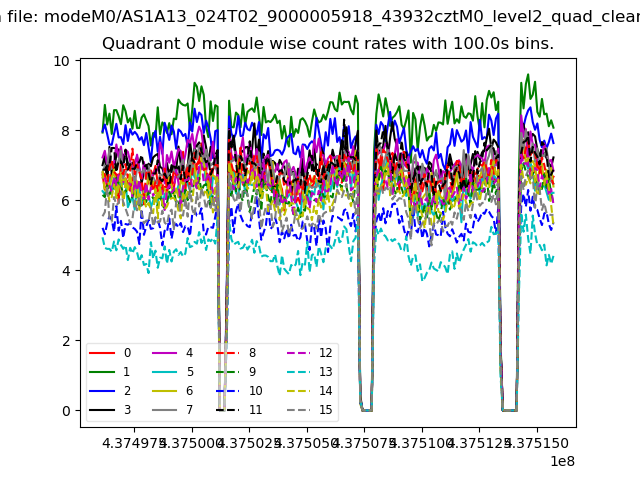 |
 |
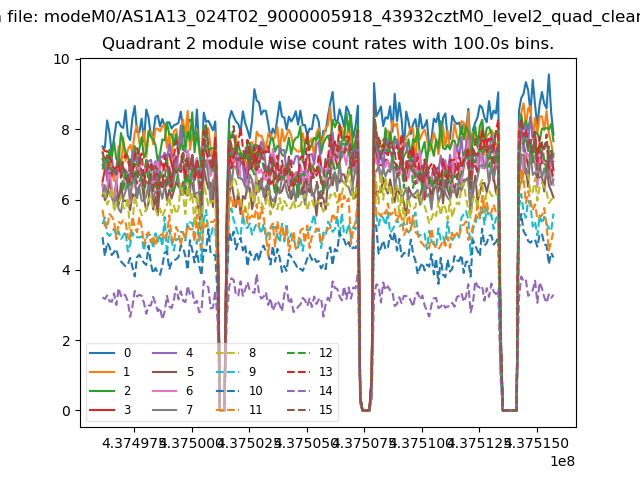
| Module-wise count rates for Quadrant B Data is divided into 100 sec bins |
 |
 |
| Module-wise count rates for Quadrant C Data is divided into 100 sec bins |
 |
 |
| Module-wise count rates for Quadrant D Data is divided into 100 sec bins |
 |
 |
| Parameter | Plot |
|---|---|
| CZT HV Monitor | 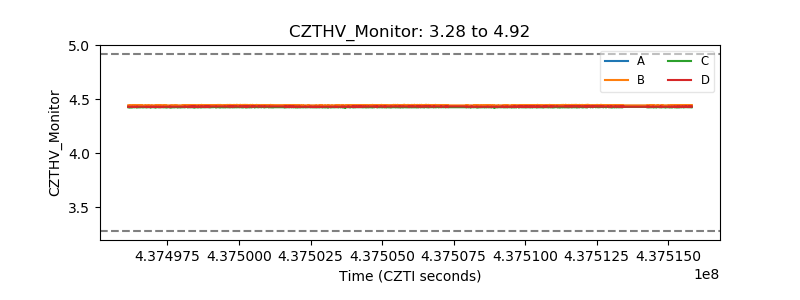 |
| D_VDD | 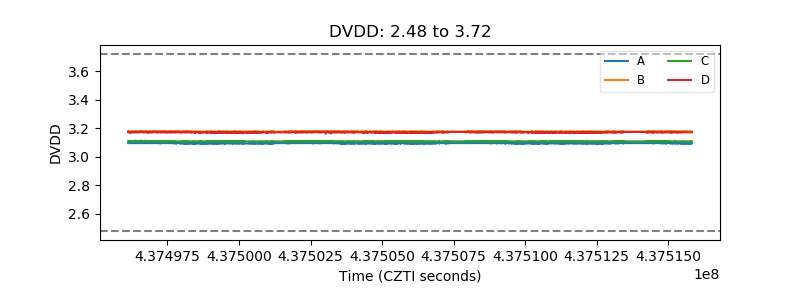 |
| Temperature 1 | 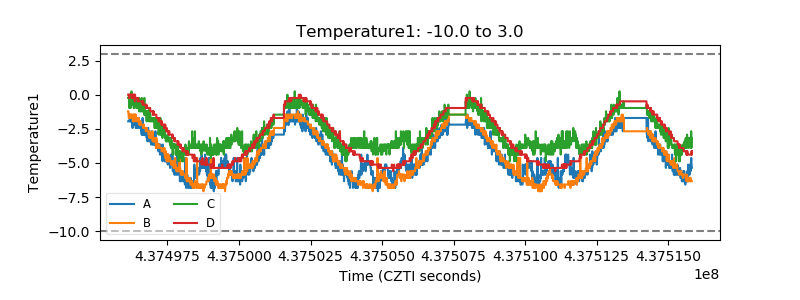 |
| Veto HV Monitor | 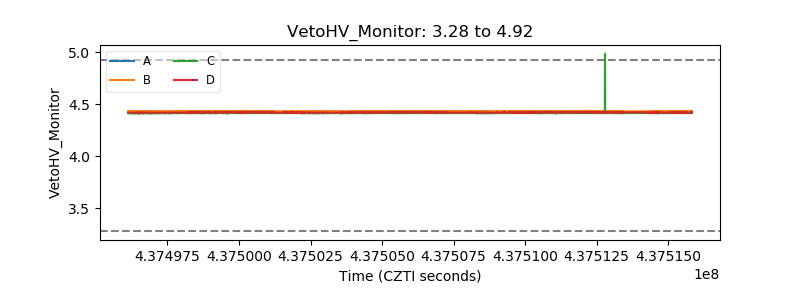 |
| Veto LLD | 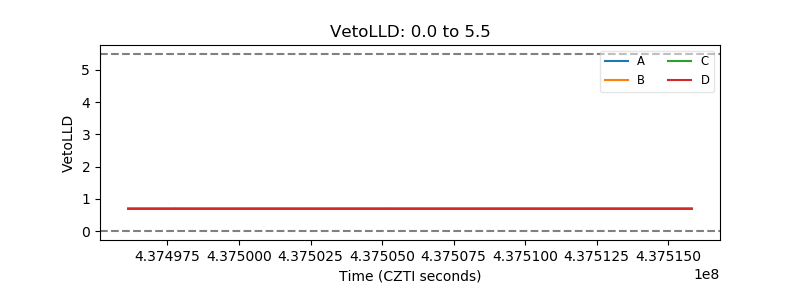 |
| Alpha Counter | 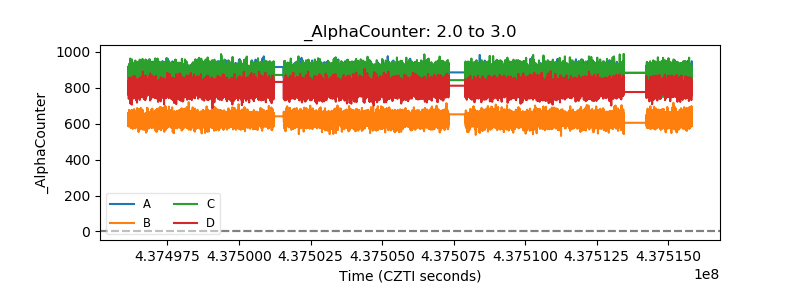 |
| _CPM_Rate | 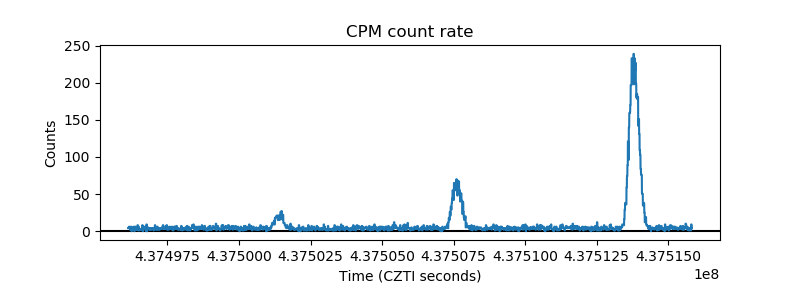 |
| CZT Counter | 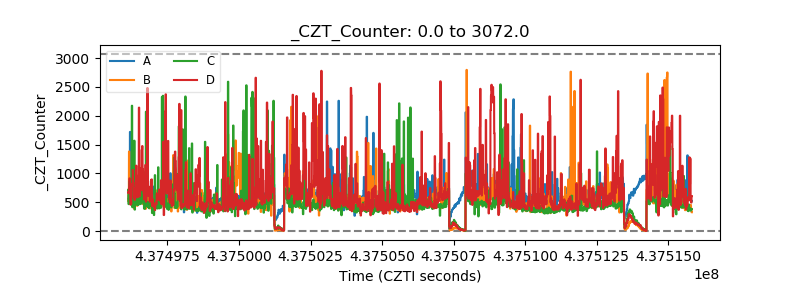 |
| +2.5 Volts monitor | 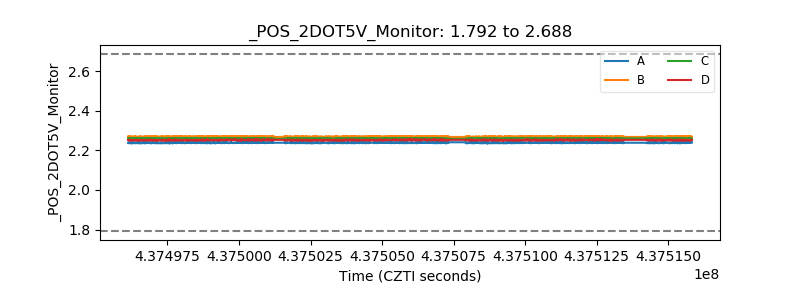 |
| +5 Volts monitor | 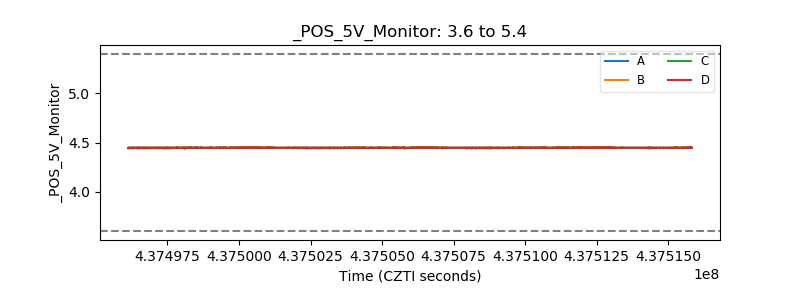 |
| _ROLL_ROT | 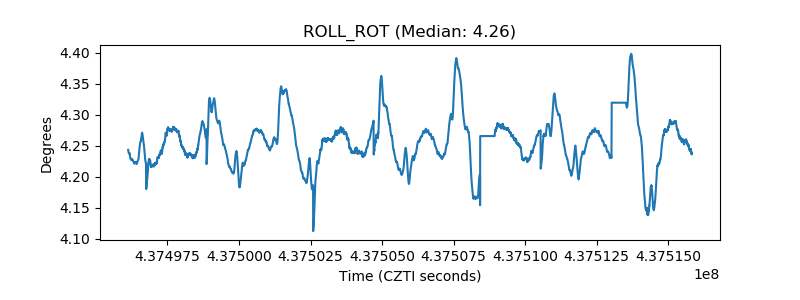 |
| _Roll_DEC | 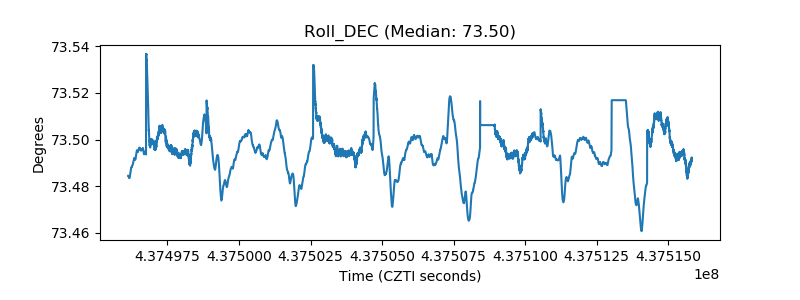 |
| _Roll_RA | 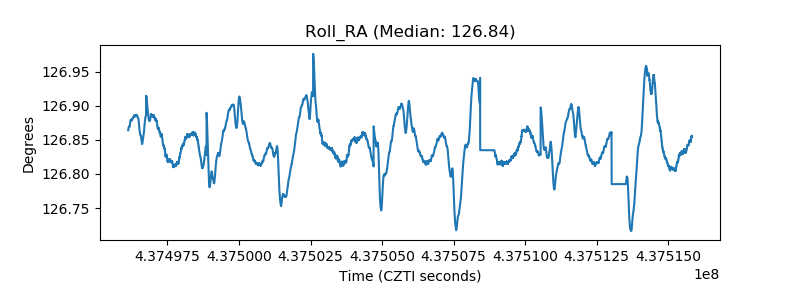 |
| Veto Counter | 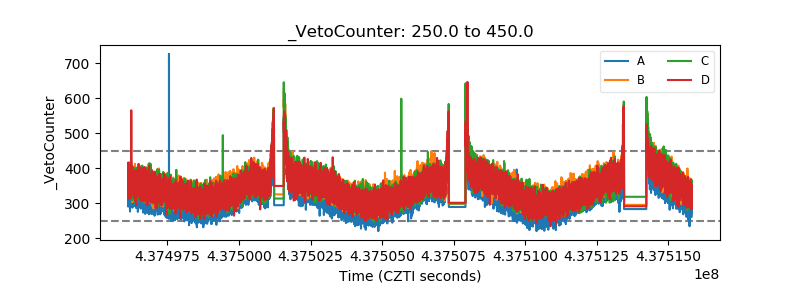 |