| Param | Original file | Final file |
|---|---|---|
| Filename | modeM0/AS1A13_024T02_9000005918_43933cztM0_level2.fits | modeM0/AS1A13_024T02_9000005918_43933cztM0_level2_quad_clean.evt |
| Size (bytes) | 588,784,320 | 101,041,920 |
| Size | 561.5 MB | 96.4 MB |
| Events in quadrant A | 5,624,988 | 698,704 |
| Events in quadrant B | 6,778,523 | 559,360 |
| Events in quadrant C | 3,308,652 | 719,998 |
| Events in quadrant D | 5,559,769 | 611,454 |
| Mode M0 | |||
|---|---|---|---|
| Quadrant | BADHDUFLAG | Total packets | Discarded packets |
| A | 0 | 21315 | 2 |
| B | 0 | 24863 | 2 |
| C | 0 | 14648 | 2 |
| D | 0 | 21293 | 3 |
| Mode SS | |||
|---|---|---|---|
| Quadrant | BADHDUFLAG | Total packets | Discarded packets |
| A | 0 | 138 | 0 |
| B | 0 | 138 | 0 |
| C | 0 | 138 | 0 |
| D | 0 | 138 | 0 |
| Mode M9 | |||
|---|---|---|---|
| Quadrant | BADHDUFLAG | Total packets | Discarded packets |
| A | 0 | 15 | 0 |
| B | 0 | 16 | 0 |
| C | 0 | 16 | 0 |
| D | 0 | 16 | 0 |
| Quadrant | Total seconds | Saturated seconds | Saturation percentage |
|---|---|---|---|
| A | 6736 | 311 | 4.616983% |
| B | 6736 | 1757 | 26.083729% |
| C | 6736 | 41 | 0.608670% |
| D | 6735 | 652 | 9.680772% |
Noise dominated data is calculated using 1-second bins in cleaned event files. If a bin has >2000 counts, and if more than 50% of those come from <1% of pixels, then it is considered to be noise-dominated and hence unusable.
| Quadrant | # 1 sec bins | Bins with >0 counts | Bins with >2000 counts | High rate bins dominated by noise | Noise dominated (total time) | Noise dominated (detector-on time) | Marked lightcurve |
|---|---|---|---|---|---|---|---|
| A | 7686 | 6737 | 186 | 186 | 2.42% | 2.76% | 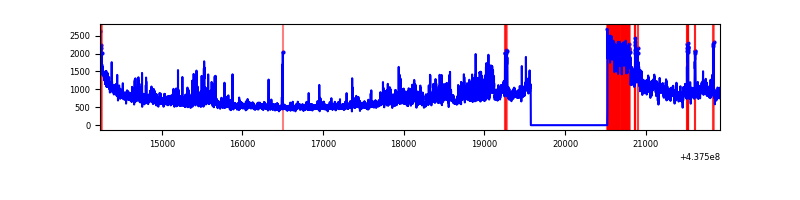 |
| B | 7686 | 6737 | 1392 | 1392 | 18.11% | 20.66% | 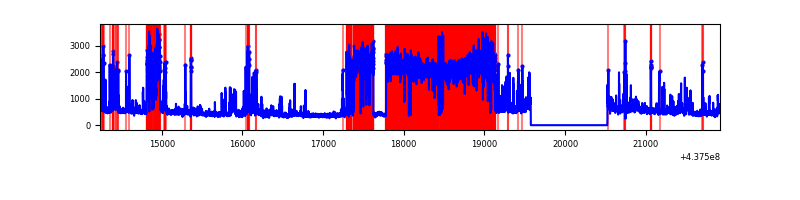 |
| C | 7686 | 6737 | 22 | 22 | 0.29% | 0.33% | 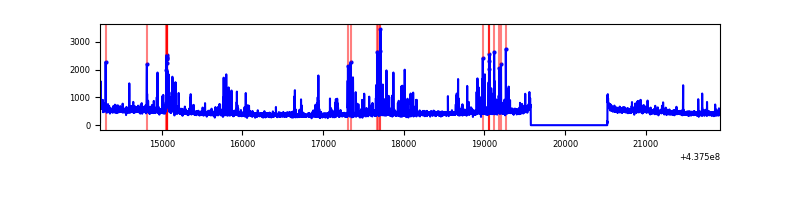 |
| D | 7685 | 6736 | 502 | 502 | 6.53% | 7.45% | 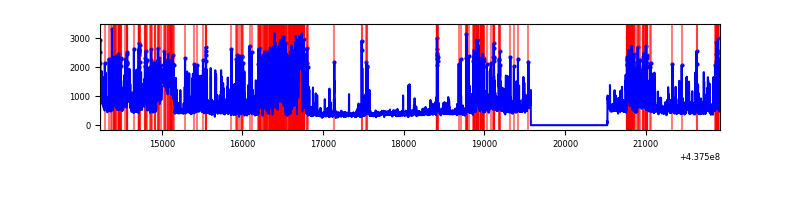 |
Top three noisy pixels from each quadrant. If the there are fewer than three noisy pixels in the level2.evt file, extra rows are filled as -1
| Pixel properties | Quadrant properties | ||||||
|---|---|---|---|---|---|---|---|
| Quadrant | DetID | PixID | Counts | Sigma | Mean | Median | Sigma |
| A | 15 | 222 | 1408198 | 9452.66 | 723 | 709 | 148.9 |
| A | 10 | 83 | 1192739 | 8005.64 | 723 | 709 | 148.9 |
| A | 15 | 223 | 85747 | 571.11 | 723 | 709 | 148.9 |
| B | 5 | 235 | 3799467 | 31883.96 | 606 | 588 | 119.1 |
| B | 0 | 213 | 114183 | 953.4 | 606 | 588 | 119.1 |
| B | 0 | 200 | 99793 | 832.63 | 606 | 588 | 119.1 |
| C | 14 | 254 | 276182 | 1597.79 | 726 | 729 | 172.4 |
| C | 3 | 233 | 100137 | 576.62 | 726 | 729 | 172.4 |
| C | 1 | 241 | 35343 | 200.78 | 726 | 729 | 172.4 |
| D | 12 | 17 | 832837 | 4646.3 | 701 | 678 | 179.1 |
| D | 1 | 52 | 317167 | 1767.09 | 701 | 678 | 179.1 |
| D | 14 | 226 | 289066 | 1610.19 | 701 | 678 | 179.1 |
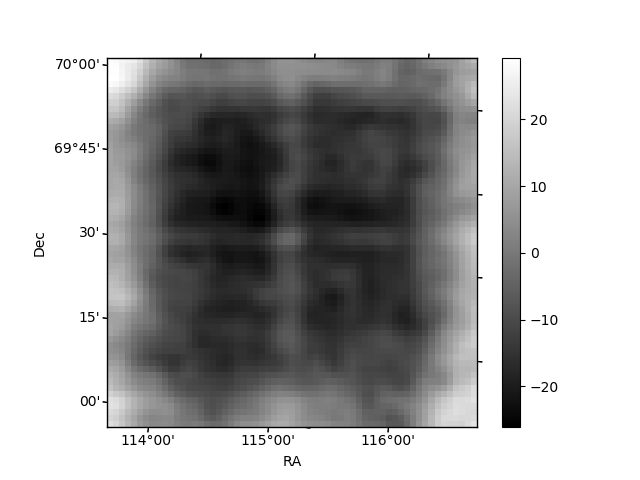
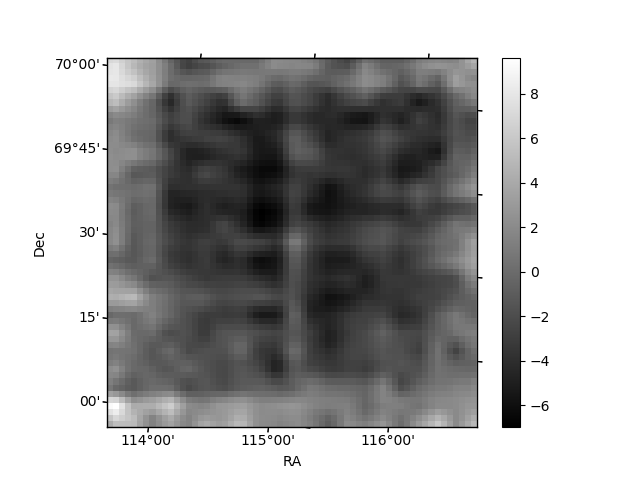
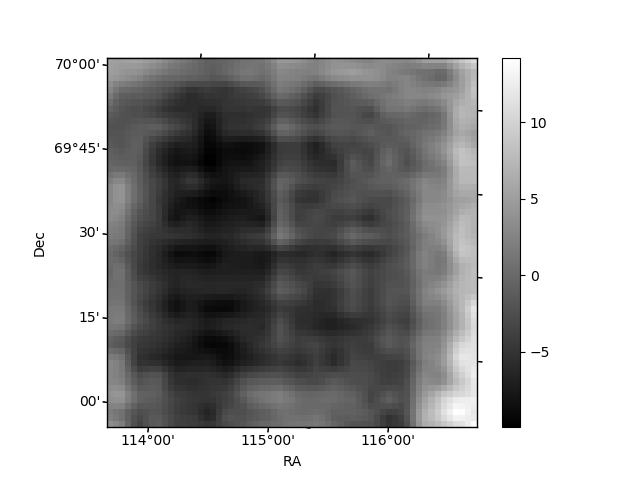
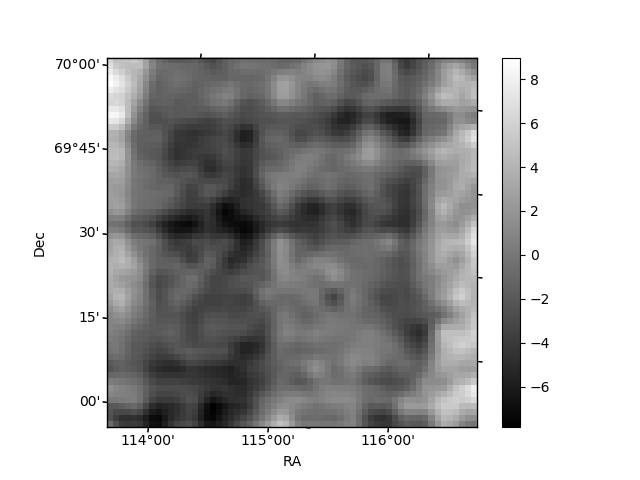
Histogram calculated using DETX and DETY for each event in the final _common_clean file
| Quadrant A | 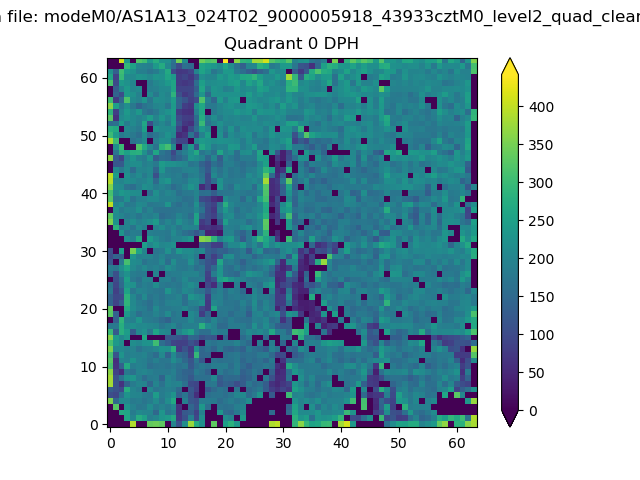 |
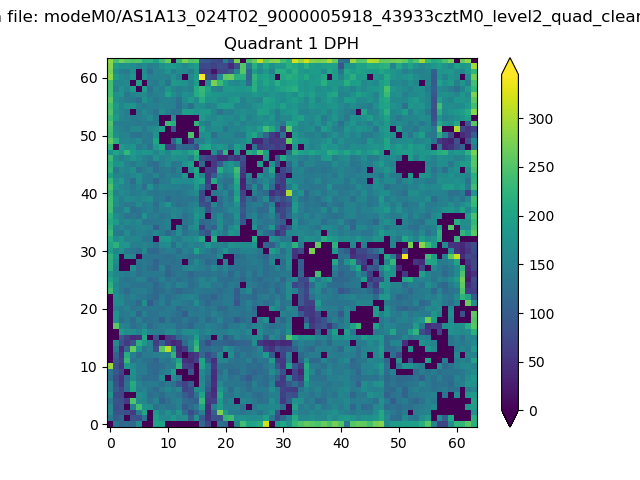 |
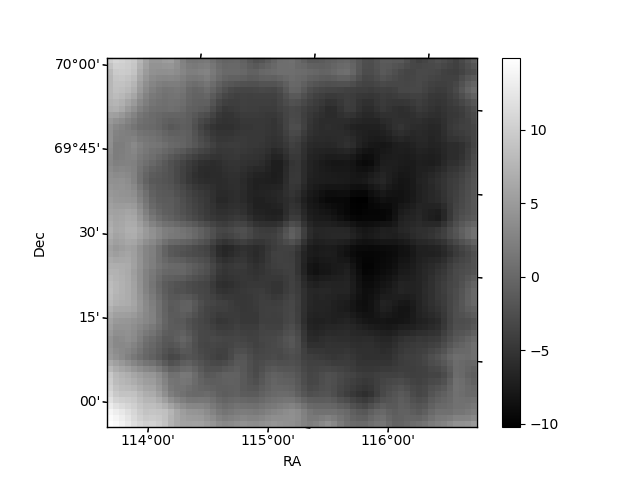
Quadrant B |
|---|---|---|---|
| Quadrant D | 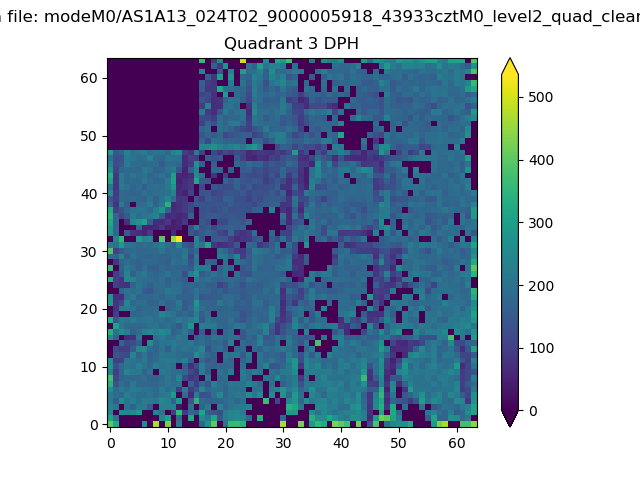 |
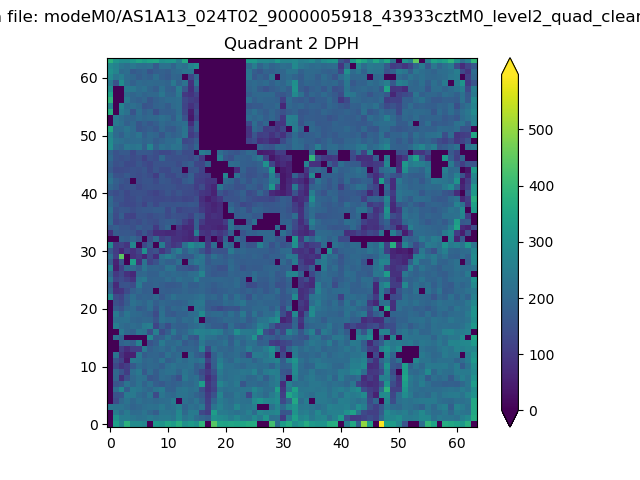 |
Quadrant C |
| Plot type | Count rate plots | Images |
|---|---|---|
| Comparison with Poisson distribution Blue bars denote a histogram of data divided into 1 sec bins. Red curve is a Poisson curve with rate = median count rate of data. |
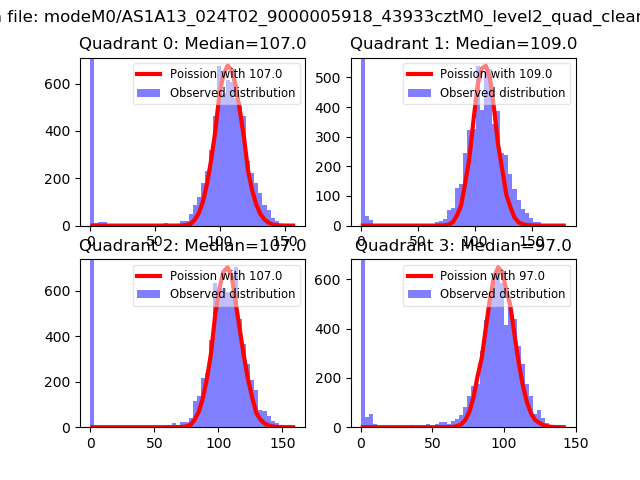 |
 |
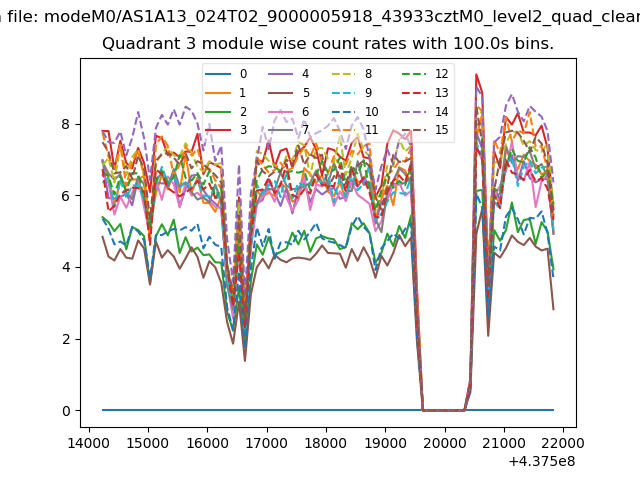
| Quadrant-wise count rates Data is divided into 100 sec bins |
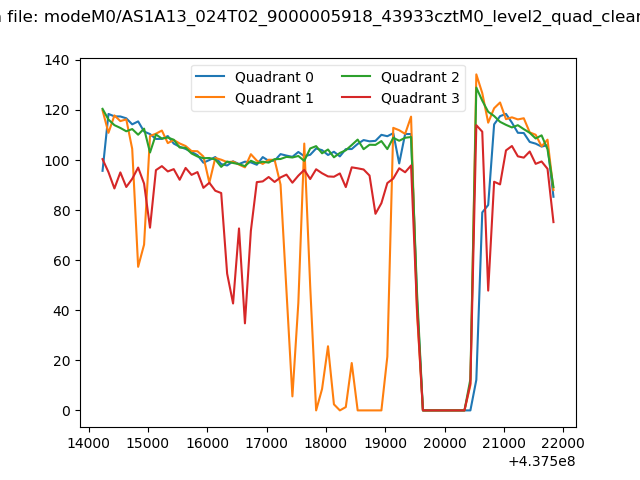 |
|
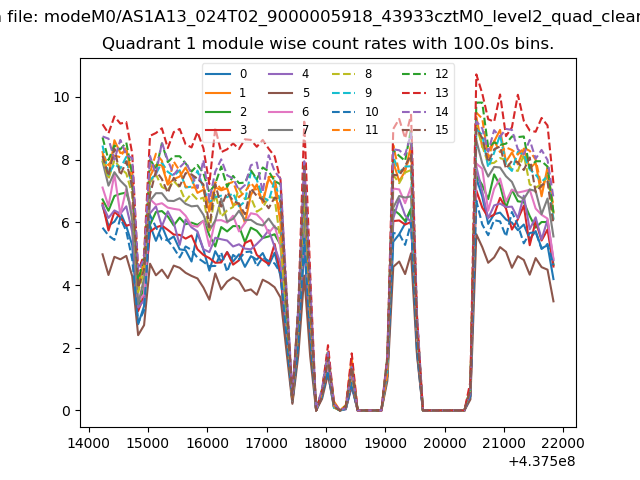
| Module-wise count rates for Quadrant A Data is divided into 100 sec bins |
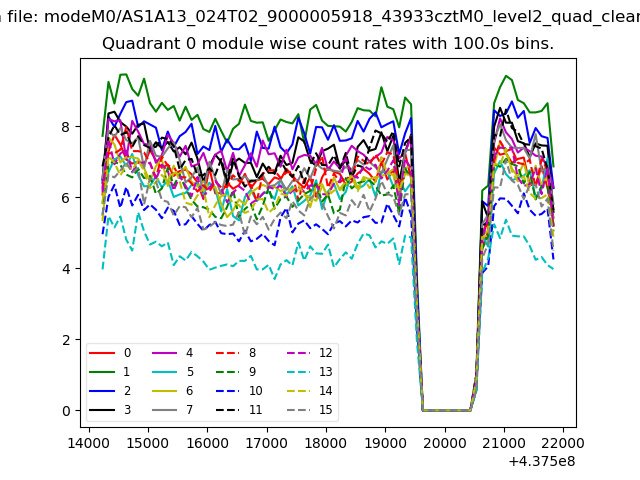 |
 |
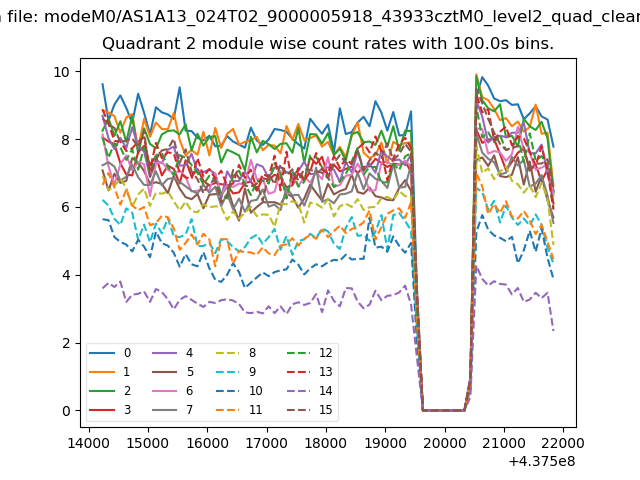
| Module-wise count rates for Quadrant B Data is divided into 100 sec bins |
 |
 |
| Module-wise count rates for Quadrant C Data is divided into 100 sec bins |
 |
 |
| Module-wise count rates for Quadrant D Data is divided into 100 sec bins |
 |
 |
| Parameter | Plot |
|---|---|
| CZT HV Monitor | 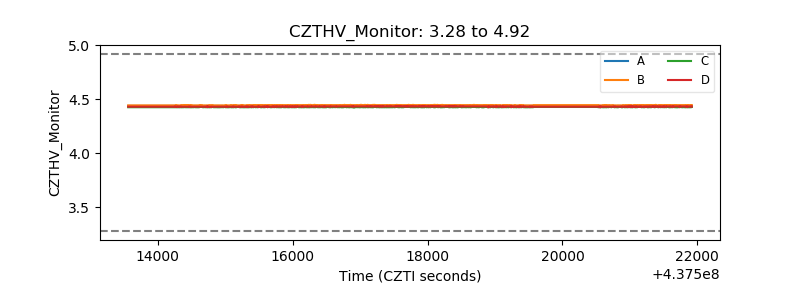 |
| D_VDD | 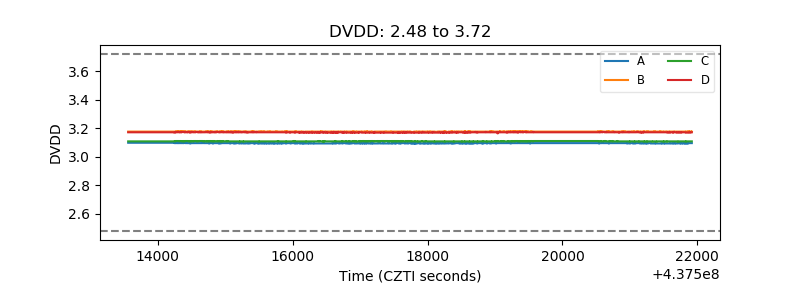 |
| Temperature 1 | 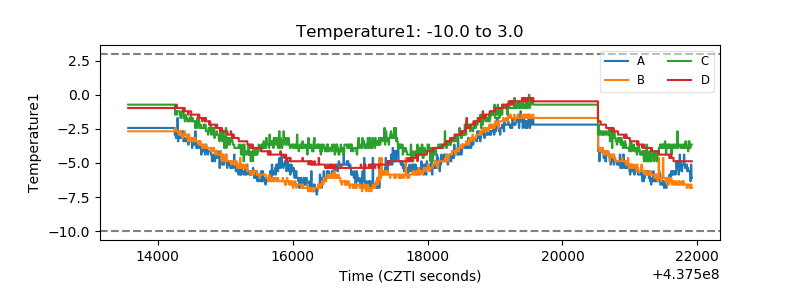 |
| Veto HV Monitor |  |
| Veto LLD | 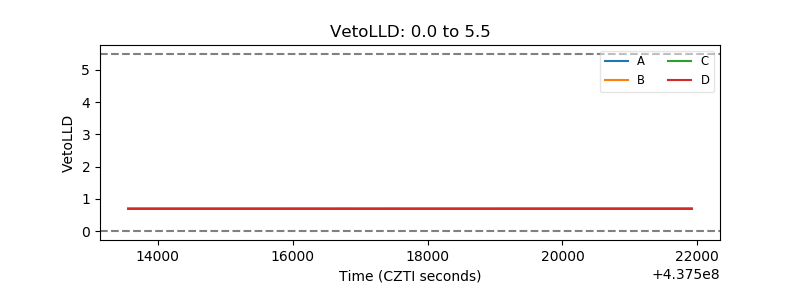 |
| Alpha Counter | 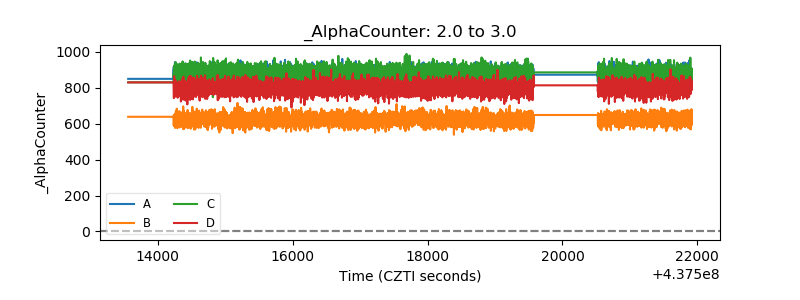 |
| _CPM_Rate | 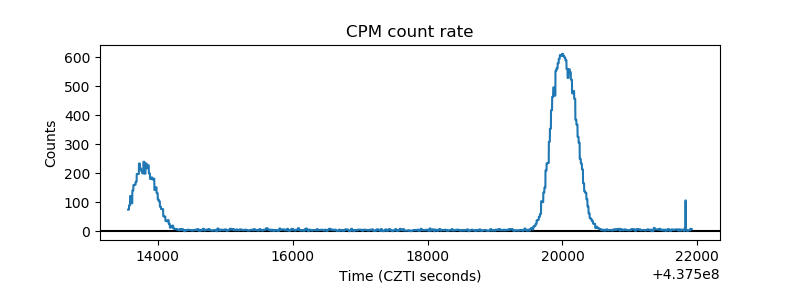 |
| CZT Counter | 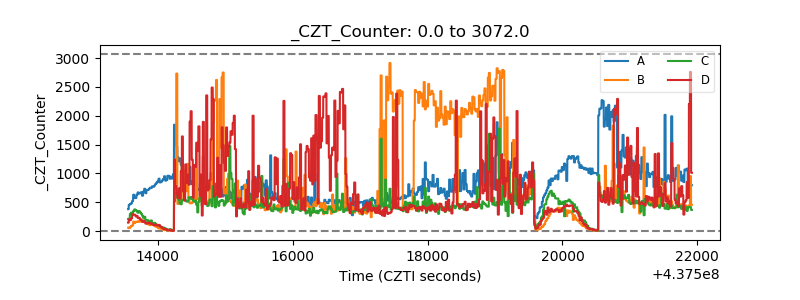 |
| +2.5 Volts monitor | 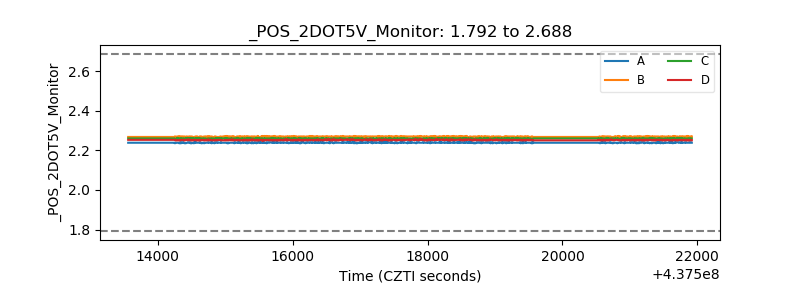 |
| +5 Volts monitor | 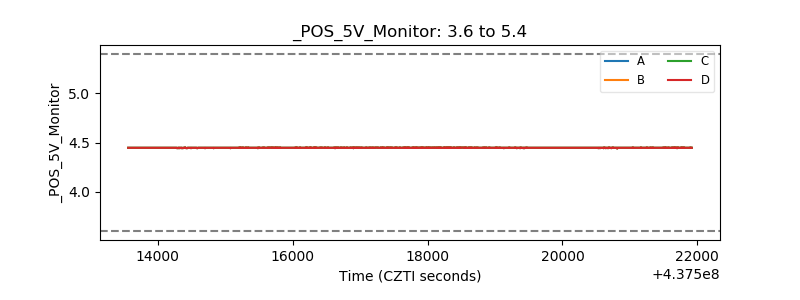 |
| _ROLL_ROT | 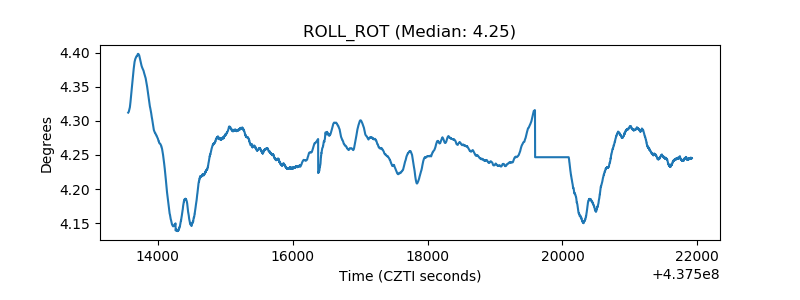 |
| _Roll_DEC | 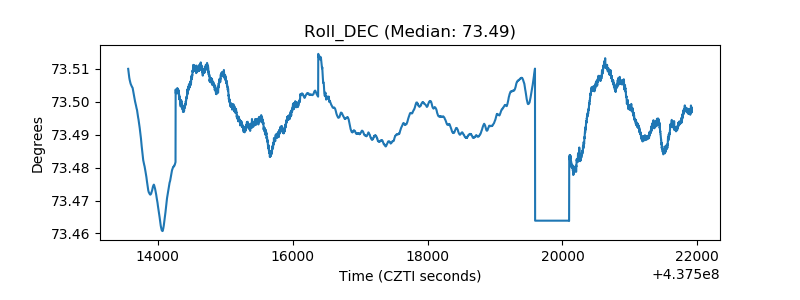 |
| _Roll_RA | 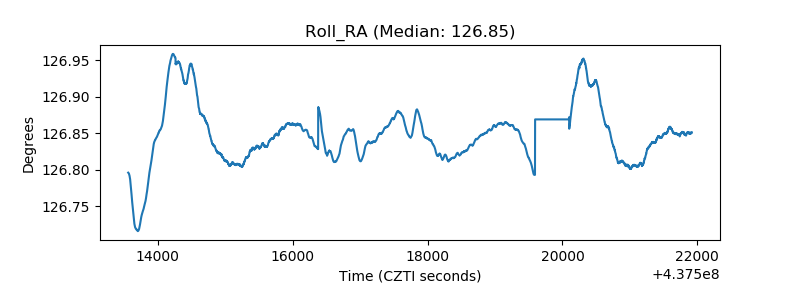 |
| Veto Counter | 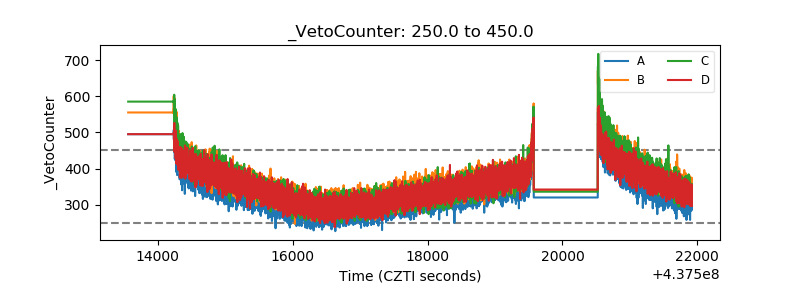 |