| Param | Original file | Final file |
|---|---|---|
| Filename | modeM0/AS1A13_024T02_9000005918_43935cztM0_level2.fits | modeM0/AS1A13_024T02_9000005918_43935cztM0_level2_quad_clean.evt |
| Size (bytes) | 552,893,760 | 107,334,720 |
| Size | 527.3 MB | 102.4 MB |
| Events in quadrant A | 6,513,284 | 710,068 |
| Events in quadrant B | 3,559,763 | 758,830 |
| Events in quadrant C | 4,728,117 | 674,849 |
| Events in quadrant D | 5,139,783 | 633,884 |
| Mode M0 | |||
|---|---|---|---|
| Quadrant | BADHDUFLAG | Total packets | Discarded packets |
| A | 0 | 24418 | 2 |
| B | 0 | 15499 | 2 |
| C | 0 | 18940 | 2 |
| D | 0 | 20124 | 2 |
| Mode SS | |||
|---|---|---|---|
| Quadrant | BADHDUFLAG | Total packets | Discarded packets |
| A | 0 | 138 | 0 |
| B | 0 | 138 | 0 |
| C | 0 | 138 | 0 |
| D | 0 | 138 | 0 |
| Mode M9 | |||
|---|---|---|---|
| Quadrant | BADHDUFLAG | Total packets | Discarded packets |
| A | 0 | 14 | 0 |
| B | 0 | 15 | 0 |
| C | 0 | 15 | 0 |
| D | 0 | 15 | 0 |
| Quadrant | Total seconds | Saturated seconds | Saturation percentage |
|---|---|---|---|
| A | 6772 | 373 | 5.507974% |
| B | 6772 | 119 | 1.757236% |
| C | 6772 | 640 | 9.450679% |
| D | 6772 | 499 | 7.368576% |
Noise dominated data is calculated using 1-second bins in cleaned event files. If a bin has >2000 counts, and if more than 50% of those come from <1% of pixels, then it is considered to be noise-dominated and hence unusable.
| Quadrant | # 1 sec bins | Bins with >0 counts | Bins with >2000 counts | High rate bins dominated by noise | Noise dominated (total time) | Noise dominated (detector-on time) | Marked lightcurve |
|---|---|---|---|---|---|---|---|
| A | 7852 | 6773 | 222 | 222 | 2.83% | 3.28% | 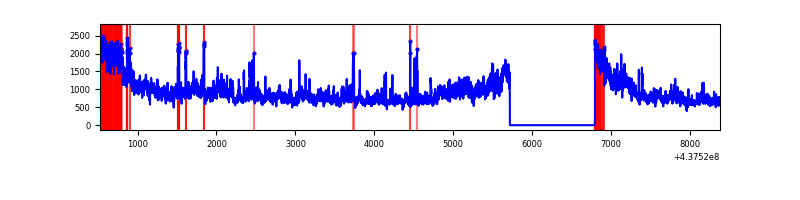 |
| B | 7852 | 6773 | 68 | 68 | 0.87% | 1.00% | 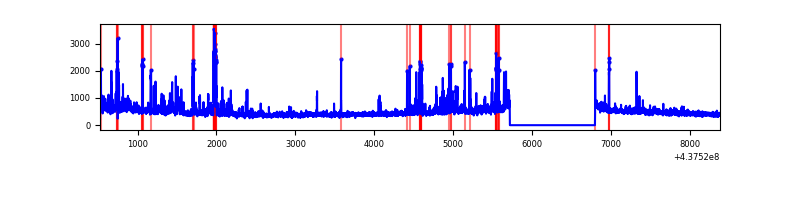 |
| C | 7852 | 6773 | 645 | 645 | 8.21% | 9.52% | 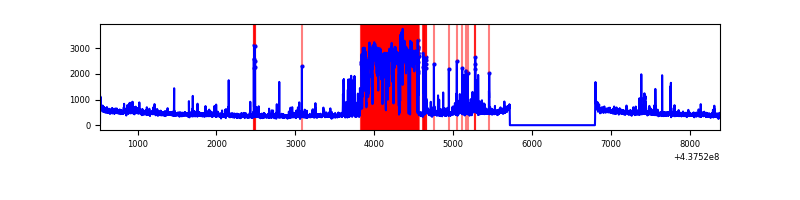 |
| D | 7852 | 6773 | 422 | 422 | 5.37% | 6.23% | 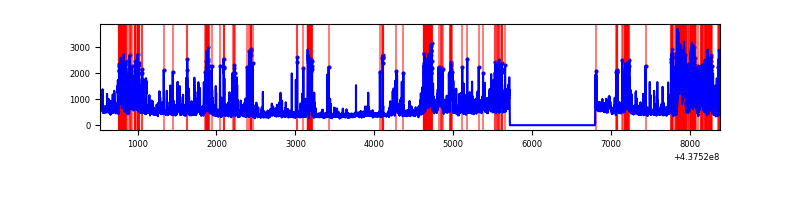 |
Top three noisy pixels from each quadrant. If the there are fewer than three noisy pixels in the level2.evt file, extra rows are filled as -1
| Pixel properties | Quadrant properties | ||||||
|---|---|---|---|---|---|---|---|
| Quadrant | DetID | PixID | Counts | Sigma | Mean | Median | Sigma |
| A | 15 | 222 | 2405675 | 16134.59 | 721 | 706 | 149.1 |
| A | 10 | 83 | 1174678 | 7876.01 | 721 | 706 | 149.1 |
| A | 7 | 191 | 37888 | 249.45 | 721 | 706 | 149.1 |
| B | 0 | 200 | 188909 | 1342.62 | 730 | 708 | 140.2 |
| B | 5 | 235 | 180561 | 1283.07 | 730 | 708 | 140.2 |
| B | 0 | 213 | 94925 | 672.14 | 730 | 708 | 140.2 |
| C | 1 | 241 | 1701966 | 10410.41 | 695 | 699 | 163.4 |
| C | 14 | 254 | 175571 | 1070.08 | 695 | 699 | 163.4 |
| C | 3 | 233 | 82079 | 497.98 | 695 | 699 | 163.4 |
| D | 12 | 17 | 360050 | 2041.25 | 698 | 675 | 176.1 |
| D | 1 | 52 | 348443 | 1975.32 | 698 | 675 | 176.1 |
| D | 13 | 249 | 262457 | 1486.92 | 698 | 675 | 176.1 |
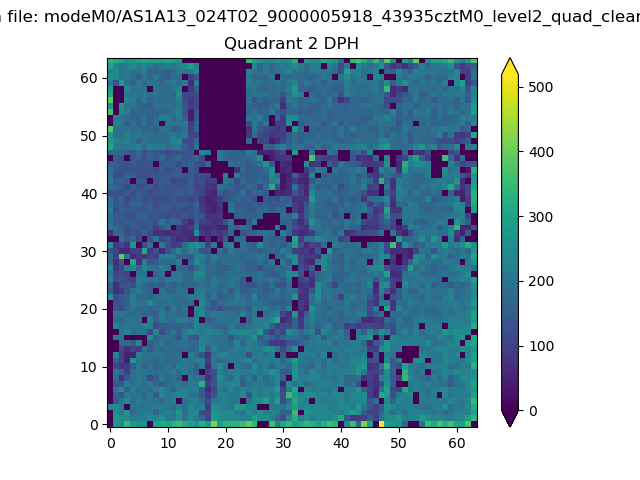
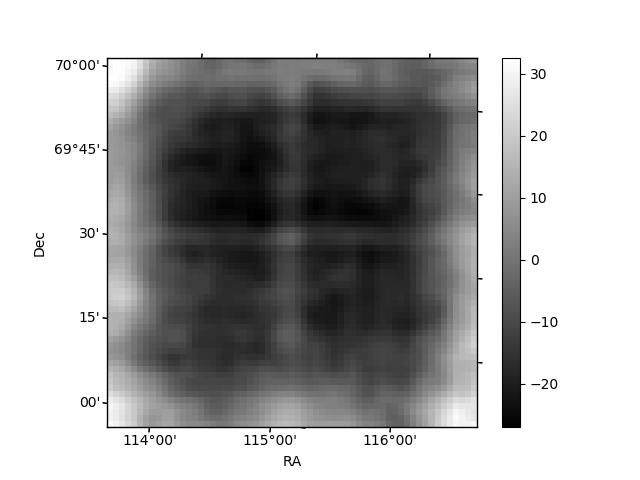
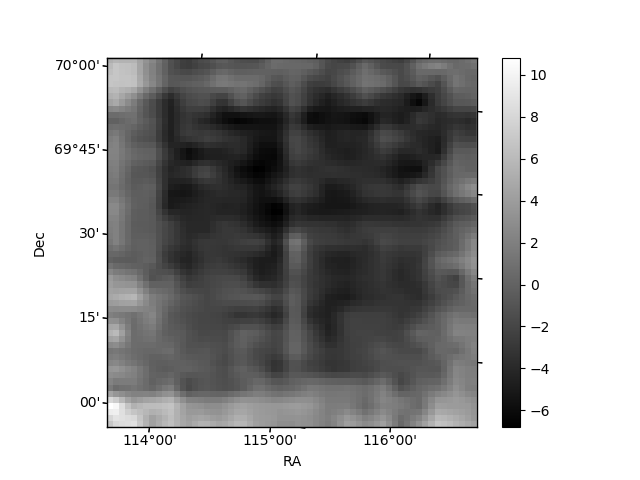
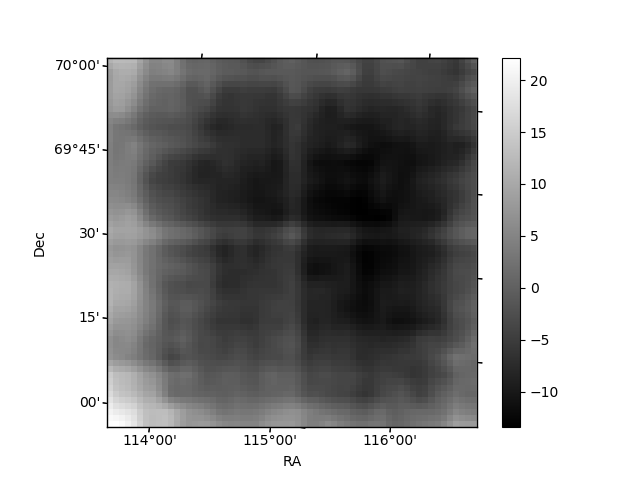
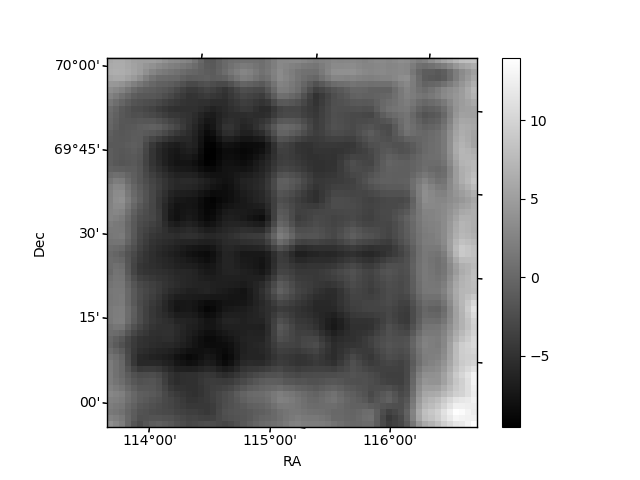
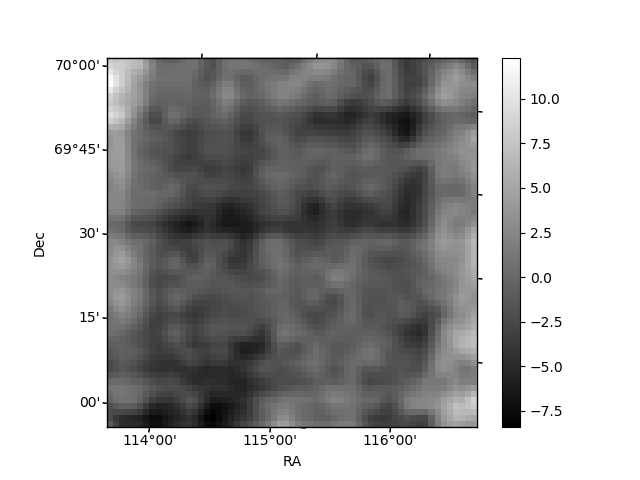
Histogram calculated using DETX and DETY for each event in the final _common_clean file
| Quadrant A | 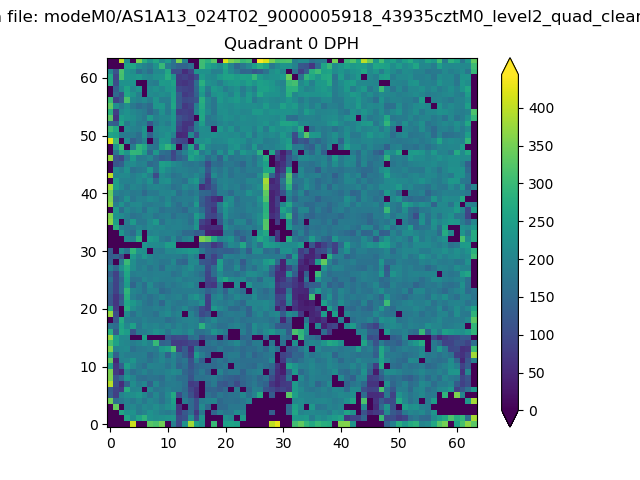 |
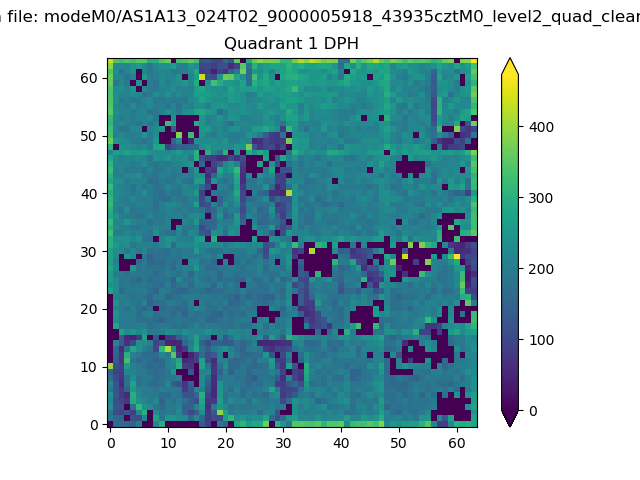 |
Quadrant B |
|---|---|---|---|
| Quadrant D | 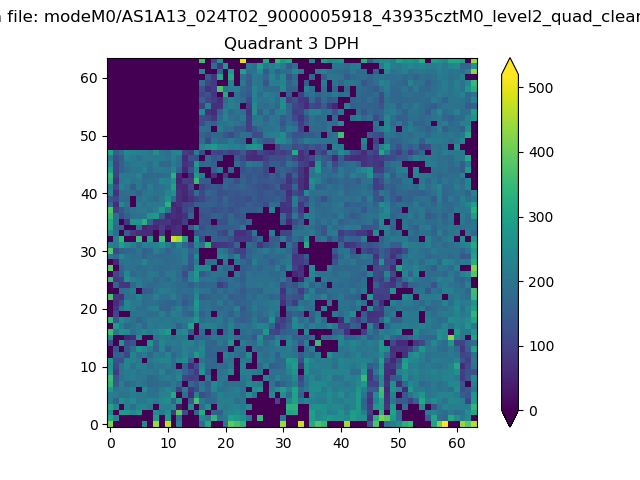 |
 |
Quadrant C |
| Plot type | Count rate plots | Images |
|---|---|---|
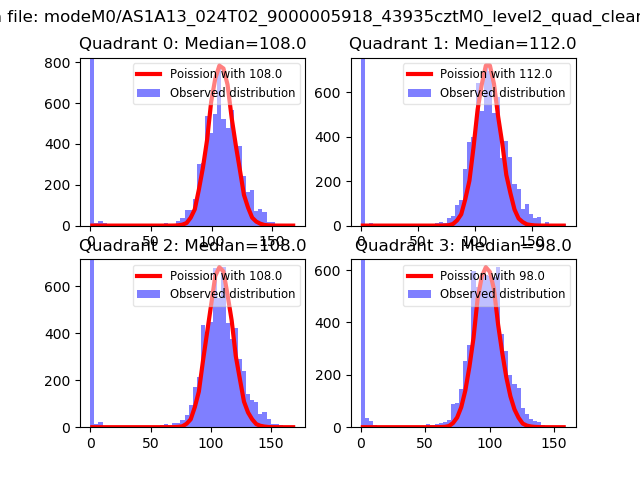
| Comparison with Poisson distribution Blue bars denote a histogram of data divided into 1 sec bins. Red curve is a Poisson curve with rate = median count rate of data. |
 |
 |
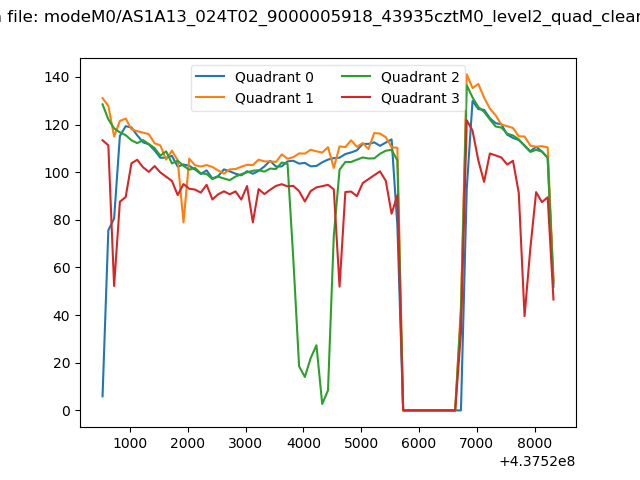
| Quadrant-wise count rates Data is divided into 100 sec bins |
 |
|
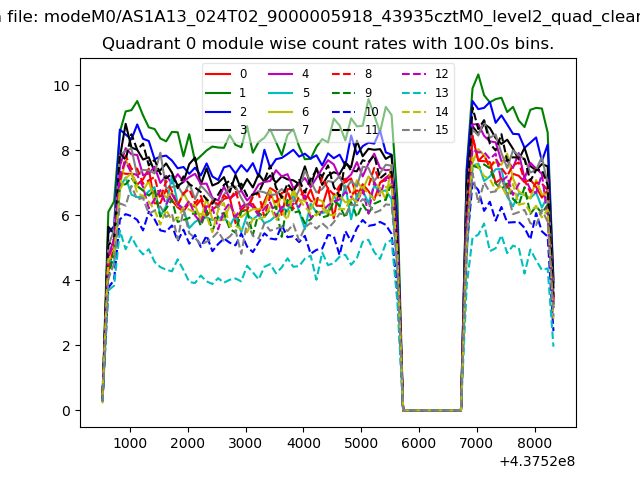
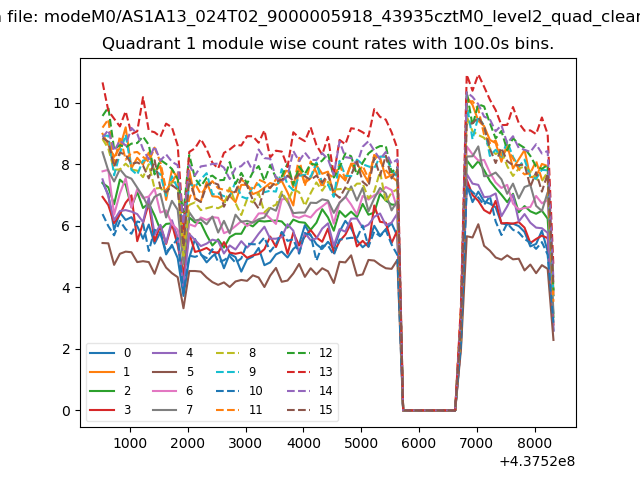
| Module-wise count rates for Quadrant A Data is divided into 100 sec bins |
 |
 |
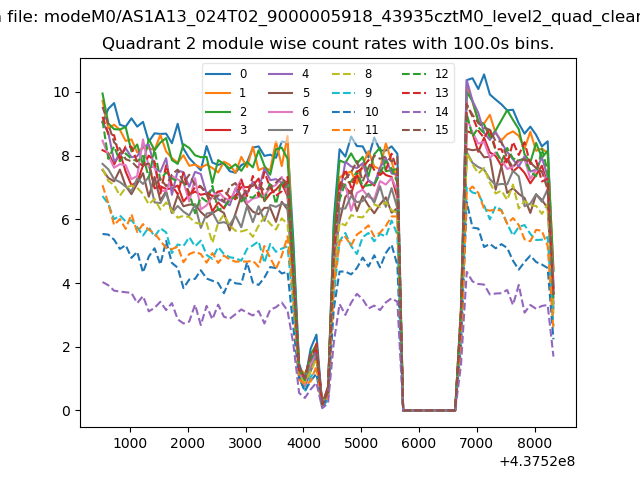
| Module-wise count rates for Quadrant B Data is divided into 100 sec bins |
 |
 |
| Module-wise count rates for Quadrant C Data is divided into 100 sec bins |
 |
 |
| Module-wise count rates for Quadrant D Data is divided into 100 sec bins |
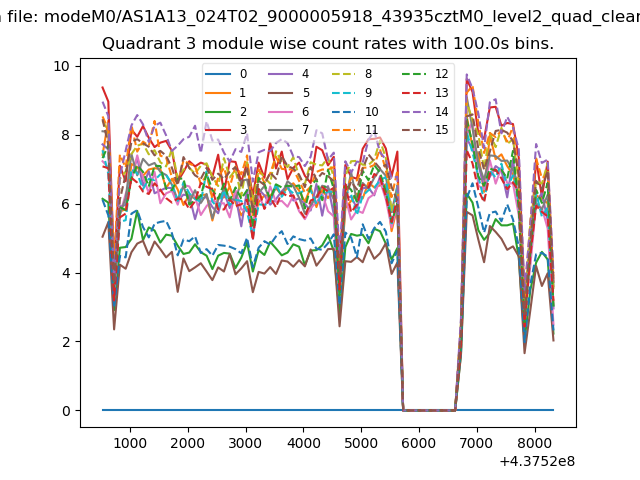 |
 |
| Parameter | Plot |
|---|---|
| CZT HV Monitor | 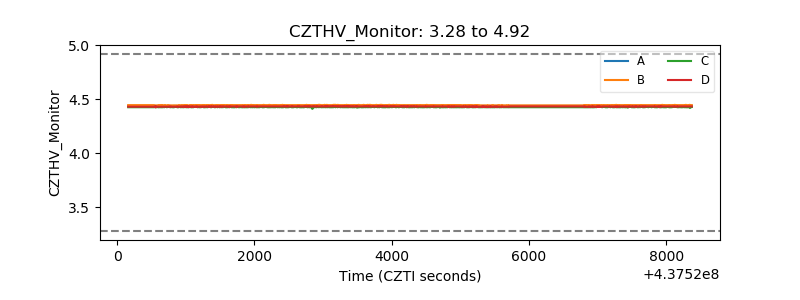 |
| D_VDD | 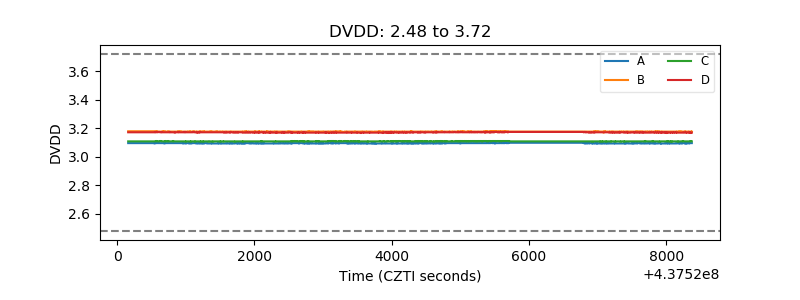 |
| Temperature 1 | 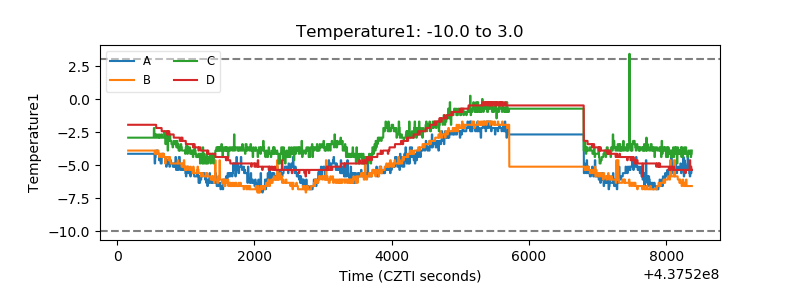 |
| Veto HV Monitor | 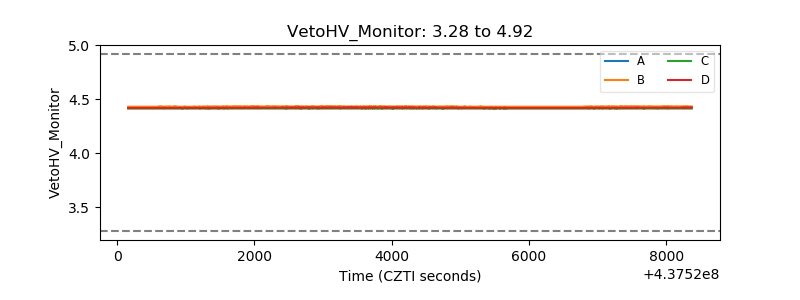 |
| Veto LLD | 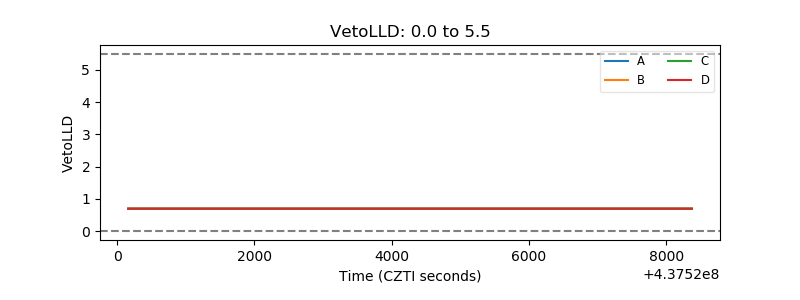 |
| Alpha Counter | 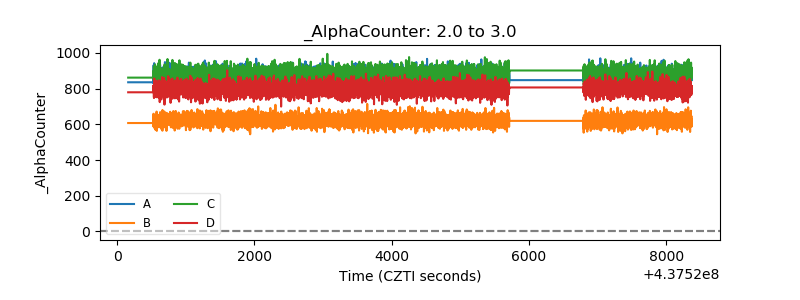 |
| _CPM_Rate | 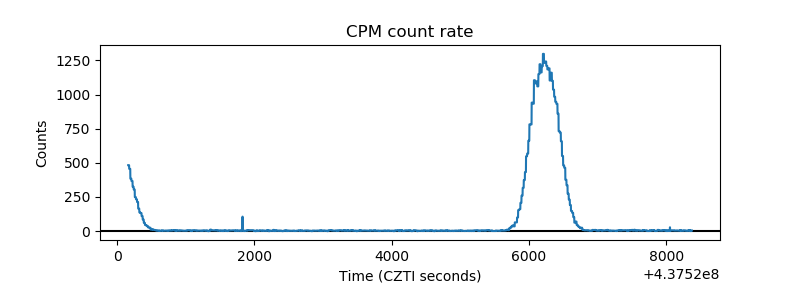 |
| CZT Counter | 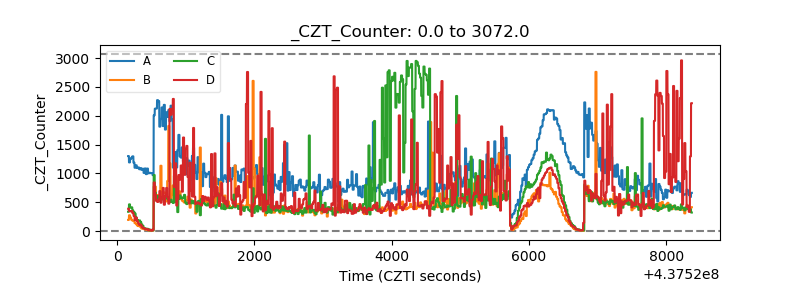 |
| +2.5 Volts monitor | 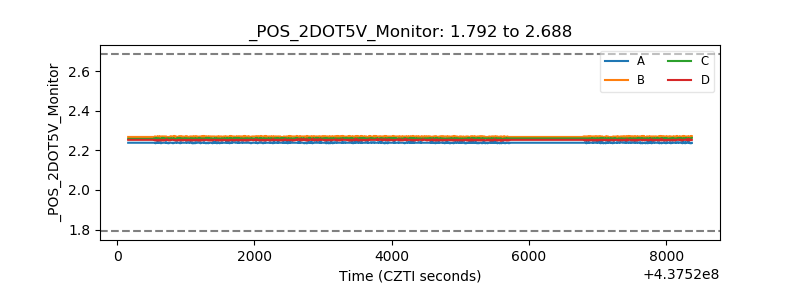 |
| +5 Volts monitor | 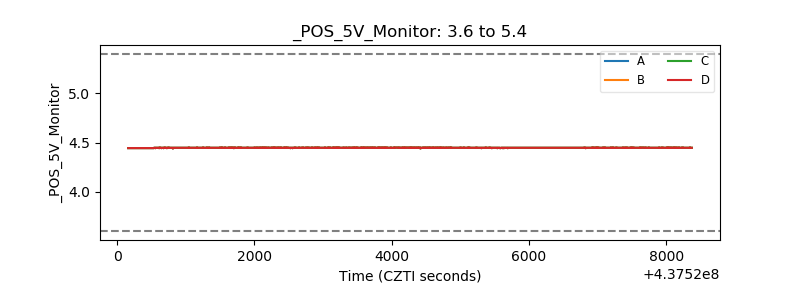 |
| _ROLL_ROT | 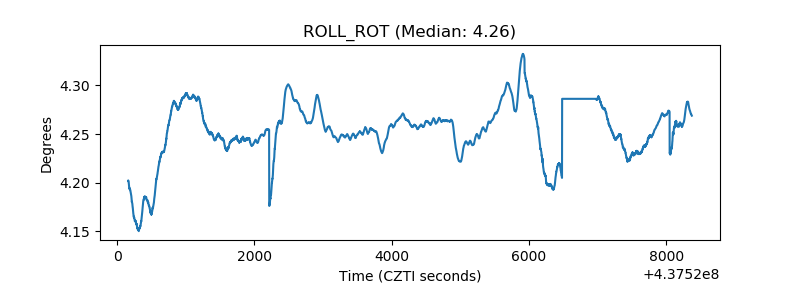 |
| _Roll_DEC | 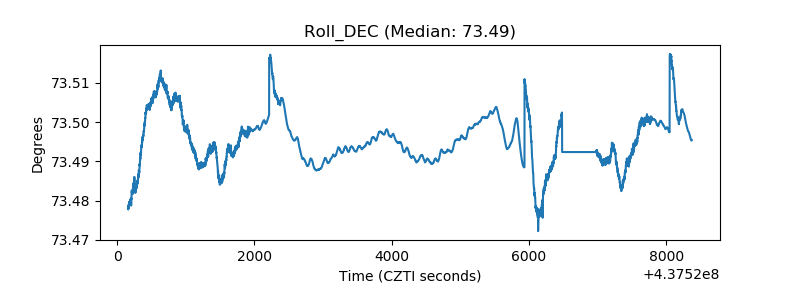 |
| _Roll_RA | 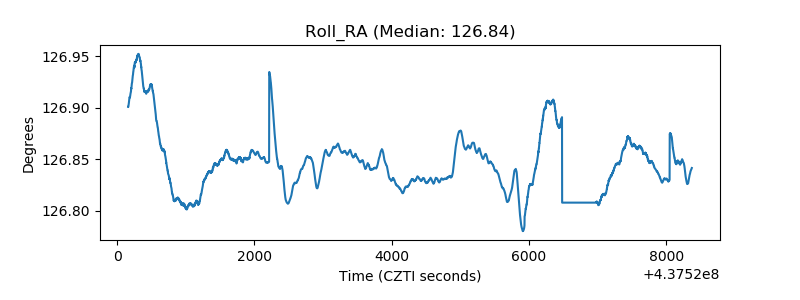 |
| Veto Counter | 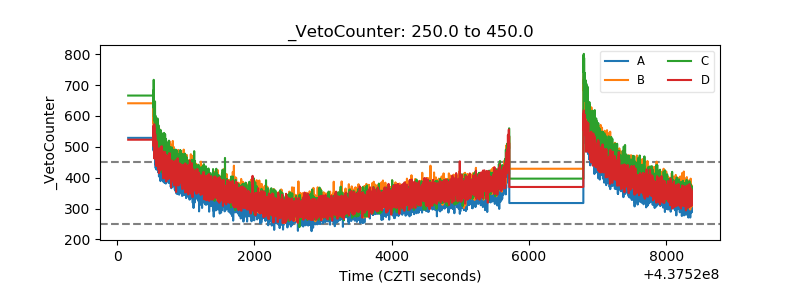 |