| Param | Original file | Final file |
|---|---|---|
| Filename | modeM0/AS1A13_024T02_9000005918_43936cztM0_level2.fits | modeM0/AS1A13_024T02_9000005918_43936cztM0_level2_quad_clean.evt |
| Size (bytes) | 498,870,720 | 108,843,840 |
| Size | 475.8 MB | 103.8 MB |
| Events in quadrant A | 6,103,171 | 715,428 |
| Events in quadrant B | 3,154,961 | 764,163 |
| Events in quadrant C | 2,968,495 | 735,784 |
| Events in quadrant D | 5,733,105 | 624,331 |
| Mode M0 | |||
|---|---|---|---|
| Quadrant | BADHDUFLAG | Total packets | Discarded packets |
| A | 0 | 23033 | 1 |
| B | 0 | 14068 | 1 |
| C | 0 | 13654 | 1 |
| D | 0 | 21496 | 1 |
| Mode SS | |||
|---|---|---|---|
| Quadrant | BADHDUFLAG | Total packets | Discarded packets |
| A | 0 | 134 | 0 |
| B | 0 | 134 | 0 |
| C | 0 | 134 | 0 |
| D | 0 | 134 | 0 |
| Mode M9 | |||
|---|---|---|---|
| Quadrant | BADHDUFLAG | Total packets | Discarded packets |
| A | 0 | 11 | 0 |
| B | 0 | 11 | 0 |
| C | 0 | 11 | 0 |
| D | 0 | 11 | 0 |
| Quadrant | Total seconds | Saturated seconds | Saturation percentage |
|---|---|---|---|
| A | 6533 | 282 | 4.316547% |
| B | 6534 | 55 | 0.841751% |
| C | 6534 | 16 | 0.244873% |
| D | 6534 | 579 | 8.861341% |
Noise dominated data is calculated using 1-second bins in cleaned event files. If a bin has >2000 counts, and if more than 50% of those come from <1% of pixels, then it is considered to be noise-dominated and hence unusable.
| Quadrant | # 1 sec bins | Bins with >0 counts | Bins with >2000 counts | High rate bins dominated by noise | Noise dominated (total time) | Noise dominated (detector-on time) | Marked lightcurve |
|---|---|---|---|---|---|---|---|
| A | 7683 | 6534 | 48 | 48 | 0.62% | 0.73% | 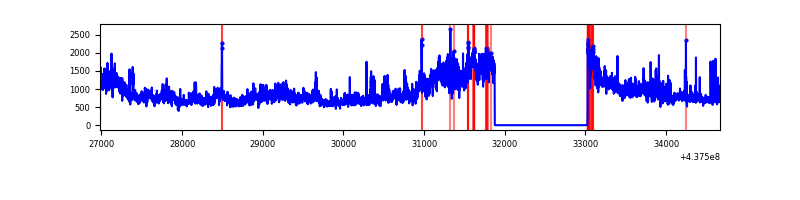 |
| B | 7684 | 6535 | 19 | 19 | 0.25% | 0.29% | 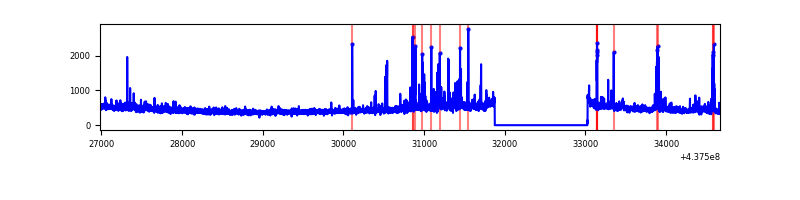 |
| C | 7684 | 6535 | 13 | 13 | 0.17% | 0.20% | 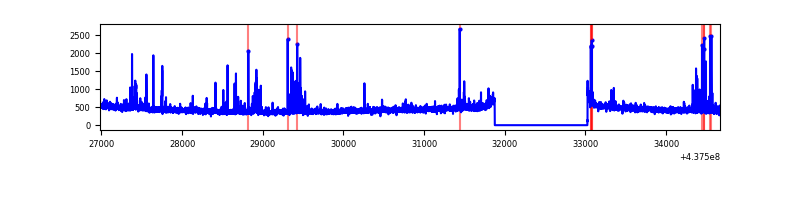 |
| D | 7684 | 6535 | 615 | 615 | 8.00% | 9.41% | 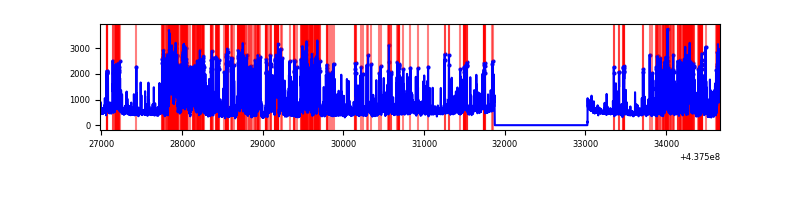 |
Top three noisy pixels from each quadrant. If the there are fewer than three noisy pixels in the level2.evt file, extra rows are filled as -1
| Pixel properties | Quadrant properties | ||||||
|---|---|---|---|---|---|---|---|
| Quadrant | DetID | PixID | Counts | Sigma | Mean | Median | Sigma |
| A | 15 | 222 | 2161052 | 14947.28 | 702 | 690 | 144.5 |
| A | 10 | 83 | 1071691 | 7410.12 | 702 | 690 | 144.5 |
| A | 13 | 248 | 40552 | 275.8 | 702 | 690 | 144.5 |
| B | 0 | 213 | 117182 | 847.09 | 713 | 693 | 137.5 |
| B | 5 | 172 | 76477 | 551.09 | 713 | 693 | 137.5 |
| B | 0 | 200 | 67572 | 486.34 | 713 | 693 | 137.5 |
| C | 14 | 254 | 158157 | 964.23 | 700 | 704 | 163.3 |
| C | 3 | 233 | 46537 | 280.68 | 700 | 704 | 163.3 |
| C | 1 | 241 | 17752 | 104.4 | 700 | 704 | 163.3 |
| D | 12 | 17 | 1300250 | 7748.56 | 668 | 645 | 167.7 |
| D | 1 | 52 | 506220 | 3014.36 | 668 | 645 | 167.7 |
| D | 5 | 235 | 284016 | 1689.53 | 668 | 645 | 167.7 |
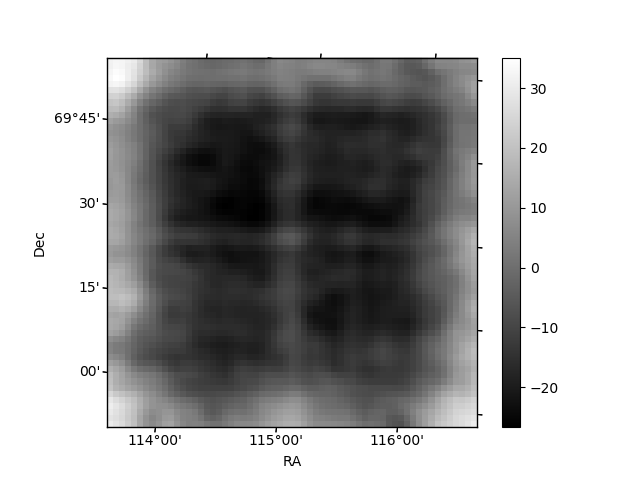
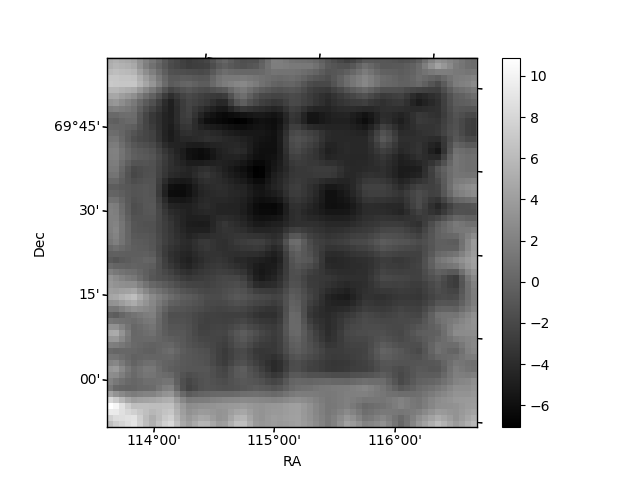
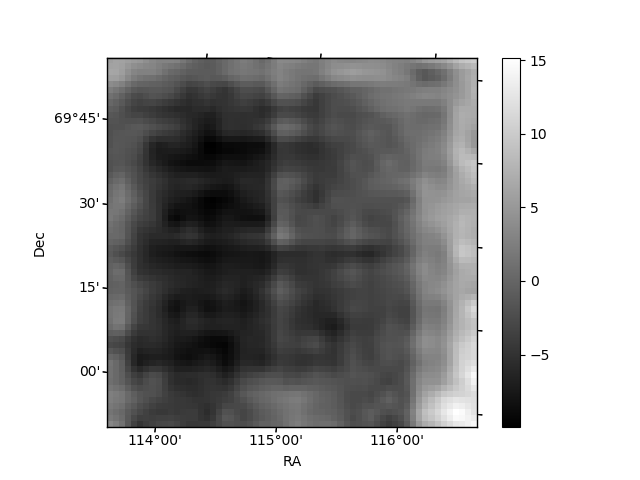
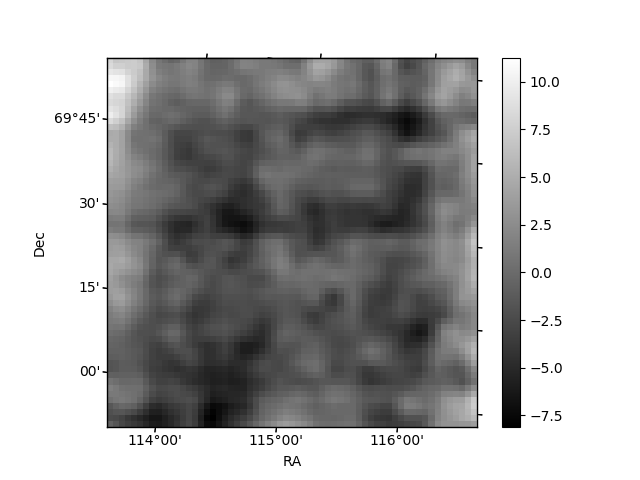
Histogram calculated using DETX and DETY for each event in the final _common_clean file
| Quadrant A | 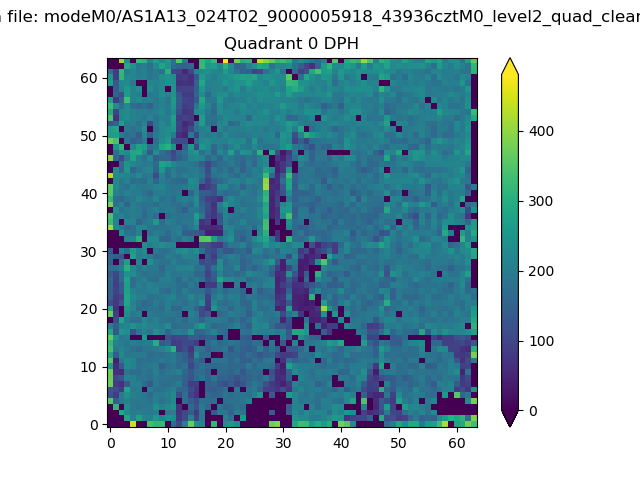 |
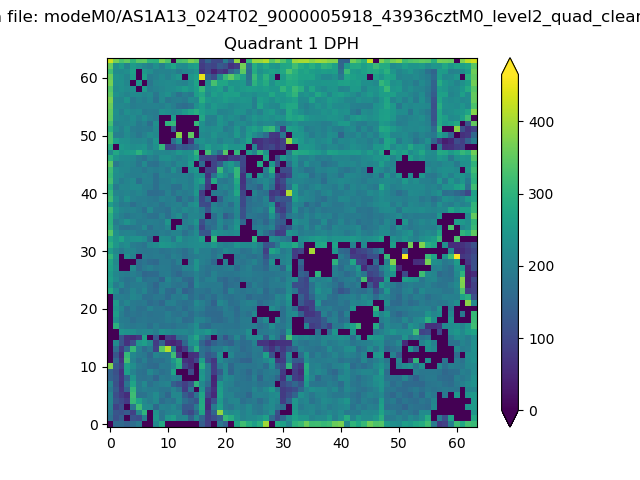 |
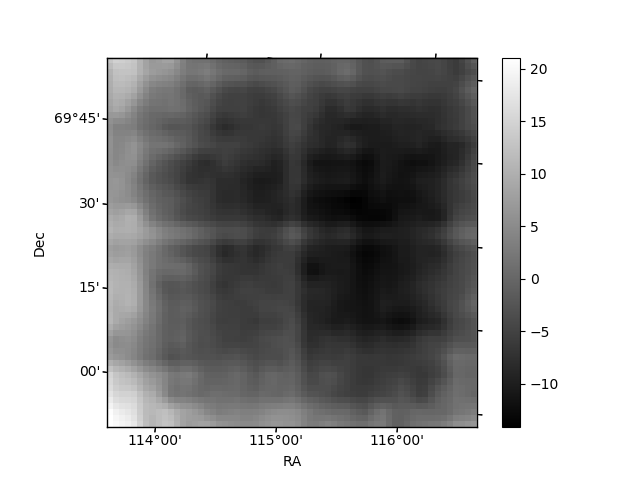
Quadrant B |
|---|---|---|---|
| Quadrant D | 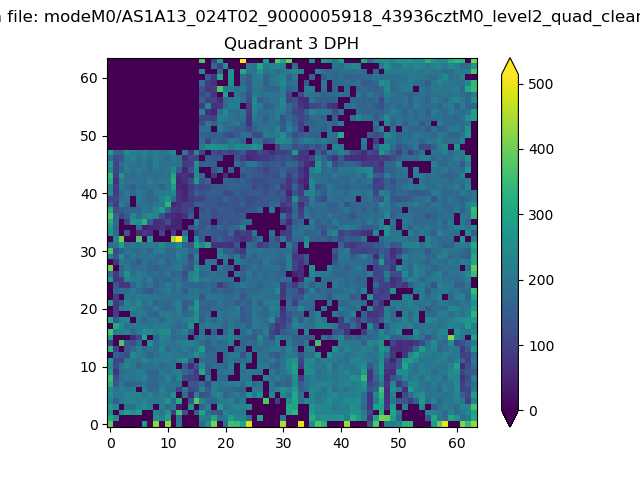 |
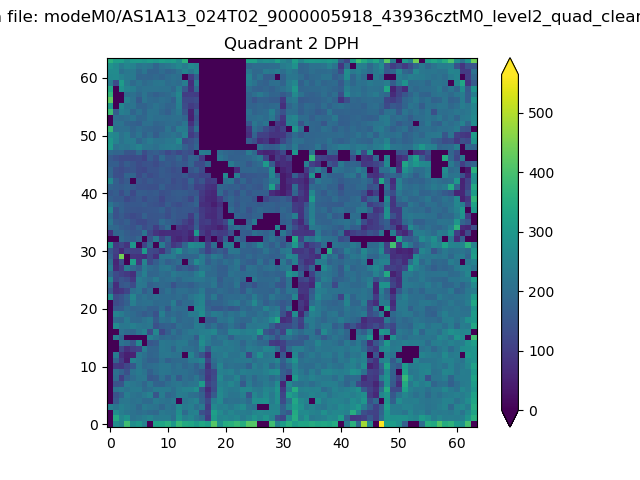 |
Quadrant C |
| Plot type | Count rate plots | Images |
|---|---|---|
| Comparison with Poisson distribution Blue bars denote a histogram of data divided into 1 sec bins. Red curve is a Poisson curve with rate = median count rate of data. |
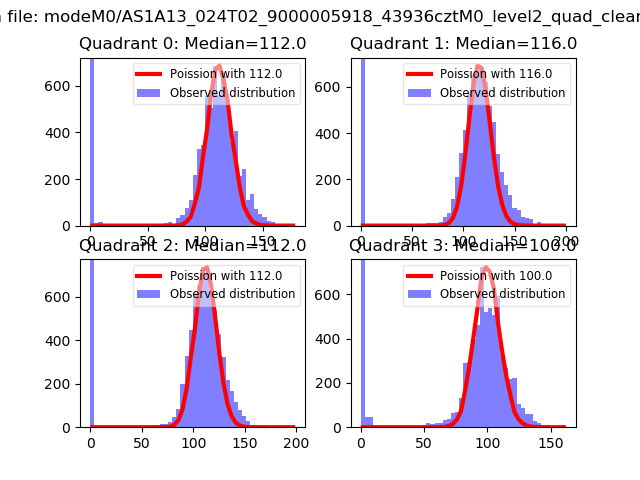 |
 |
| Quadrant-wise count rates Data is divided into 100 sec bins |
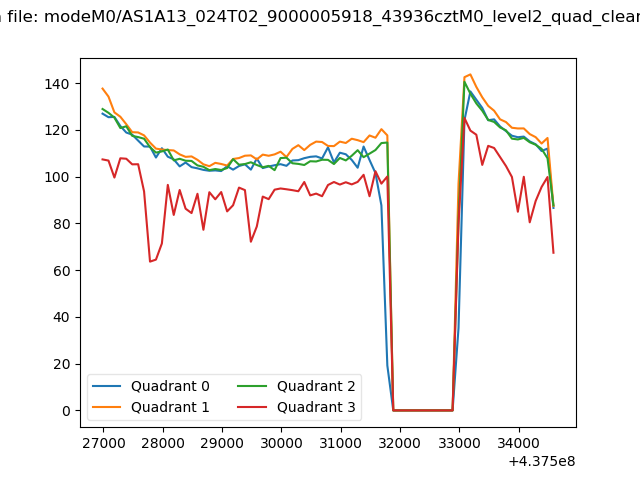 |
|
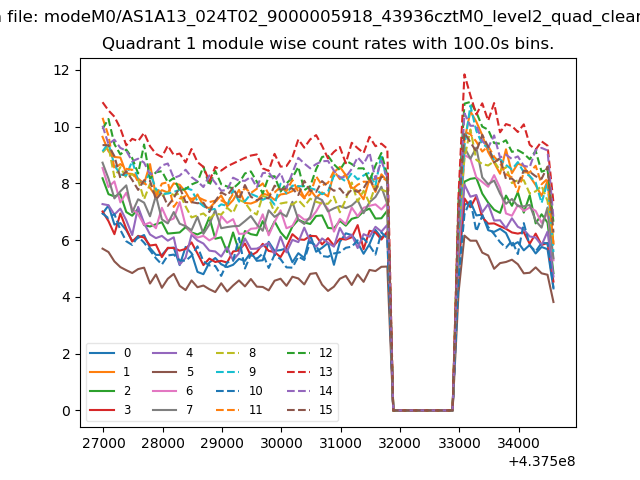
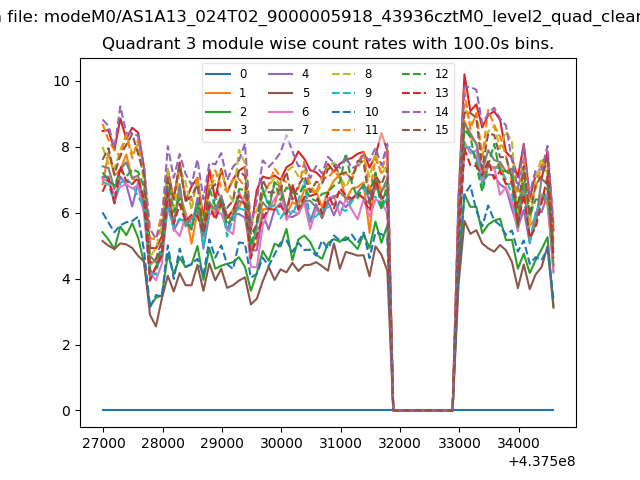
| Module-wise count rates for Quadrant A Data is divided into 100 sec bins |
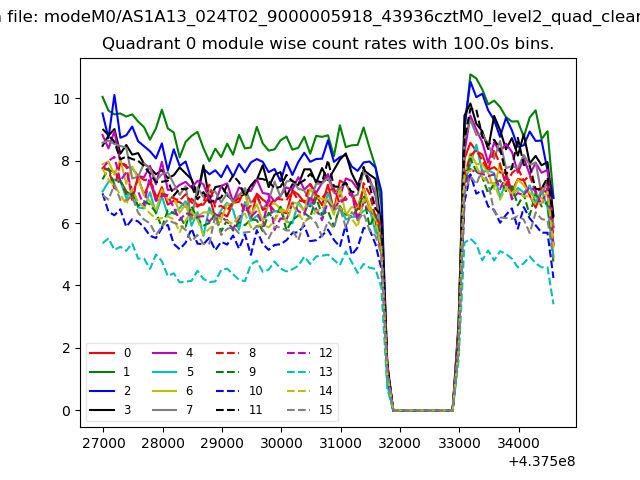 |
 |
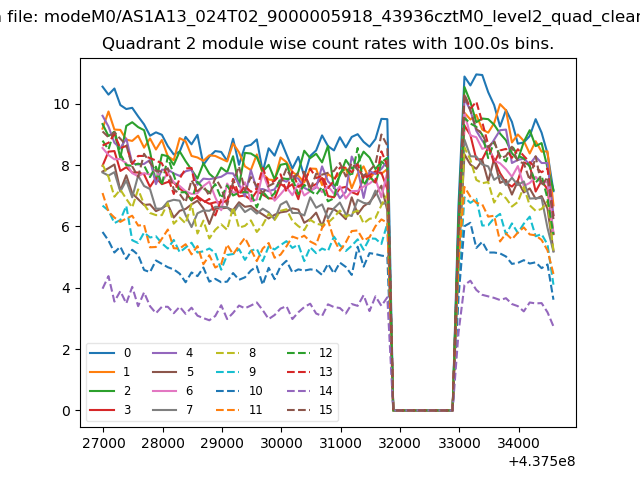
| Module-wise count rates for Quadrant B Data is divided into 100 sec bins |
 |
 |
| Module-wise count rates for Quadrant C Data is divided into 100 sec bins |
 |
 |
| Module-wise count rates for Quadrant D Data is divided into 100 sec bins |
 |
 |
| Parameter | Plot |
|---|---|
| CZT HV Monitor | 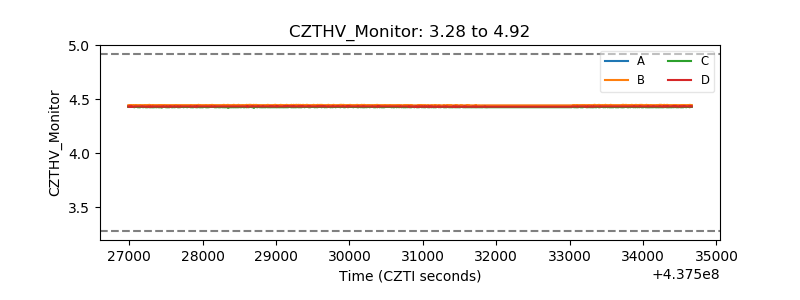 |
| D_VDD | 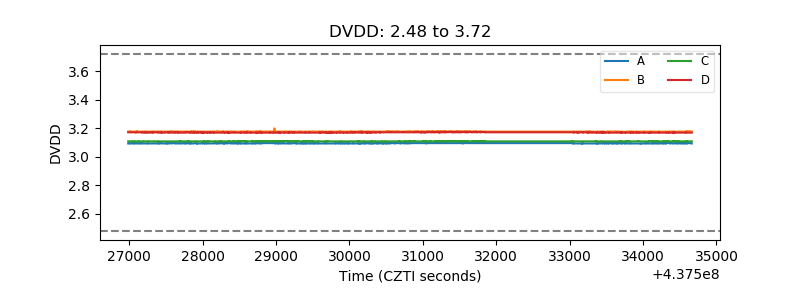 |
| Temperature 1 | 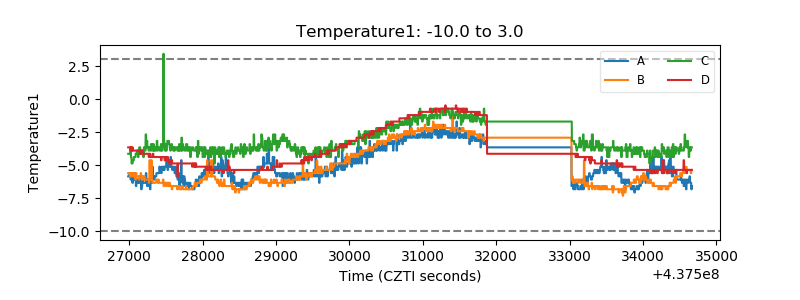 |
| Veto HV Monitor | 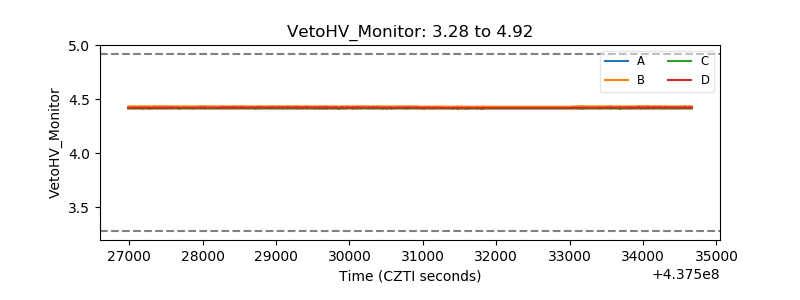 |
| Veto LLD | 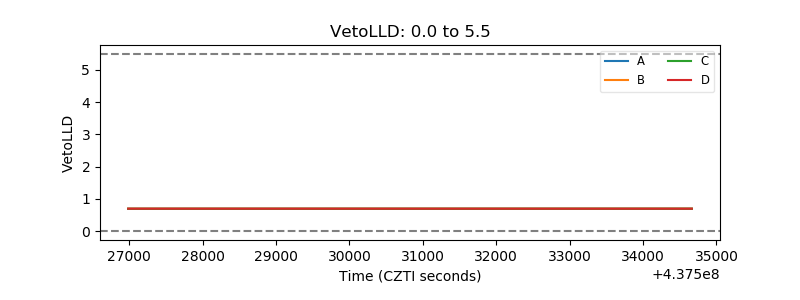 |
| Alpha Counter | 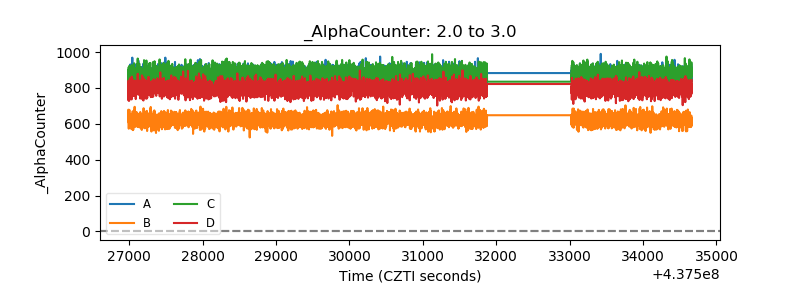 |
| _CPM_Rate | 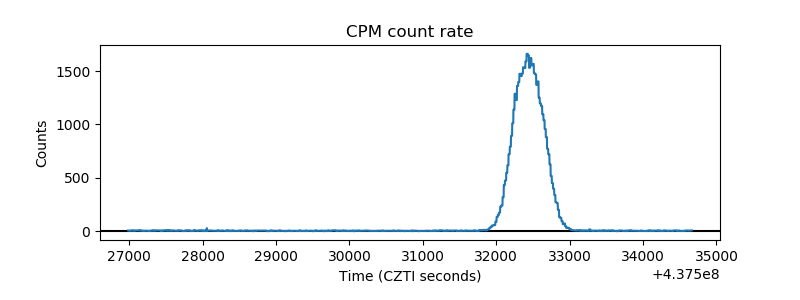 |
| CZT Counter | 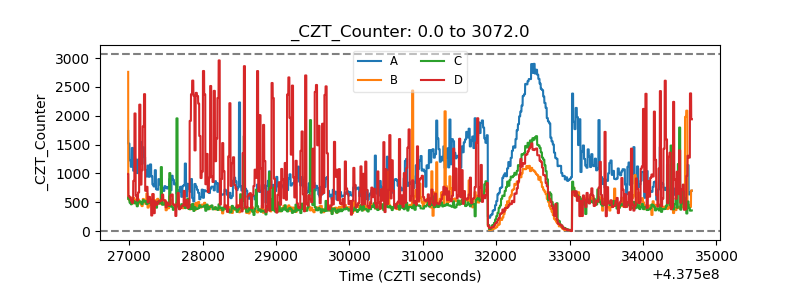 |
| +2.5 Volts monitor | 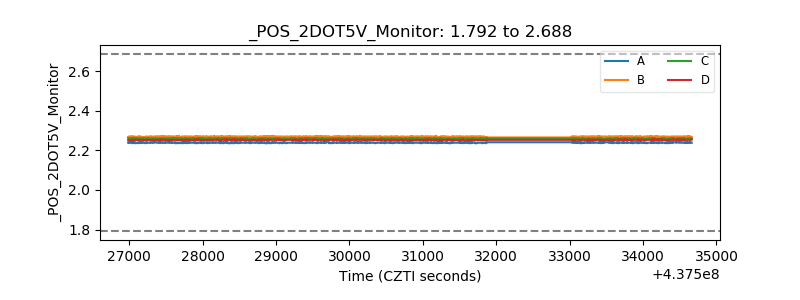 |
| +5 Volts monitor | 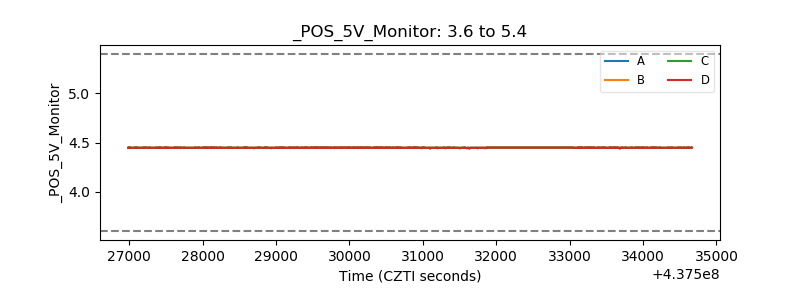 |
| _ROLL_ROT | 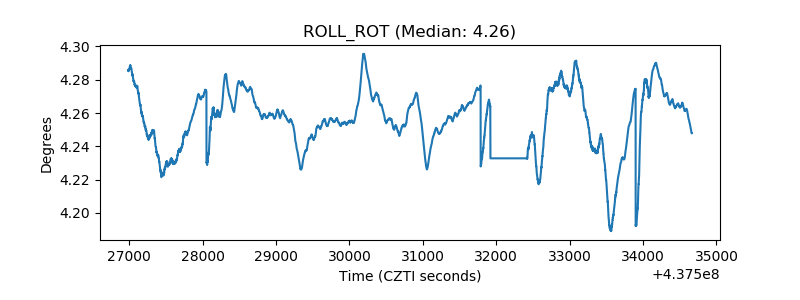 |
| _Roll_DEC | 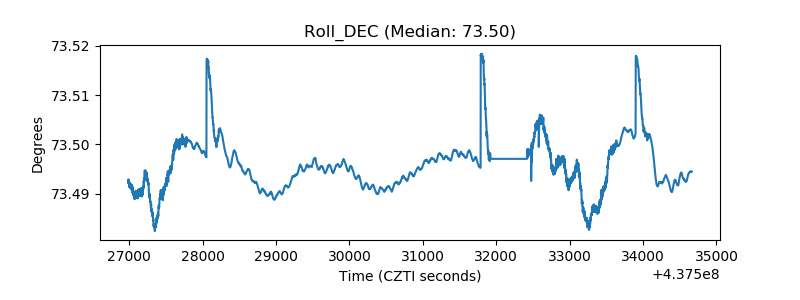 |
| _Roll_RA | 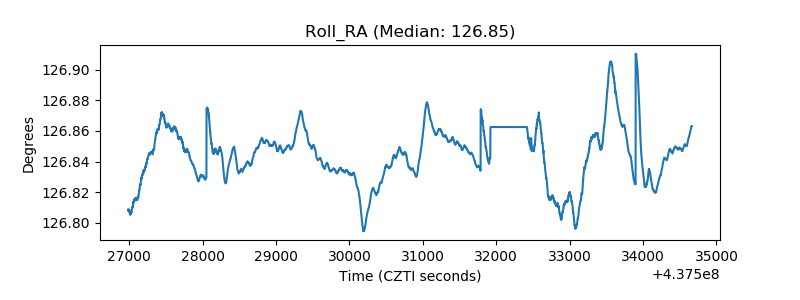 |
| Veto Counter | 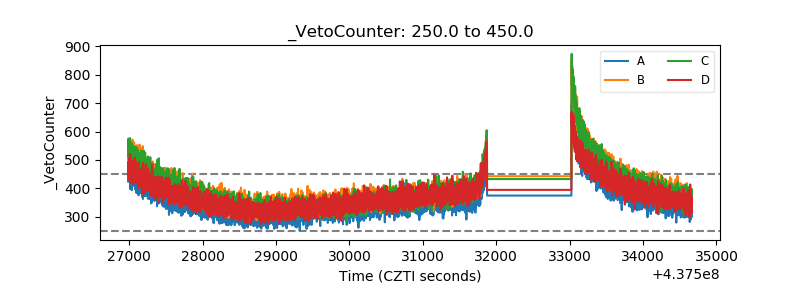 |