| Param | Original file | Final file |
|---|---|---|
| Filename | modeM0/AS1A13_024T02_9000005918_43937cztM0_level2.fits | modeM0/AS1A13_024T02_9000005918_43937cztM0_level2_quad_clean.evt |
| Size (bytes) | 529,453,440 | 111,254,400 |
| Size | 504.9 MB | 106.1 MB |
| Events in quadrant A | 7,392,718 | 724,594 |
| Events in quadrant B | 3,366,508 | 791,242 |
| Events in quadrant C | 3,146,152 | 752,448 |
| Events in quadrant D | 5,186,264 | 644,491 |
| Mode M0 | |||
|---|---|---|---|
| Quadrant | BADHDUFLAG | Total packets | Discarded packets |
| A | 0 | 26677 | 2 |
| B | 0 | 14482 | 2 |
| C | 0 | 14016 | 2 |
| D | 0 | 19825 | 2 |
| Mode SS | |||
|---|---|---|---|
| Quadrant | BADHDUFLAG | Total packets | Discarded packets |
| A | 0 | 132 | 0 |
| B | 0 | 132 | 0 |
| C | 0 | 132 | 0 |
| D | 0 | 132 | 0 |
| Mode M9 | |||
|---|---|---|---|
| Quadrant | BADHDUFLAG | Total packets | Discarded packets |
| A | 0 | 18 | 0 |
| B | 0 | 19 | 0 |
| C | 0 | 19 | 0 |
| D | 0 | 19 | 0 |
| Quadrant | Total seconds | Saturated seconds | Saturation percentage |
|---|---|---|---|
| A | 6541 | 484 | 7.399480% |
| B | 6541 | 75 | 1.146614% |
| C | 6541 | 33 | 0.504510% |
| D | 6541 | 462 | 7.063140% |
Noise dominated data is calculated using 1-second bins in cleaned event files. If a bin has >2000 counts, and if more than 50% of those come from <1% of pixels, then it is considered to be noise-dominated and hence unusable.
| Quadrant | # 1 sec bins | Bins with >0 counts | Bins with >2000 counts | High rate bins dominated by noise | Noise dominated (total time) | Noise dominated (detector-on time) | Marked lightcurve |
|---|---|---|---|---|---|---|---|
| A | 7771 | 6542 | 180 | 180 | 2.32% | 2.75% | 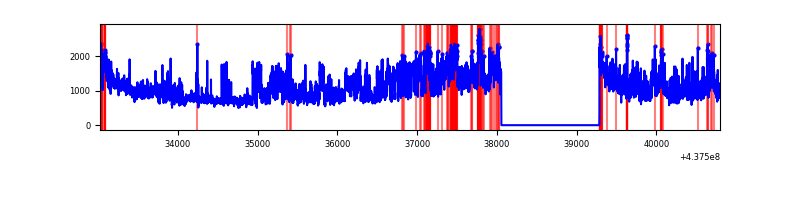 |
| B | 7771 | 6542 | 26 | 26 | 0.33% | 0.40% | 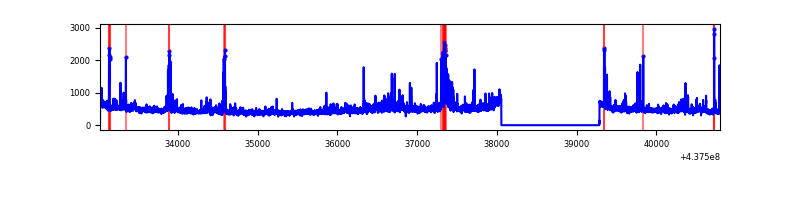 |
| C | 7771 | 6542 | 17 | 17 | 0.22% | 0.26% | 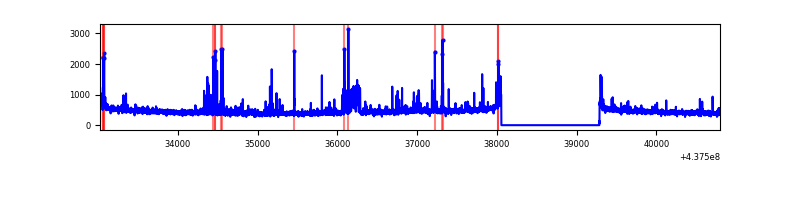 |
| D | 7771 | 6542 | 489 | 489 | 6.29% | 7.47% | 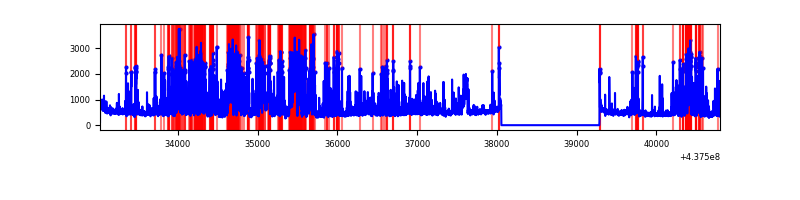 |
Top three noisy pixels from each quadrant. If the there are fewer than three noisy pixels in the level2.evt file, extra rows are filled as -1
| Pixel properties | Quadrant properties | ||||||
|---|---|---|---|---|---|---|---|
| Quadrant | DetID | PixID | Counts | Sigma | Mean | Median | Sigma |
| A | 15 | 222 | 3172718 | 21656.54 | 716 | 704 | 146.5 |
| A | 10 | 83 | 1189711 | 8117.8 | 716 | 704 | 146.5 |
| A | 15 | 223 | 152024 | 1033.12 | 716 | 704 | 146.5 |
| B | 0 | 200 | 181088 | 1281.91 | 731 | 708 | 140.7 |
| B | 0 | 213 | 139233 | 984.46 | 731 | 708 | 140.7 |
| B | 5 | 172 | 66461 | 467.29 | 731 | 708 | 140.7 |
| C | 14 | 254 | 109462 | 654.79 | 713 | 717 | 166.1 |
| C | 12 | 16 | 91412 | 546.11 | 713 | 717 | 166.1 |
| C | 15 | 157 | 89493 | 534.55 | 713 | 717 | 166.1 |
| D | 12 | 17 | 1320236 | 7660.05 | 686 | 666 | 172.3 |
| D | 13 | 249 | 530065 | 3073.14 | 686 | 666 | 172.3 |
| D | 1 | 52 | 131481 | 759.38 | 686 | 666 | 172.3 |
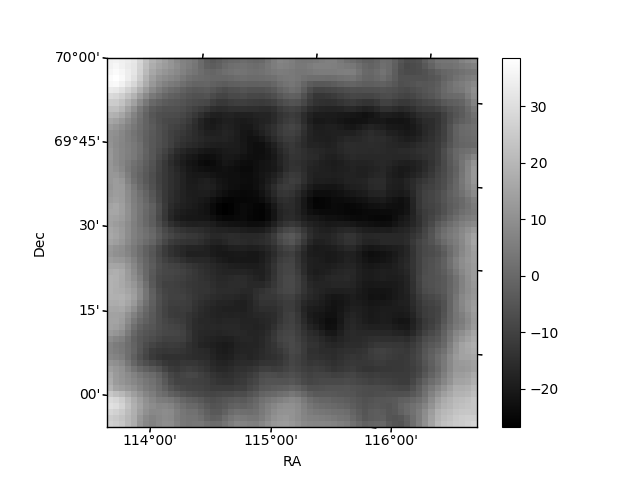
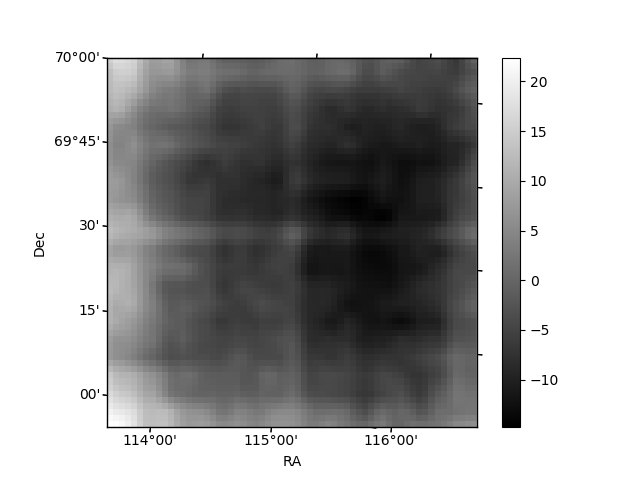
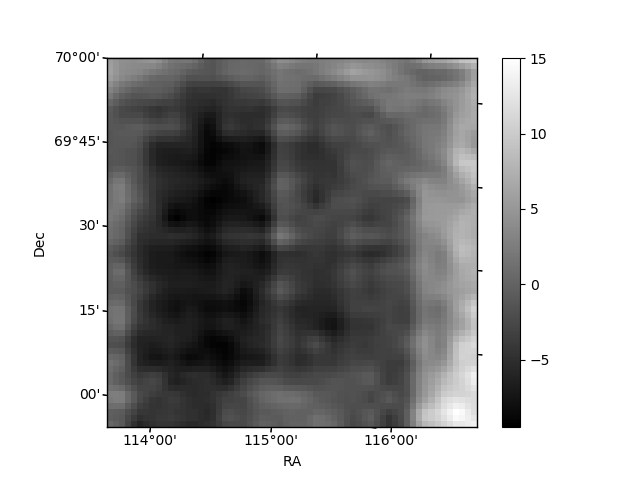
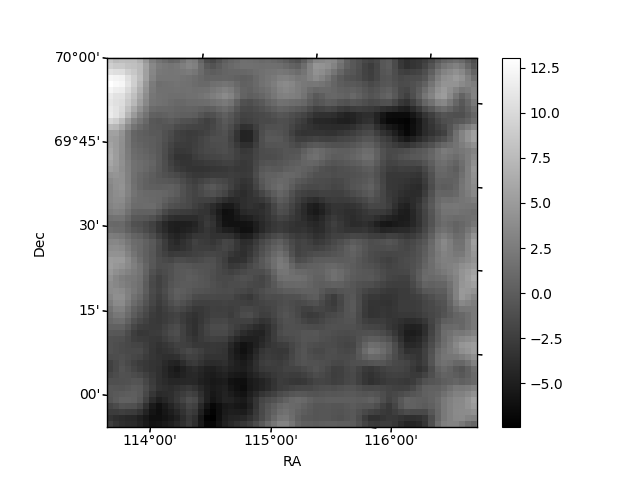
Histogram calculated using DETX and DETY for each event in the final _common_clean file
| Quadrant A | 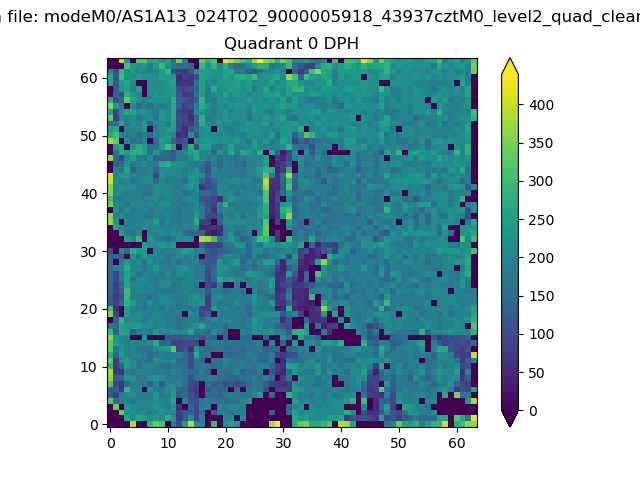 |
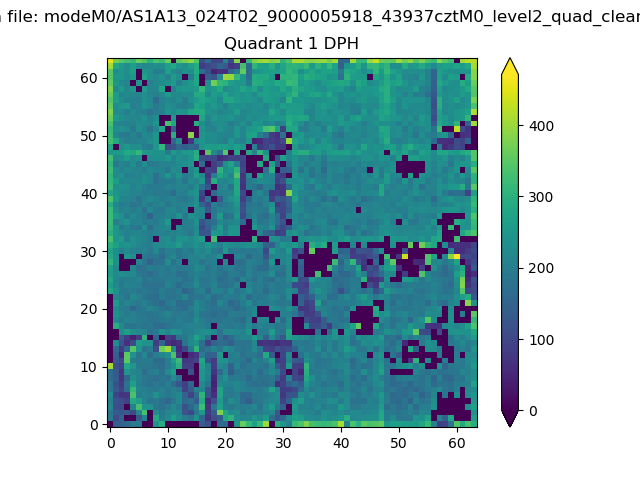 |
Quadrant B |
|---|---|---|---|
| Quadrant D | 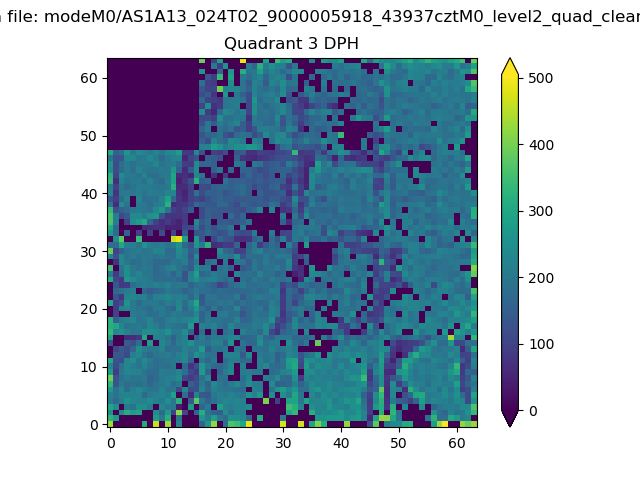 |
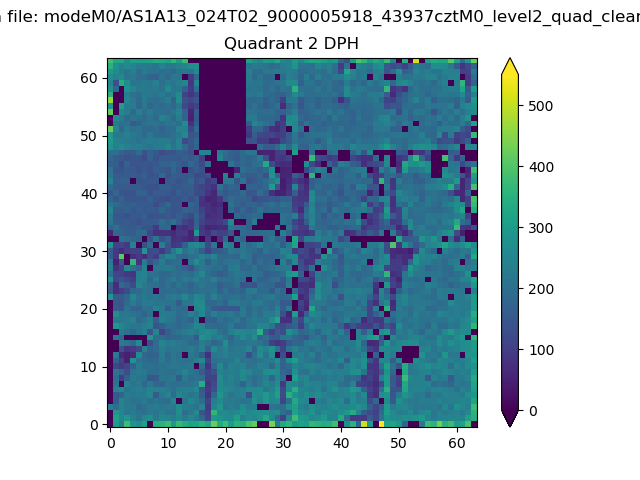 |
Quadrant C |
| Plot type | Count rate plots | Images |
|---|---|---|
| Comparison with Poisson distribution Blue bars denote a histogram of data divided into 1 sec bins. Red curve is a Poisson curve with rate = median count rate of data. |
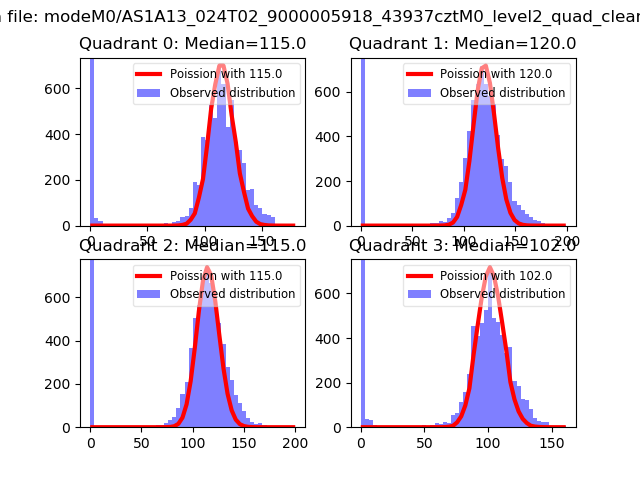 |
 |
| Quadrant-wise count rates Data is divided into 100 sec bins |
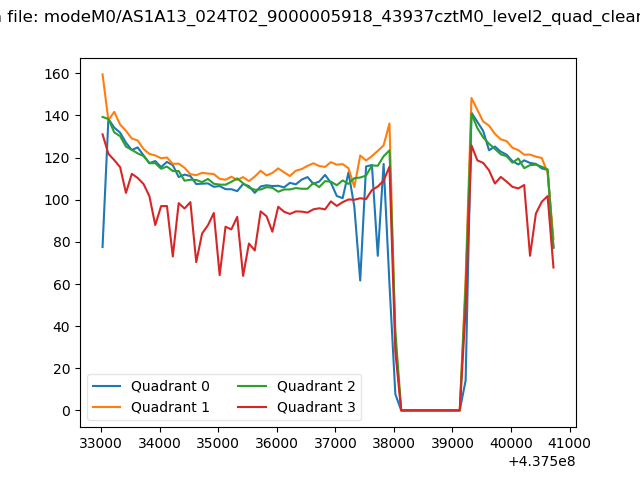 |
|
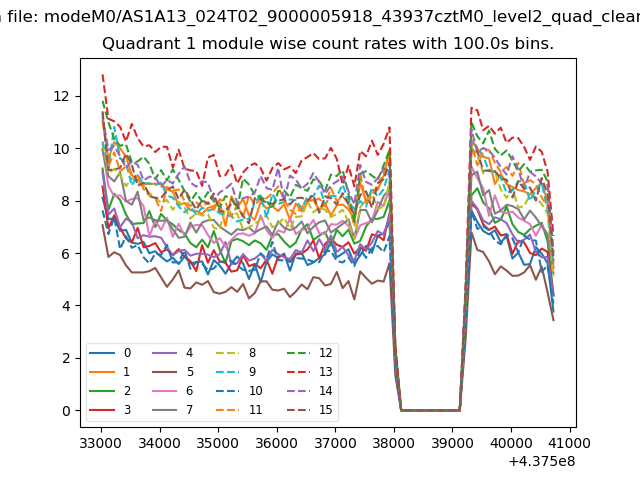
| Module-wise count rates for Quadrant A Data is divided into 100 sec bins |
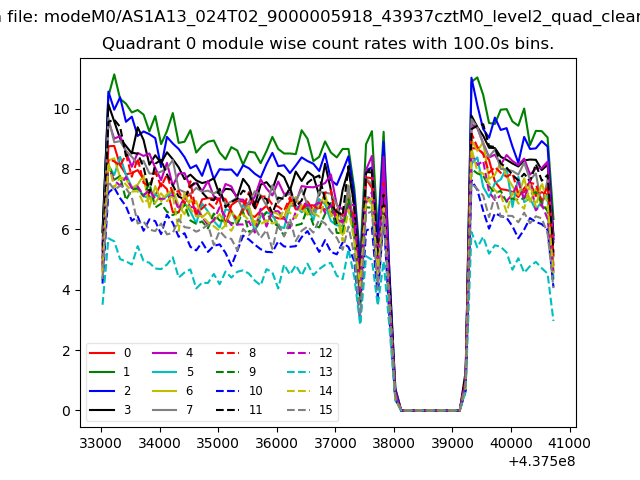 |
 |
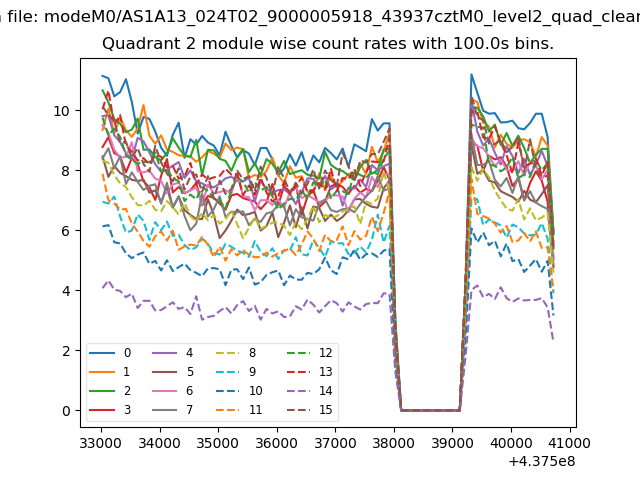
| Module-wise count rates for Quadrant B Data is divided into 100 sec bins |
 |
 |
| Module-wise count rates for Quadrant C Data is divided into 100 sec bins |
 |
 |
| Module-wise count rates for Quadrant D Data is divided into 100 sec bins |
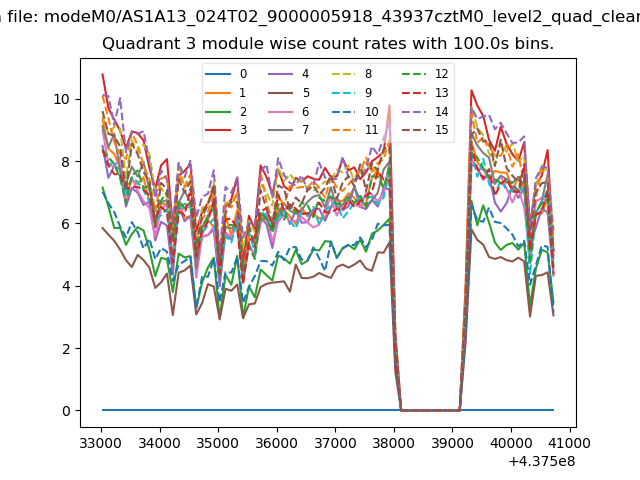 |
 |
| Parameter | Plot |
|---|---|
| CZT HV Monitor | 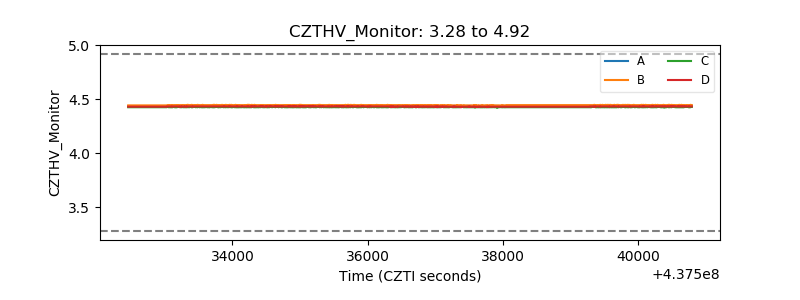 |
| D_VDD | 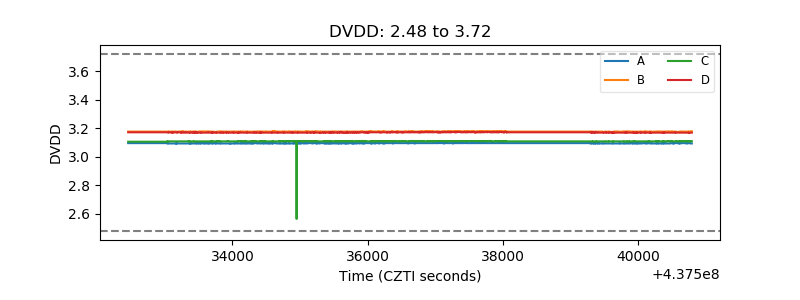 |
| Temperature 1 | 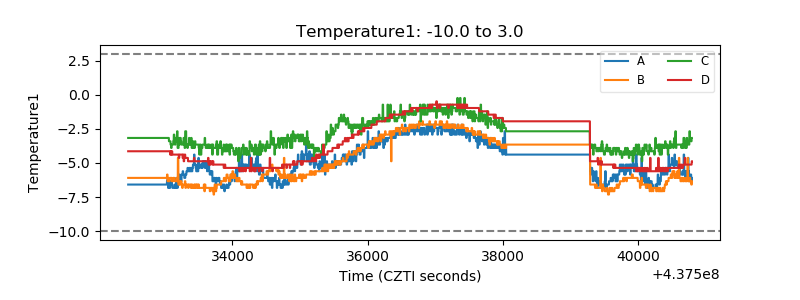 |
| Veto HV Monitor | 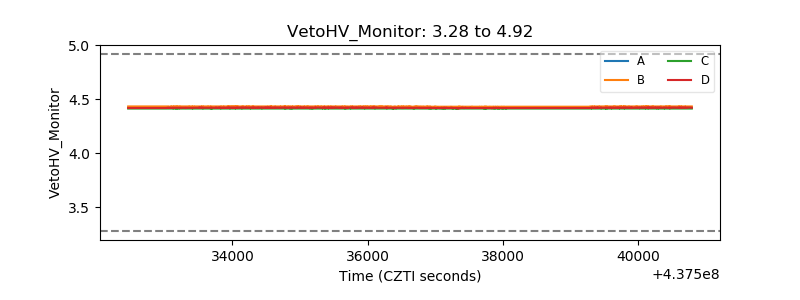 |
| Veto LLD | 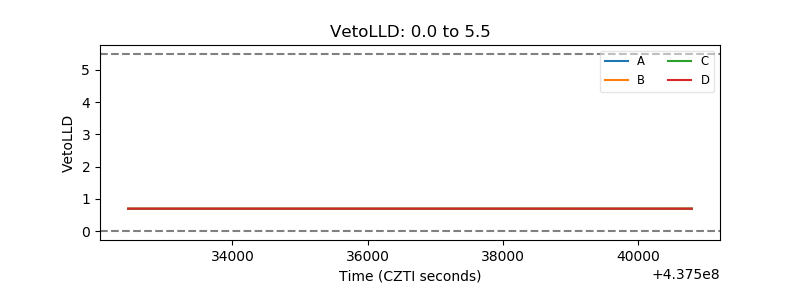 |
| Alpha Counter | 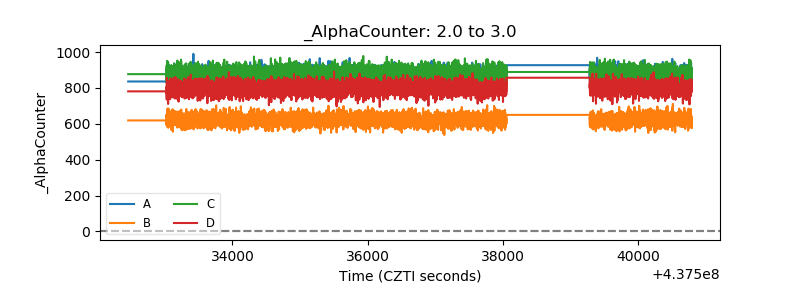 |
| _CPM_Rate | 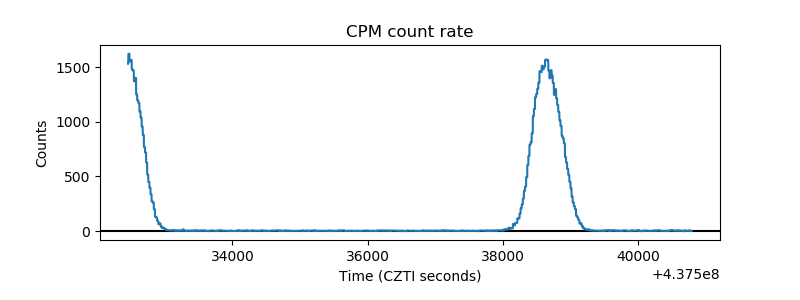 |
| CZT Counter | 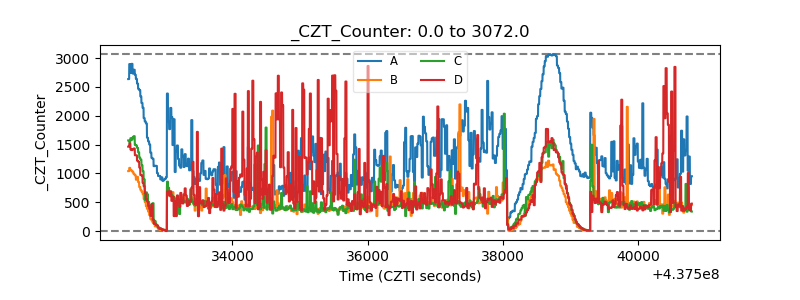 |
| +2.5 Volts monitor | 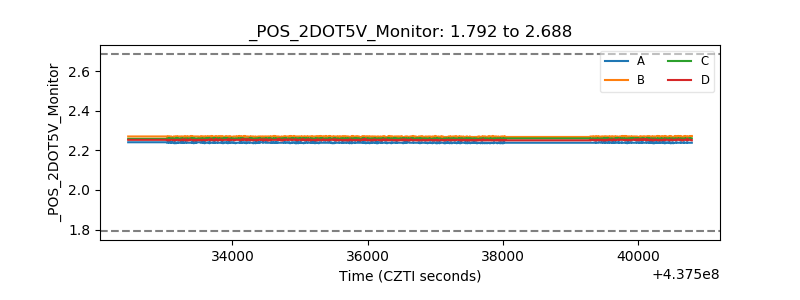 |
| +5 Volts monitor | 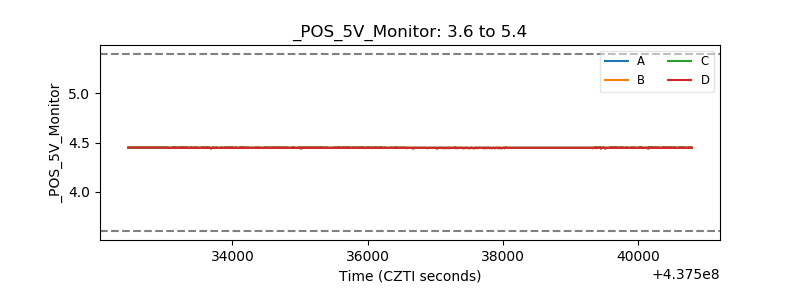 |
| _ROLL_ROT |  |
| _Roll_DEC | 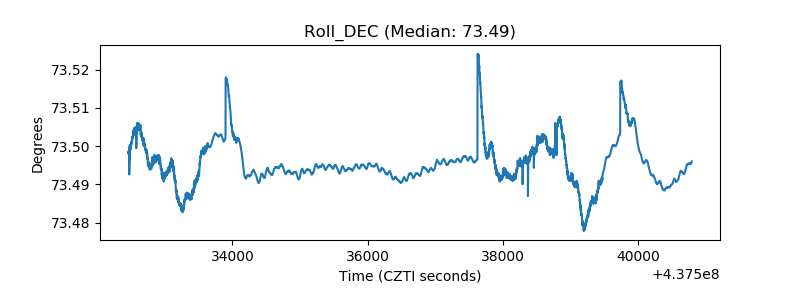 |
| _Roll_RA | 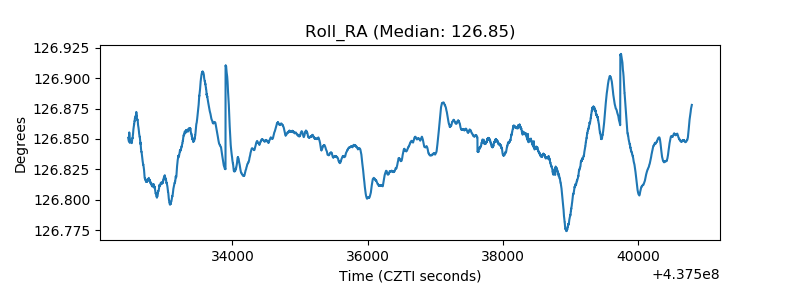 |
| Veto Counter | 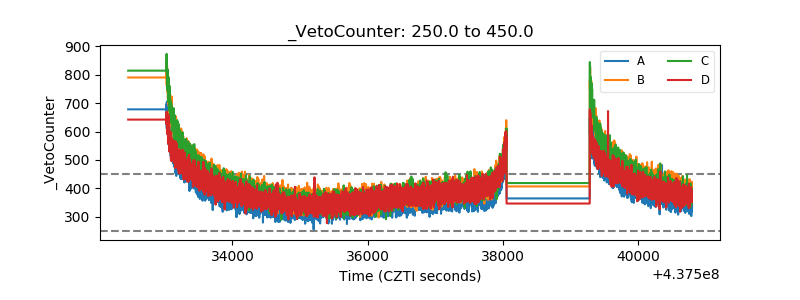 |