| Param | Original file | Final file |
|---|---|---|
| Filename | modeM0/AS1A13_024T02_9000005918_43939cztM0_level2.fits | modeM0/AS1A13_024T02_9000005918_43939cztM0_level2_quad_clean.evt |
| Size (bytes) | 474,327,360 | 94,406,400 |
| Size | 452.4 MB | 90.0 MB |
| Events in quadrant A | 6,052,538 | 619,421 |
| Events in quadrant B | 2,841,655 | 677,950 |
| Events in quadrant C | 3,025,482 | 640,020 |
| Events in quadrant D | 5,191,066 | 518,269 |
| Mode M0 | |||
|---|---|---|---|
| Quadrant | BADHDUFLAG | Total packets | Discarded packets |
| A | 0 | 23607 | 1446 |
| B | 0 | 12883 | 374 |
| C | 0 | 13749 | 552 |
| D | 0 | 20575 | 1350 |
| Mode SS | |||
|---|---|---|---|
| Quadrant | BADHDUFLAG | Total packets | Discarded packets |
| A | 0 | 119 | 1 |
| B | 0 | 121 | 2 |
| C | 0 | 122 | 1 |
| D | 0 | 122 | 1 |
| Mode M9 | |||
|---|---|---|---|
| Quadrant | BADHDUFLAG | Total packets | Discarded packets |
| A | 0 | 11 | 0 |
| B | 0 | 11 | 0 |
| C | 0 | 11 | 0 |
| D | 0 | 11 | 0 |
| Quadrant | Total seconds | Saturated seconds | Saturation percentage |
|---|---|---|---|
| A | 5698 | 417 | 7.318357% |
| B | 5842 | 102 | 1.745977% |
| C | 5810 | 98 | 1.686747% |
| D | 5673 | 664 | 11.704565% |
Noise dominated data is calculated using 1-second bins in cleaned event files. If a bin has >2000 counts, and if more than 50% of those come from <1% of pixels, then it is considered to be noise-dominated and hence unusable.
| Quadrant | # 1 sec bins | Bins with >0 counts | Bins with >2000 counts | High rate bins dominated by noise | Noise dominated (total time) | Noise dominated (detector-on time) | Marked lightcurve |
|---|---|---|---|---|---|---|---|
| A | 7169 | 5971 | 233 | 233 | 3.25% | 3.90% | 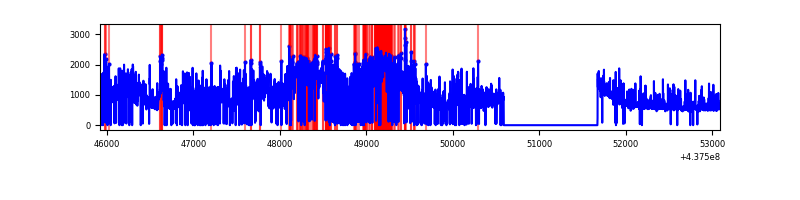 |
| B | 7168 | 6011 | 23 | 23 | 0.32% | 0.38% | 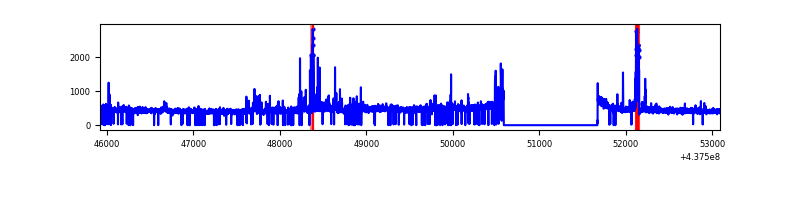 |
| C | 7170 | 6003 | 70 | 70 | 0.98% | 1.17% | 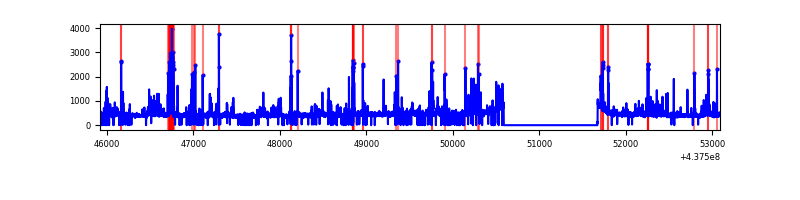 |
| D | 7170 | 5969 | 671 | 671 | 9.36% | 11.24% | 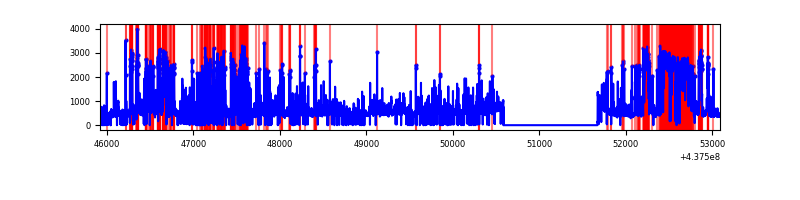 |
Top three noisy pixels from each quadrant. If the there are fewer than three noisy pixels in the level2.evt file, extra rows are filled as -1
| Pixel properties | Quadrant properties | ||||||
|---|---|---|---|---|---|---|---|
| Quadrant | DetID | PixID | Counts | Sigma | Mean | Median | Sigma |
| A | 15 | 222 | 2223289 | 17450.76 | 623 | 610 | 127.4 |
| A | 10 | 83 | 938436 | 7363.08 | 623 | 610 | 127.4 |
| A | 15 | 223 | 376018 | 2947.41 | 623 | 610 | 127.4 |
| B | 5 | 172 | 99977 | 813.53 | 640 | 623 | 122.1 |
| B | 0 | 200 | 75462 | 612.8 | 640 | 623 | 122.1 |
| B | 0 | 213 | 66359 | 538.26 | 640 | 623 | 122.1 |
| C | 14 | 254 | 281659 | 1964.94 | 615 | 617 | 143.0 |
| C | 1 | 241 | 268179 | 1870.69 | 615 | 617 | 143.0 |
| C | 15 | 157 | 44158 | 304.42 | 615 | 617 | 143.0 |
| D | 5 | 235 | 1383552 | 9453.52 | 581 | 561 | 146.3 |
| D | 13 | 249 | 802854 | 5484.12 | 581 | 561 | 146.3 |
| D | 1 | 52 | 364018 | 2484.43 | 581 | 561 | 146.3 |
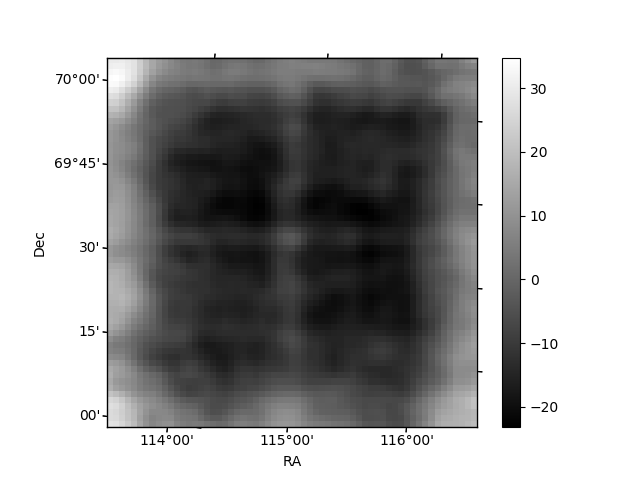
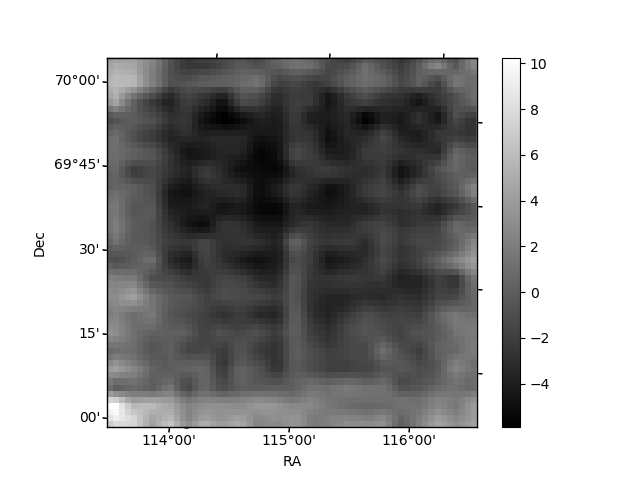
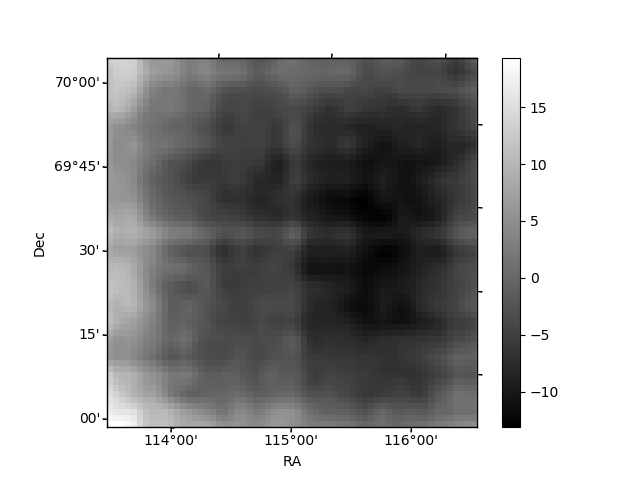
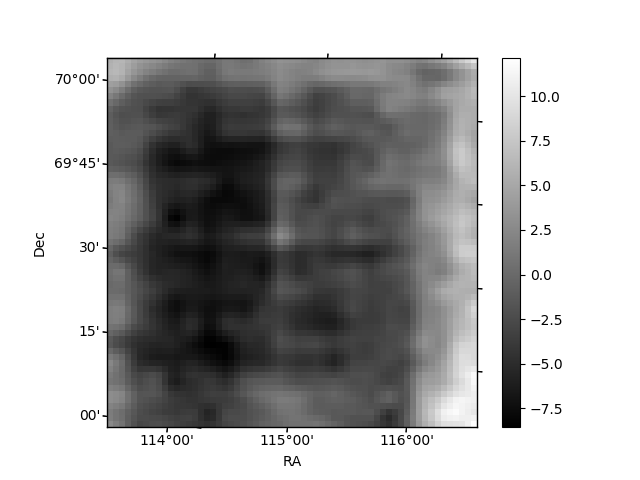
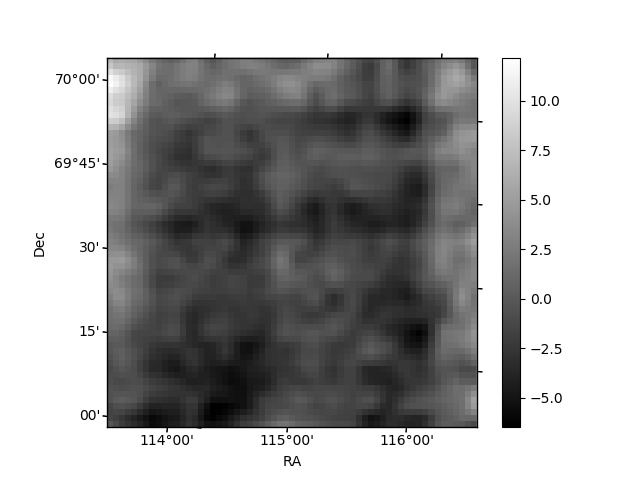
Histogram calculated using DETX and DETY for each event in the final _common_clean file
| Quadrant A | 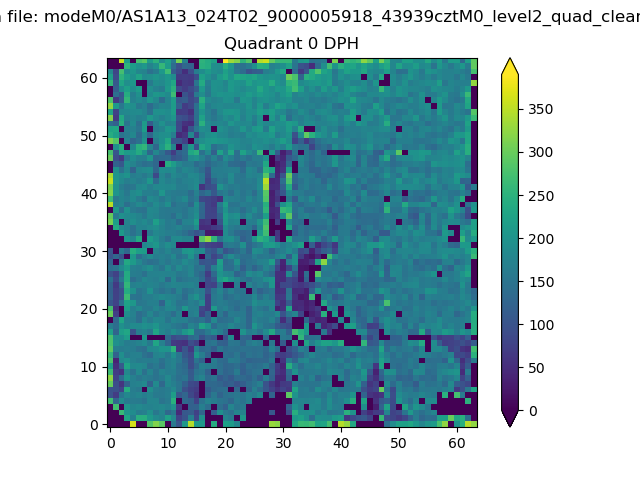 |
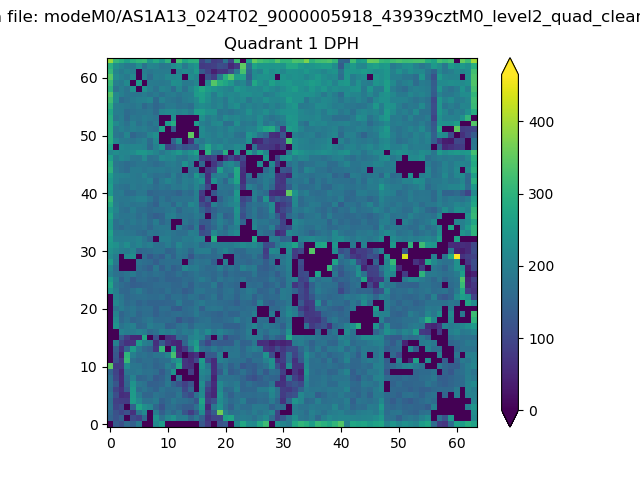 |
Quadrant B |
|---|---|---|---|
| Quadrant D | 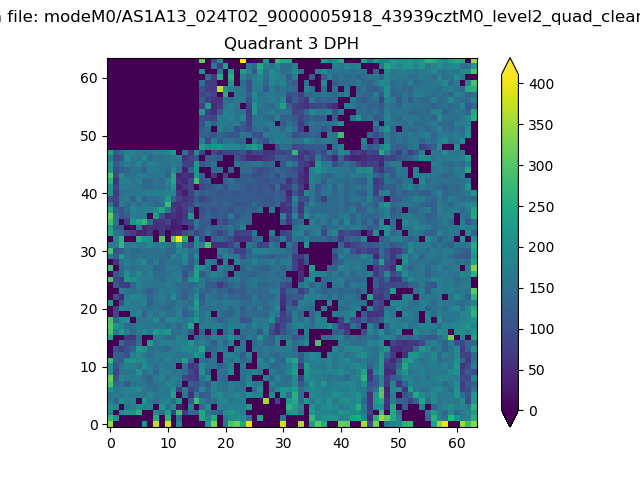 |
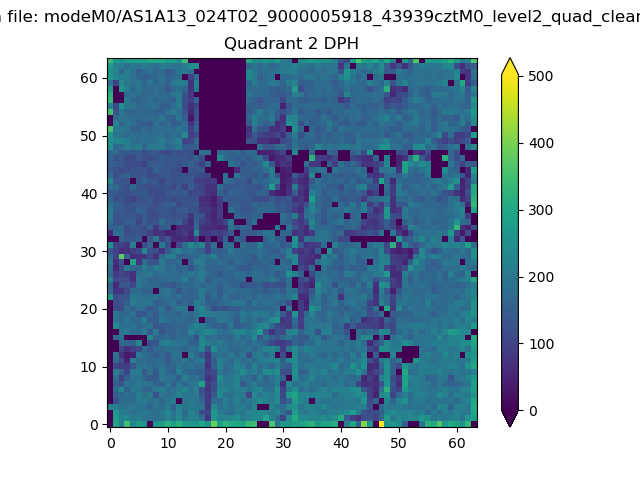 |
Quadrant C |
| Plot type | Count rate plots | Images |
|---|---|---|
| Comparison with Poisson distribution Blue bars denote a histogram of data divided into 1 sec bins. Red curve is a Poisson curve with rate = median count rate of data. |
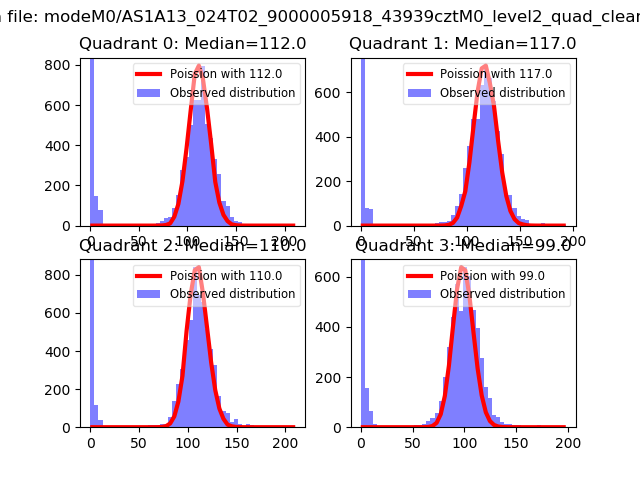 |
 |
| Quadrant-wise count rates Data is divided into 100 sec bins |
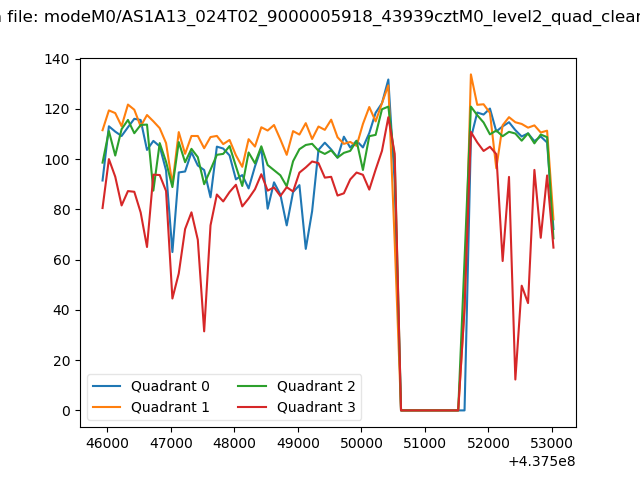 |
|
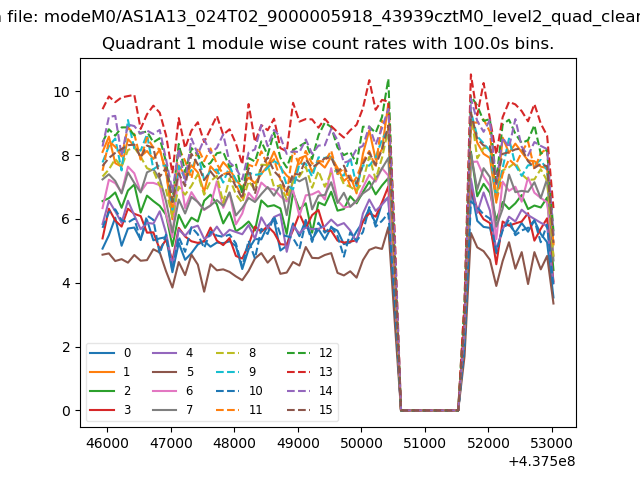
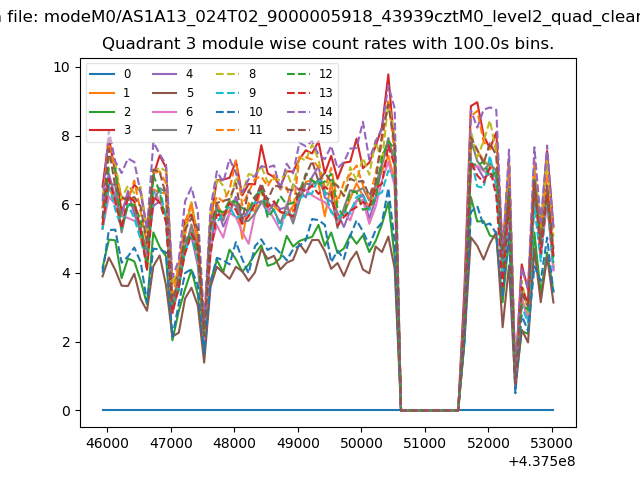
| Module-wise count rates for Quadrant A Data is divided into 100 sec bins |
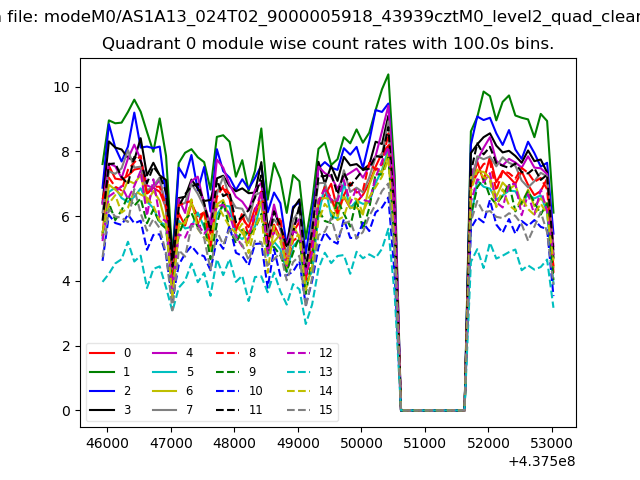 |
 |
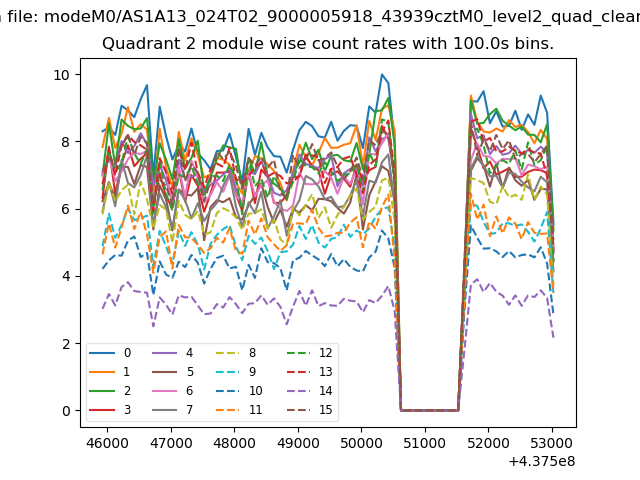
| Module-wise count rates for Quadrant B Data is divided into 100 sec bins |
 |
 |
| Module-wise count rates for Quadrant C Data is divided into 100 sec bins |
 |
 |
| Module-wise count rates for Quadrant D Data is divided into 100 sec bins |
 |
 |
| Parameter | Plot |
|---|---|
| CZT HV Monitor | 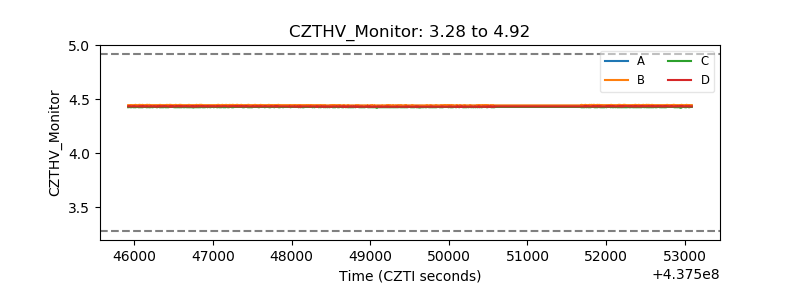 |
| D_VDD | 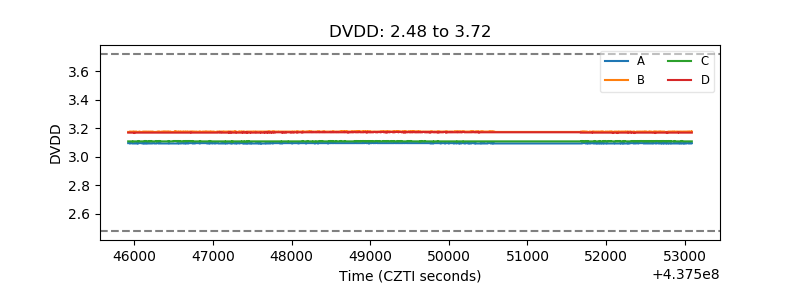 |
| Temperature 1 | 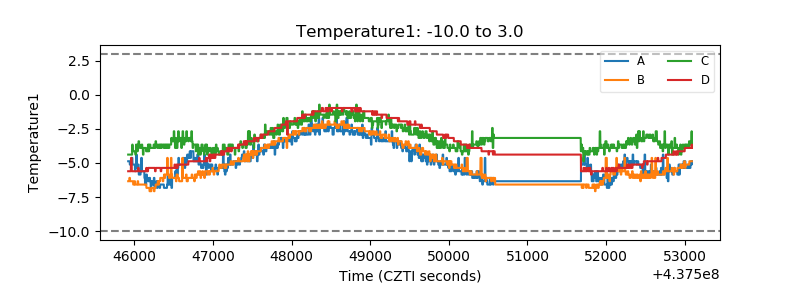 |
| Veto HV Monitor | 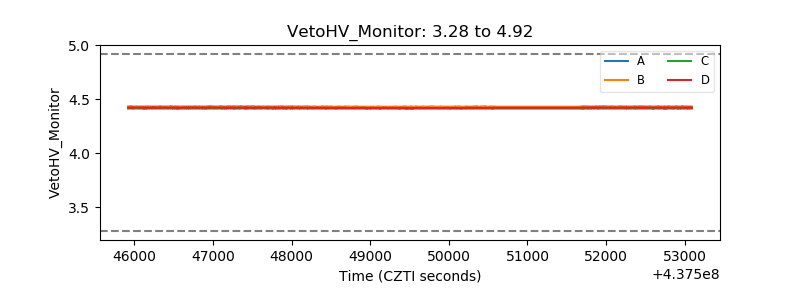 |
| Veto LLD | 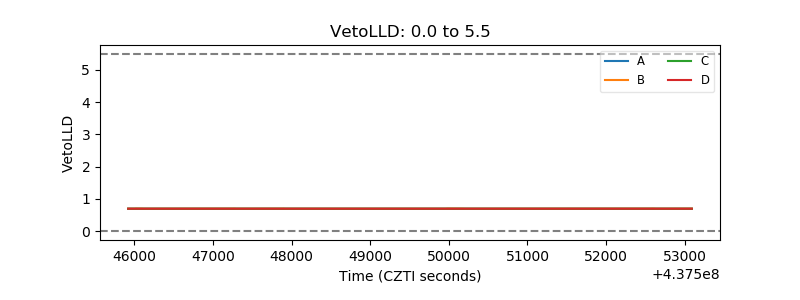 |
| Alpha Counter | 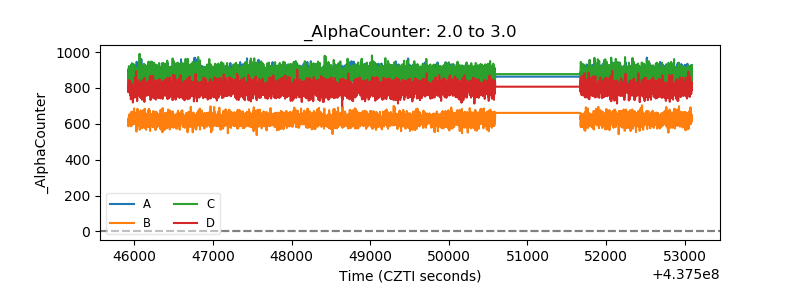 |
| _CPM_Rate | 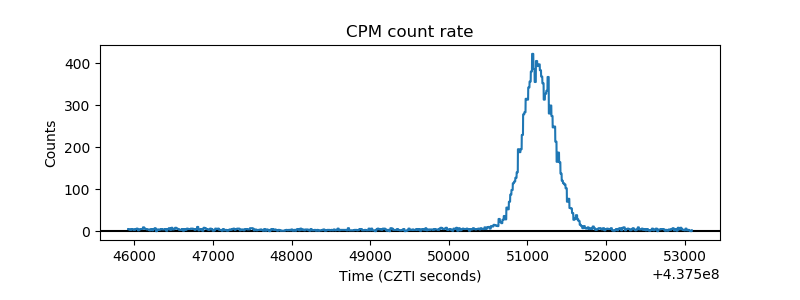 |
| CZT Counter | 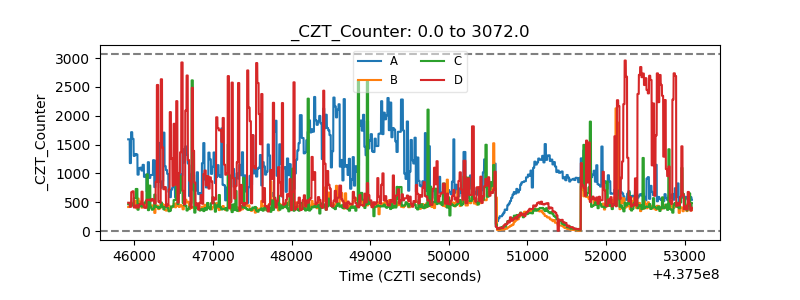 |
| +2.5 Volts monitor | 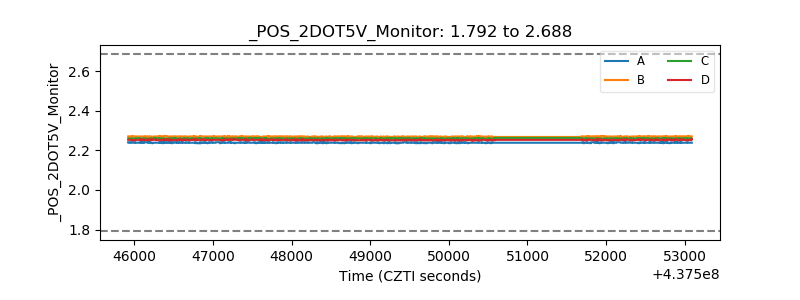 |
| +5 Volts monitor | 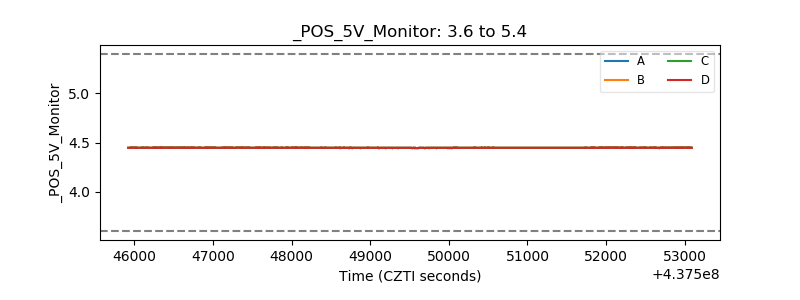 |
| _ROLL_ROT | 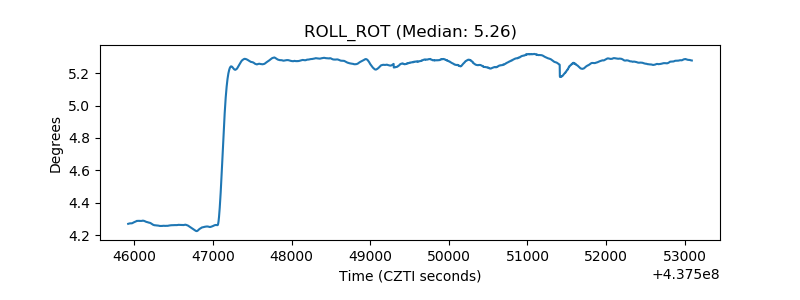 |
| _Roll_DEC | 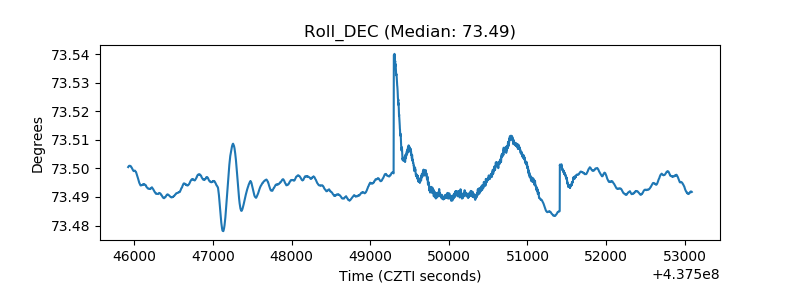 |
| _Roll_RA | 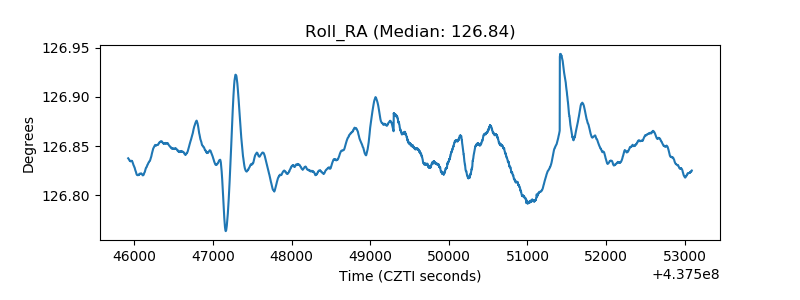 |
| Veto Counter | 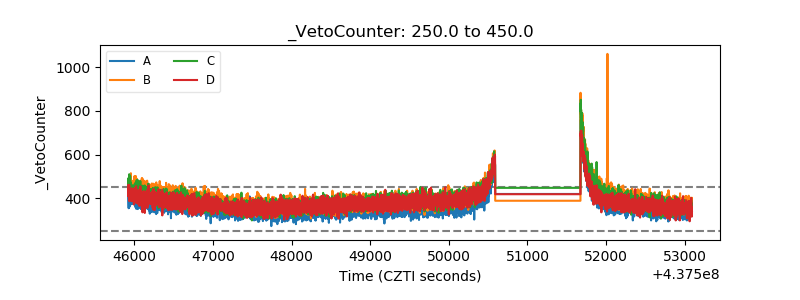 |