| Param | Original file | Final file |
|---|---|---|
| Filename | modeM0/AS1A13_024T02_9000005918_43940cztM0_level2.fits | modeM0/AS1A13_024T02_9000005918_43940cztM0_level2_quad_clean.evt |
| Size (bytes) | 404,772,480 | 88,718,400 |
| Size | 386.0 MB | 84.6 MB |
| Events in quadrant A | 4,448,900 | 591,424 |
| Events in quadrant B | 2,962,095 | 609,787 |
| Events in quadrant C | 2,955,219 | 587,966 |
| Events in quadrant D | 4,185,887 | 509,370 |
| Mode M0 | |||
|---|---|---|---|
| Quadrant | BADHDUFLAG | Total packets | Discarded packets |
| A | 0 | 18113 | 976 |
| B | 0 | 13317 | 610 |
| C | 0 | 13730 | 936 |
| D | 0 | 17198 | 872 |
| Mode SS | |||
|---|---|---|---|
| Quadrant | BADHDUFLAG | Total packets | Discarded packets |
| A | 0 | 117 | 3 |
| B | 0 | 117 | 3 |
| C | 0 | 118 | 4 |
| D | 0 | 118 | 6 |
| Mode M9 | |||
|---|---|---|---|
| Quadrant | BADHDUFLAG | Total packets | Discarded packets |
| A | 0 | 9 | 0 |
| B | 0 | 9 | 0 |
| C | 0 | 9 | 0 |
| D | 0 | 9 | 0 |
| Quadrant | Total seconds | Saturated seconds | Saturation percentage |
|---|---|---|---|
| A | 5525 | 223 | 4.036199% |
| B | 5555 | 195 | 3.510351% |
| C | 5534 | 139 | 2.511746% |
| D | 5534 | 444 | 8.023130% |
Noise dominated data is calculated using 1-second bins in cleaned event files. If a bin has >2000 counts, and if more than 50% of those come from <1% of pixels, then it is considered to be noise-dominated and hence unusable.
| Quadrant | # 1 sec bins | Bins with >0 counts | Bins with >2000 counts | High rate bins dominated by noise | Noise dominated (total time) | Noise dominated (detector-on time) | Marked lightcurve |
|---|---|---|---|---|---|---|---|
| A | 7022 | 5670 | 32 | 32 | 0.46% | 0.56% | 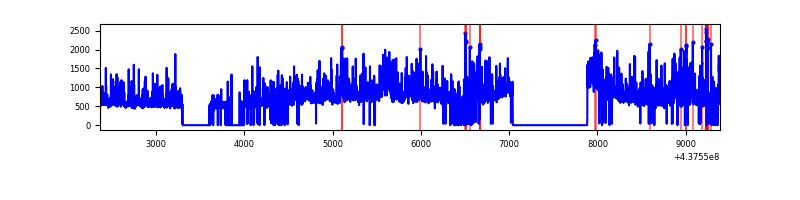 |
| B | 7022 | 5682 | 103 | 103 | 1.47% | 1.81% | 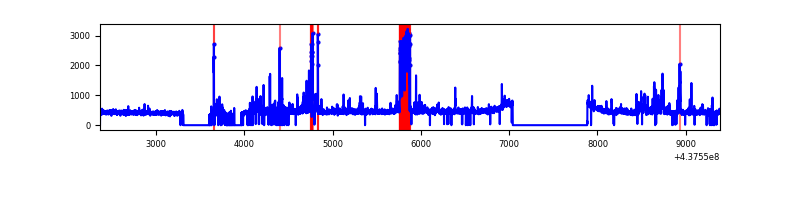 |
| C | 7023 | 5670 | 118 | 118 | 1.68% | 2.08% | 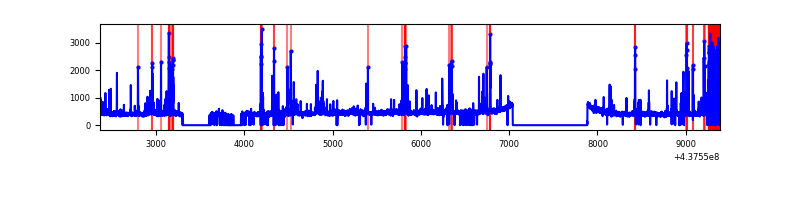 |
| D | 7022 | 5659 | 420 | 420 | 5.98% | 7.42% | 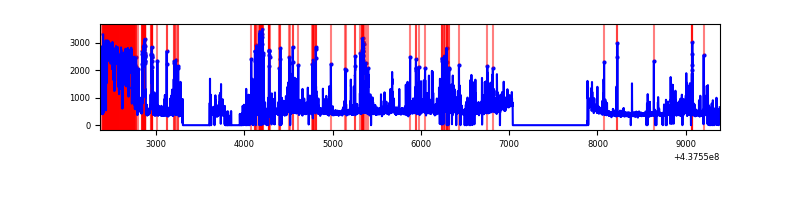 |
Top three noisy pixels from each quadrant. If the there are fewer than three noisy pixels in the level2.evt file, extra rows are filled as -1
| Pixel properties | Quadrant properties | ||||||
|---|---|---|---|---|---|---|---|
| Quadrant | DetID | PixID | Counts | Sigma | Mean | Median | Sigma |
| A | 10 | 83 | 889117 | 7123.13 | 605 | 592 | 124.7 |
| A | 15 | 222 | 836740 | 6703.24 | 605 | 592 | 124.7 |
| A | 15 | 223 | 312687 | 2502.0 | 605 | 592 | 124.7 |
| B | 5 | 235 | 358324 | 3022.43 | 602 | 582 | 118.4 |
| B | 0 | 200 | 73826 | 618.81 | 602 | 582 | 118.4 |
| B | 0 | 213 | 51871 | 433.32 | 602 | 582 | 118.4 |
| C | 14 | 254 | 483969 | 3559.33 | 586 | 588 | 135.8 |
| C | 1 | 241 | 122915 | 900.74 | 586 | 588 | 135.8 |
| C | 3 | 233 | 40781 | 295.96 | 586 | 588 | 135.8 |
| D | 5 | 235 | 1064824 | 7364.05 | 576 | 558 | 144.5 |
| D | 1 | 52 | 238692 | 1647.74 | 576 | 558 | 144.5 |
| D | 14 | 226 | 150924 | 1040.44 | 576 | 558 | 144.5 |
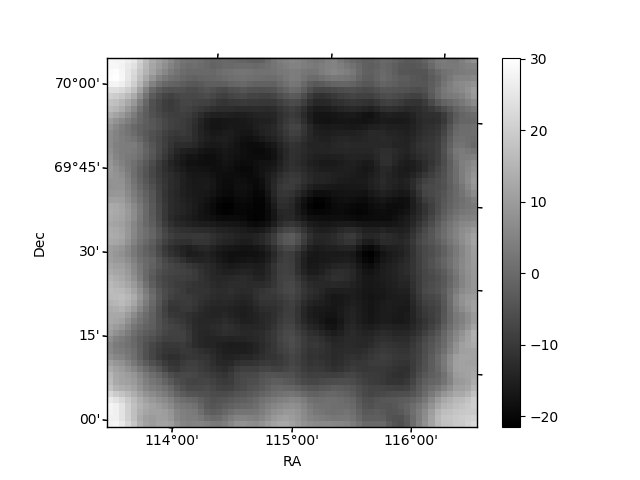
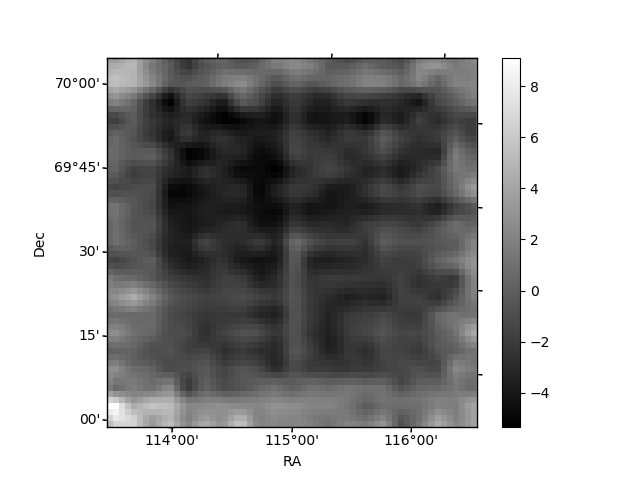
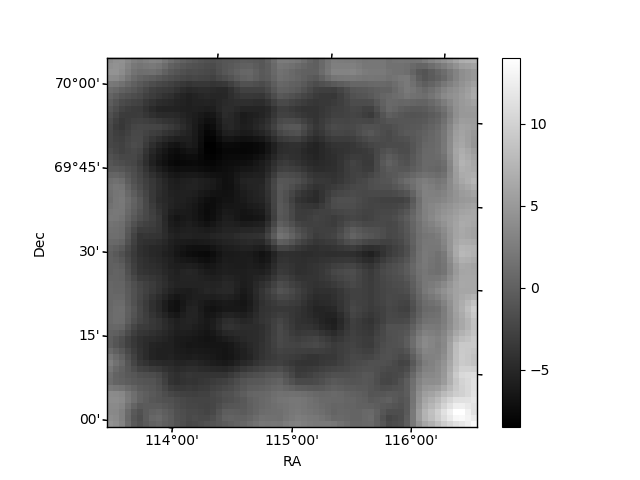
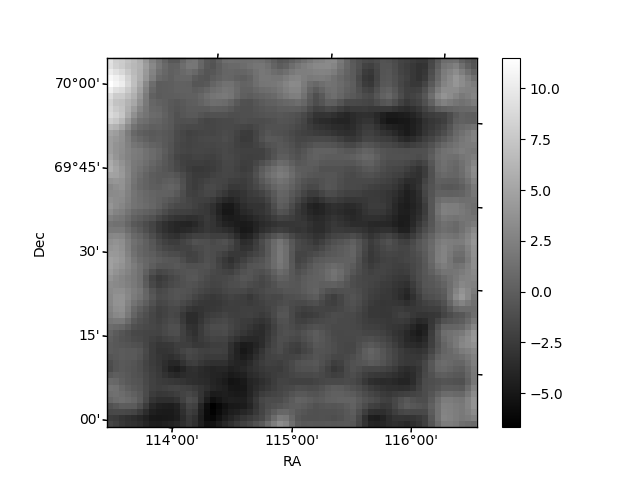
Histogram calculated using DETX and DETY for each event in the final _common_clean file
| Quadrant A | 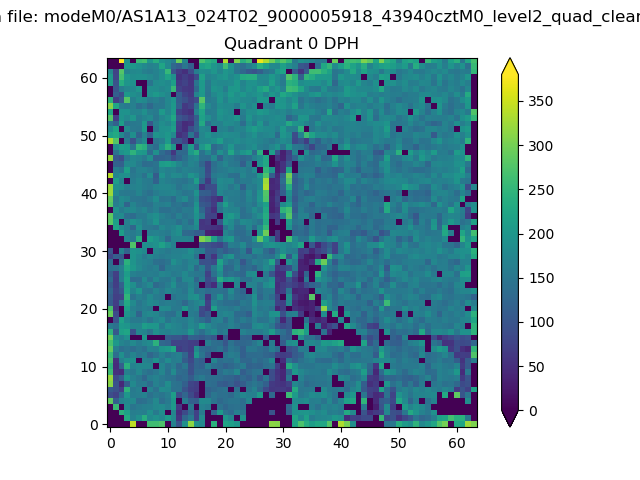 |
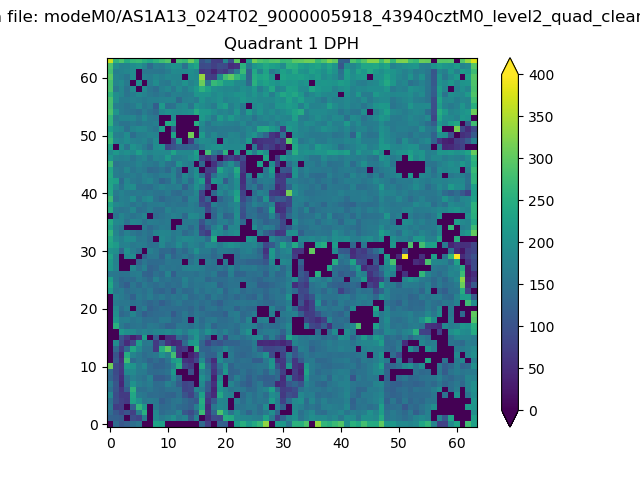 |
Quadrant B |
|---|---|---|---|
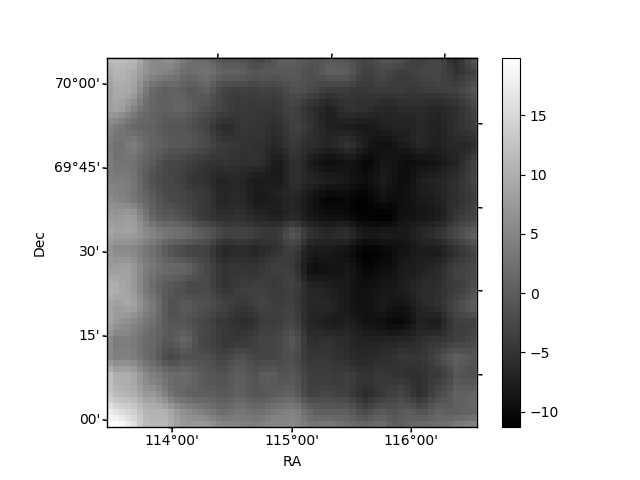
| Quadrant D | 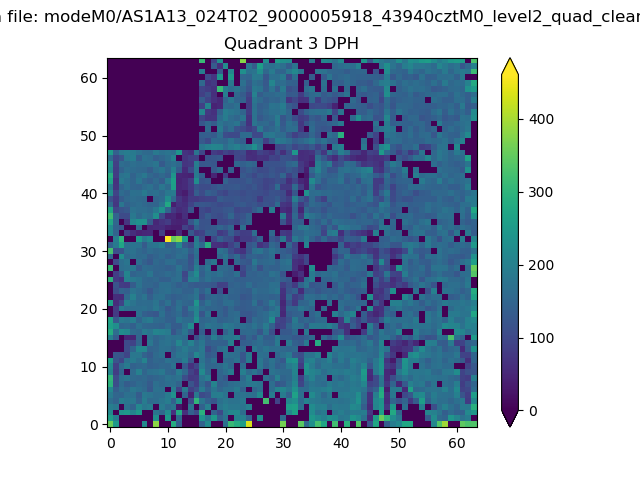 |
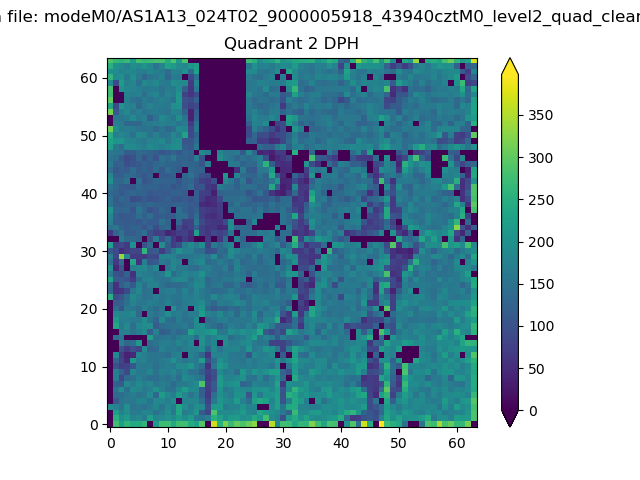 |
Quadrant C |
| Plot type | Count rate plots | Images |
|---|---|---|
| Comparison with Poisson distribution Blue bars denote a histogram of data divided into 1 sec bins. Red curve is a Poisson curve with rate = median count rate of data. |
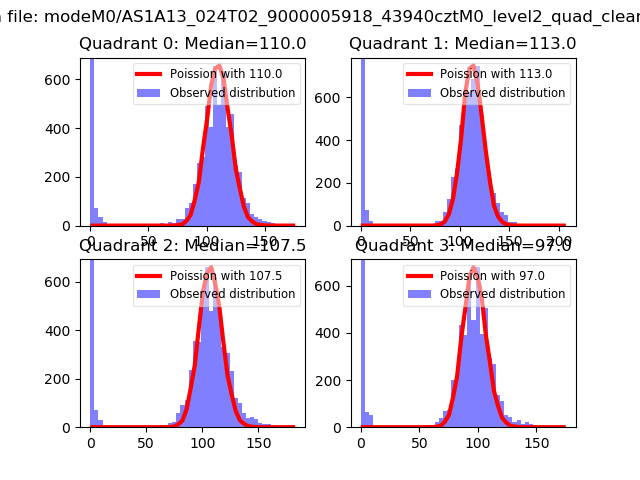 |
 |
| Quadrant-wise count rates Data is divided into 100 sec bins |
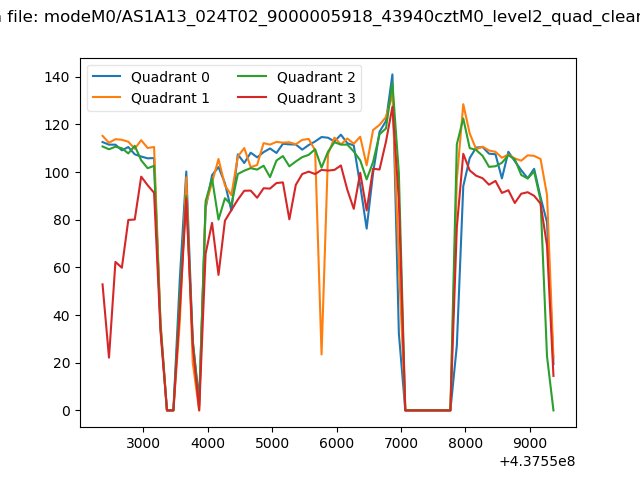 |
|
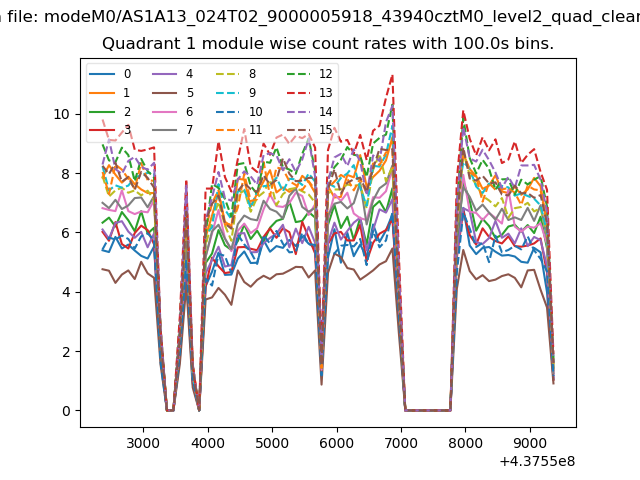
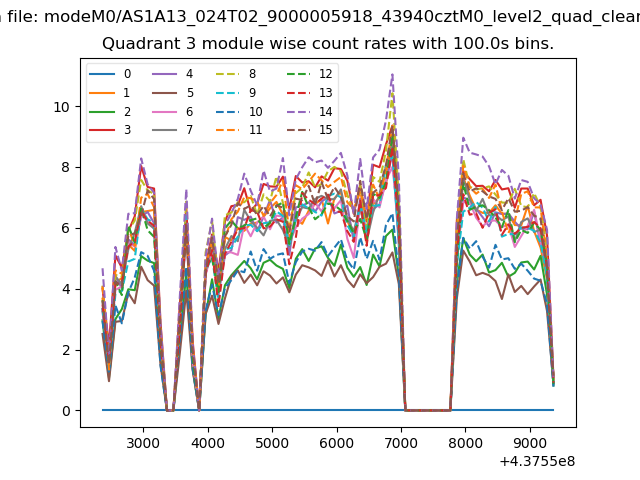
| Module-wise count rates for Quadrant A Data is divided into 100 sec bins |
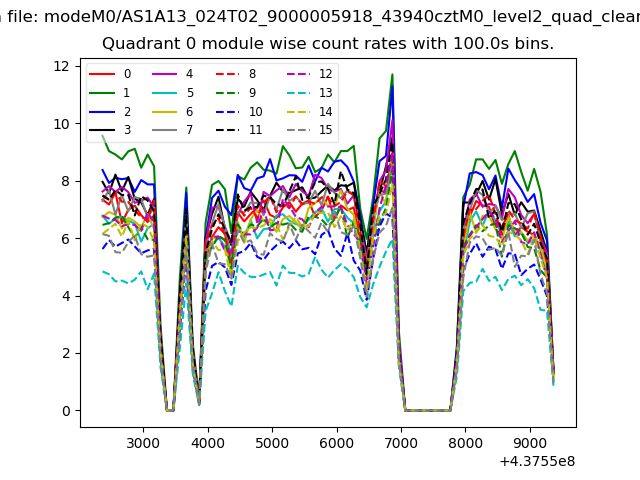 |
 |
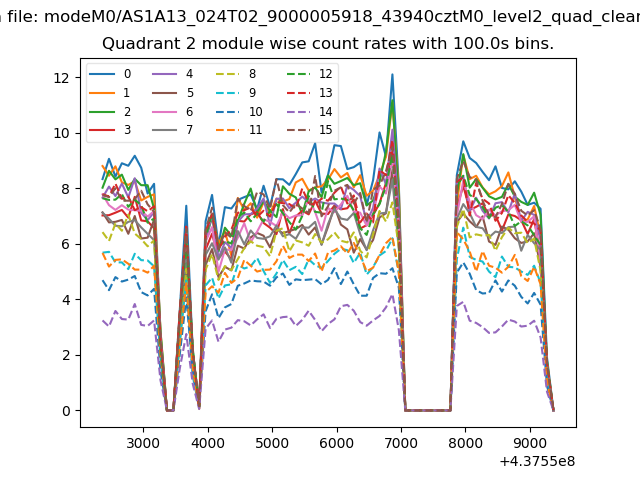
| Module-wise count rates for Quadrant B Data is divided into 100 sec bins |
 |
 |
| Module-wise count rates for Quadrant C Data is divided into 100 sec bins |
 |
 |
| Module-wise count rates for Quadrant D Data is divided into 100 sec bins |
 |
 |
| Parameter | Plot |
|---|---|
| CZT HV Monitor | 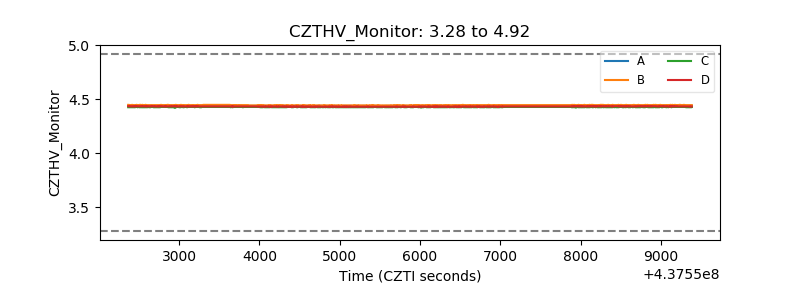 |
| D_VDD | 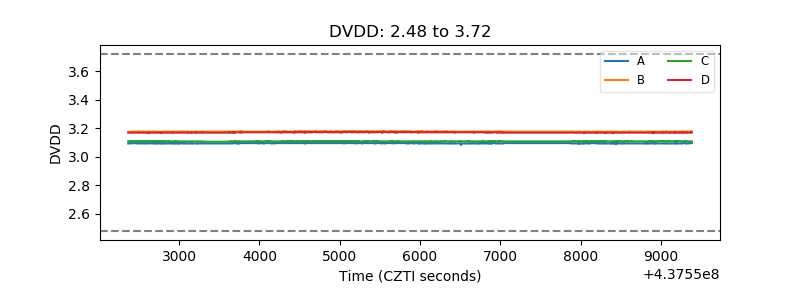 |
| Temperature 1 | 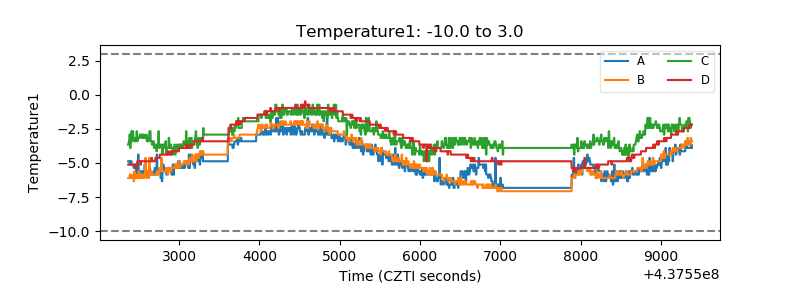 |
| Veto HV Monitor | 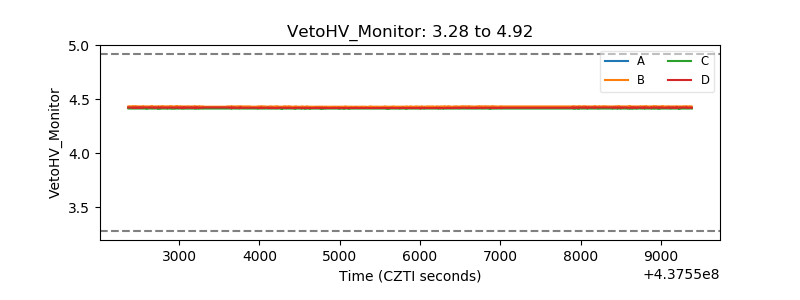 |
| Veto LLD | 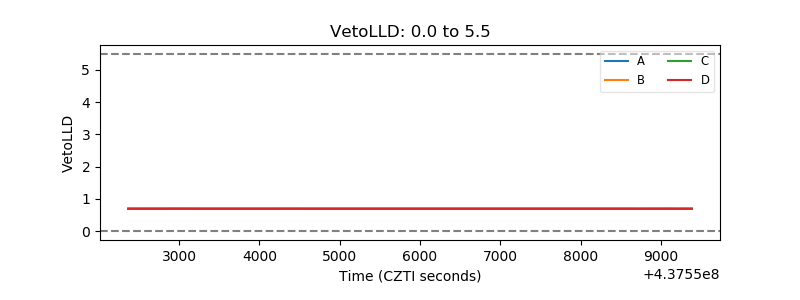 |
| Alpha Counter | 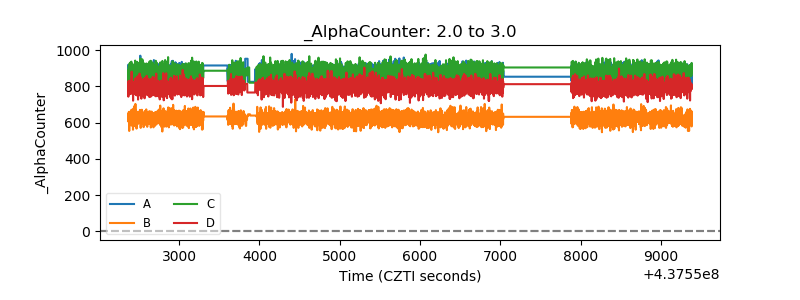 |
| _CPM_Rate | 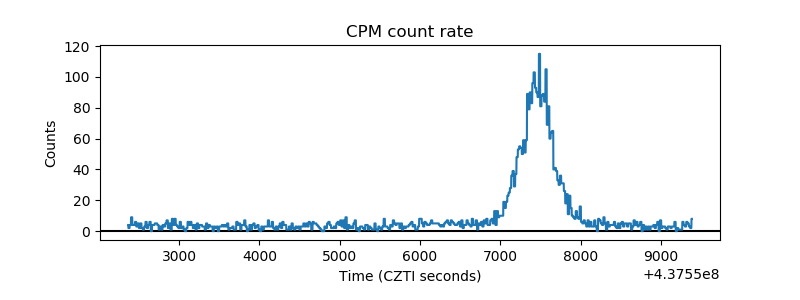 |
| CZT Counter | 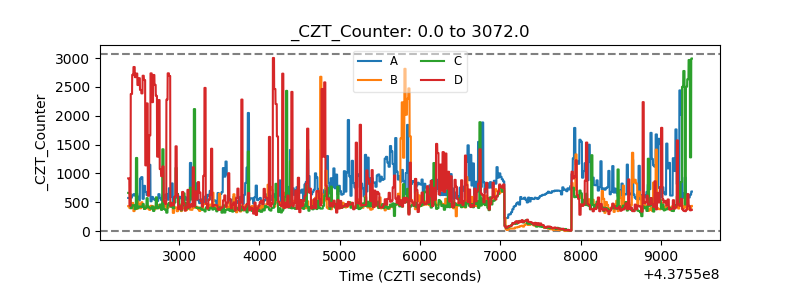 |
| +2.5 Volts monitor | 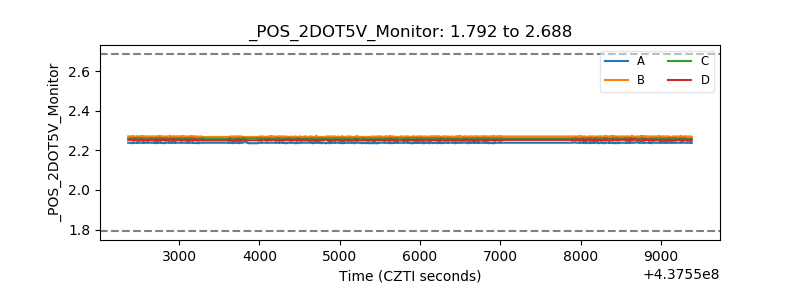 |
| +5 Volts monitor | 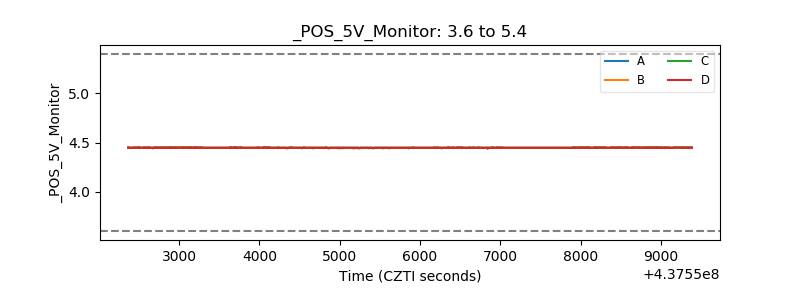 |
| _ROLL_ROT | 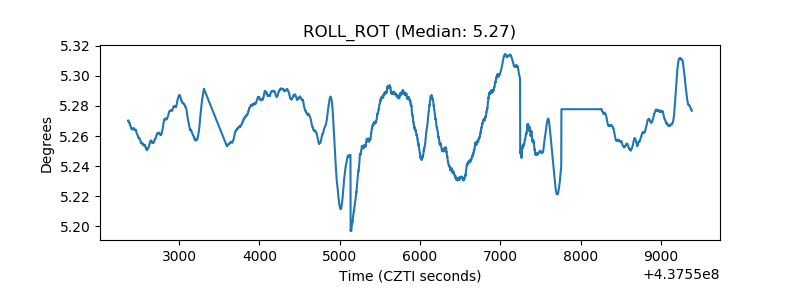 |
| _Roll_DEC | 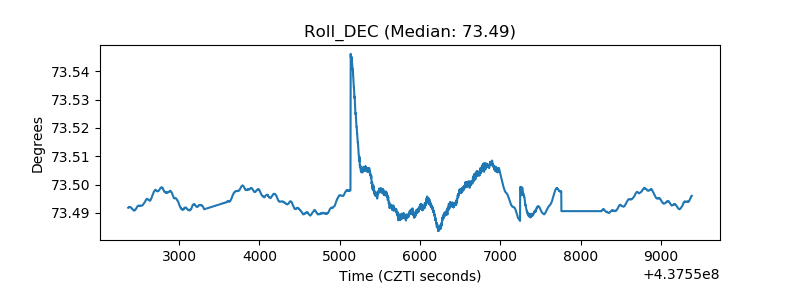 |
| _Roll_RA | 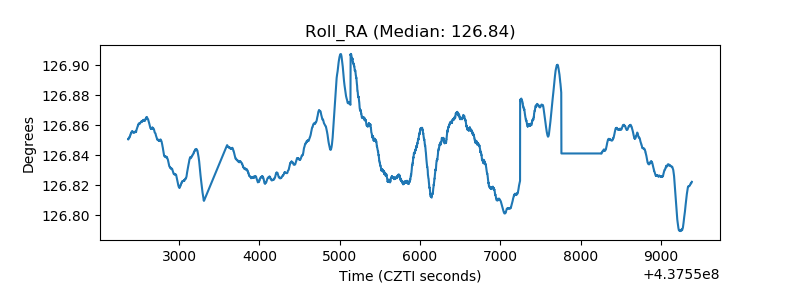 |
| Veto Counter | 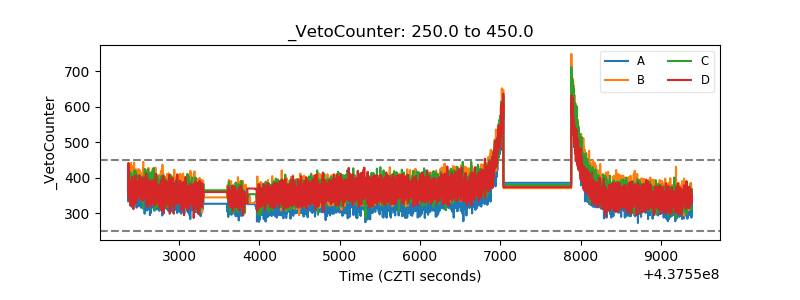 |