| Param | Original file | Final file |
|---|---|---|
| Filename | modeM0/AS1A13_024T02_9000005918_43942cztM0_level2.fits | modeM0/AS1A13_024T02_9000005918_43942cztM0_level2_quad_clean.evt |
| Size (bytes) | 515,154,240 | 116,035,200 |
| Size | 491.3 MB | 110.7 MB |
| Events in quadrant A | 5,146,570 | 776,513 |
| Events in quadrant B | 4,381,351 | 793,694 |
| Events in quadrant C | 3,460,056 | 760,581 |
| Events in quadrant D | 5,511,051 | 670,834 |
| Mode M0 | |||
|---|---|---|---|
| Quadrant | BADHDUFLAG | Total packets | Discarded packets |
| A | 0 | 20585 | 0 |
| B | 0 | 17983 | 0 |
| C | 0 | 15566 | 0 |
| D | 0 | 21417 | 0 |
| Mode SS | |||
|---|---|---|---|
| Quadrant | BADHDUFLAG | Total packets | Discarded packets |
| A | 0 | 148 | 0 |
| B | 0 | 148 | 0 |
| C | 0 | 148 | 0 |
| D | 0 | 148 | 0 |
| Quadrant | Total seconds | Saturated seconds | Saturation percentage |
|---|---|---|---|
| A | 7345 | 172 | 2.341729% |
| B | 7346 | 165 | 2.246120% |
| C | 7346 | 45 | 0.612578% |
| D | 7346 | 416 | 5.662946% |
Noise dominated data is calculated using 1-second bins in cleaned event files. If a bin has >2000 counts, and if more than 50% of those come from <1% of pixels, then it is considered to be noise-dominated and hence unusable.
| Quadrant | # 1 sec bins | Bins with >0 counts | Bins with >2000 counts | High rate bins dominated by noise | Noise dominated (total time) | Noise dominated (detector-on time) | Marked lightcurve |
|---|---|---|---|---|---|---|---|
| A | 7345 | 7345 | 102 | 102 | 1.39% | 1.39% | 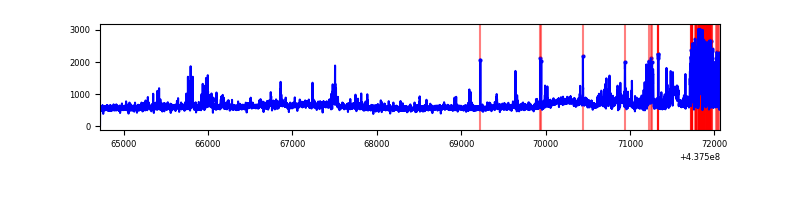 |
| B | 7346 | 7346 | 101 | 101 | 1.37% | 1.37% | 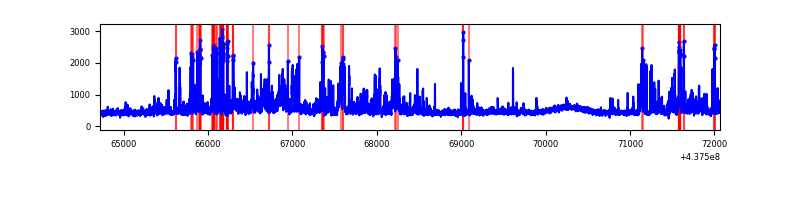 |
| C | 7346 | 7346 | 30 | 30 | 0.41% | 0.41% | 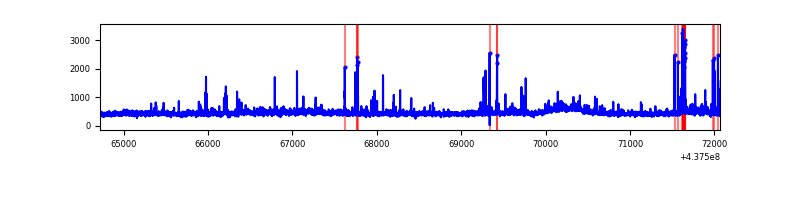 |
| D | 7346 | 7346 | 346 | 346 | 4.71% | 4.71% | 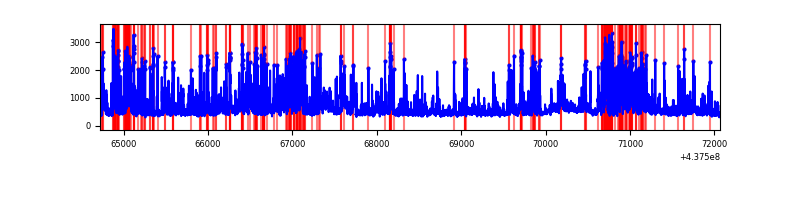 |
Top three noisy pixels from each quadrant. If the there are fewer than three noisy pixels in the level2.evt file, extra rows are filled as -1
| Pixel properties | Quadrant properties | ||||||
|---|---|---|---|---|---|---|---|
| Quadrant | DetID | PixID | Counts | Sigma | Mean | Median | Sigma |
| A | 10 | 83 | 1084802 | 6588.46 | 796 | 780 | 164.5 |
| A | 15 | 222 | 669560 | 4064.71 | 796 | 780 | 164.5 |
| A | 15 | 223 | 196033 | 1186.71 | 796 | 780 | 164.5 |
| B | 5 | 235 | 498217 | 3226.78 | 788 | 764 | 154.2 |
| B | 0 | 200 | 300134 | 1941.9 | 788 | 764 | 154.2 |
| B | 5 | 172 | 143594 | 926.48 | 788 | 764 | 154.2 |
| C | 14 | 254 | 206868 | 1135.33 | 772 | 775 | 181.5 |
| C | 3 | 233 | 169412 | 928.99 | 772 | 775 | 181.5 |
| C | 15 | 157 | 27049 | 144.74 | 772 | 775 | 181.5 |
| D | 13 | 249 | 633534 | 3341.21 | 758 | 733 | 189.4 |
| D | 1 | 52 | 477682 | 2518.3 | 758 | 733 | 189.4 |
| D | 5 | 235 | 224361 | 1180.76 | 758 | 733 | 189.4 |
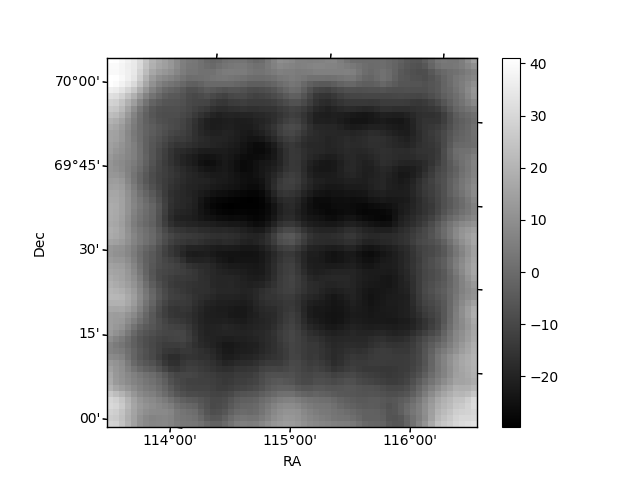
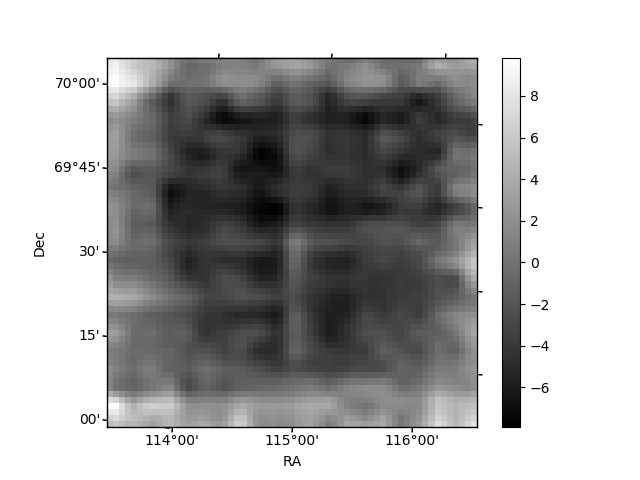
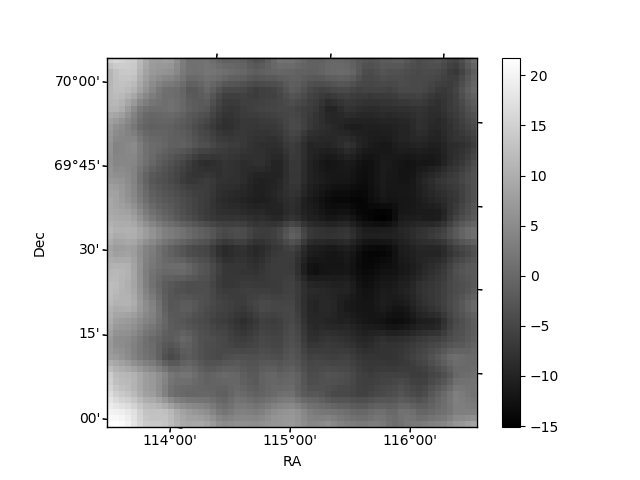
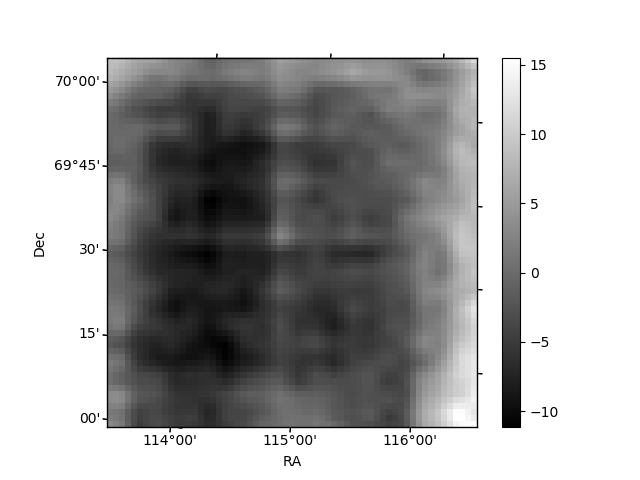
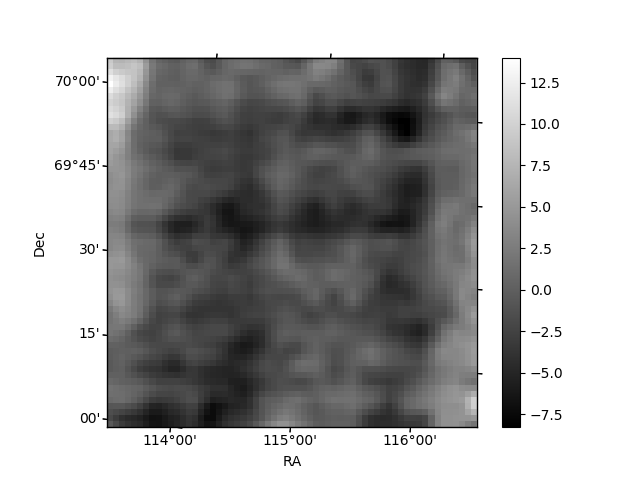
Histogram calculated using DETX and DETY for each event in the final _common_clean file
| Quadrant A | 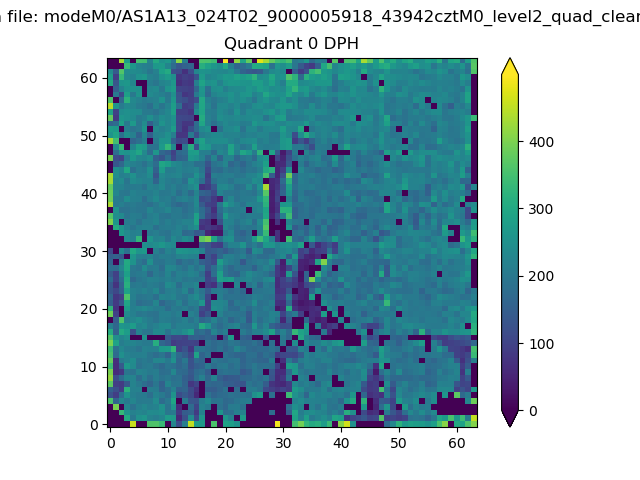 |
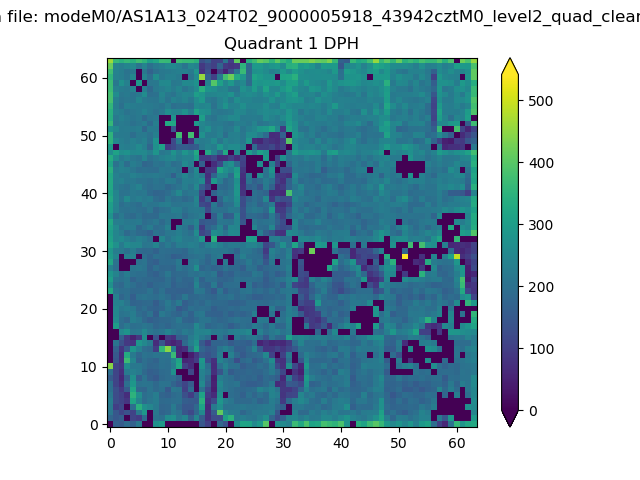 |
Quadrant B |
|---|---|---|---|
| Quadrant D | 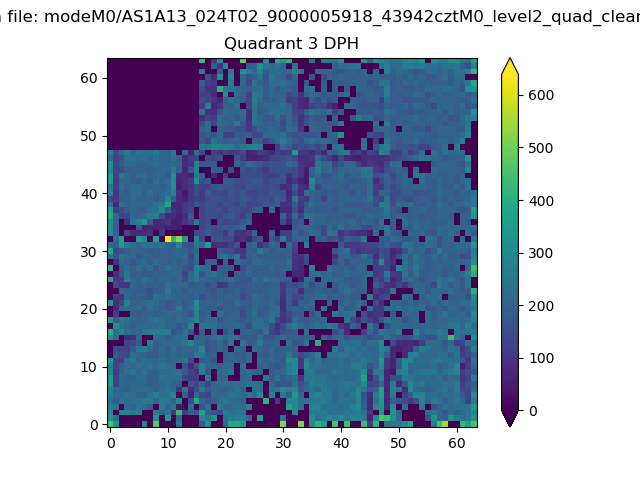 |
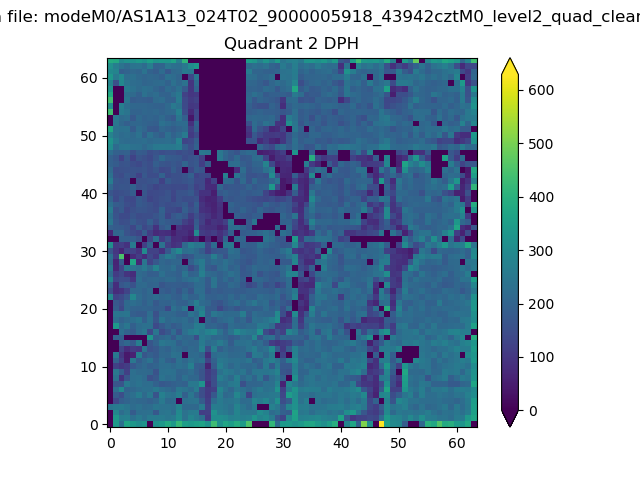 |
Quadrant C |
| Plot type | Count rate plots | Images |
|---|---|---|
| Comparison with Poisson distribution Blue bars denote a histogram of data divided into 1 sec bins. Red curve is a Poisson curve with rate = median count rate of data. |
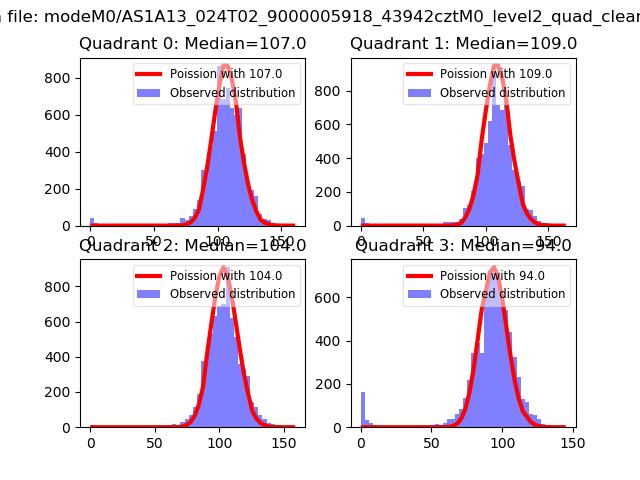 |
 |
| Quadrant-wise count rates Data is divided into 100 sec bins |
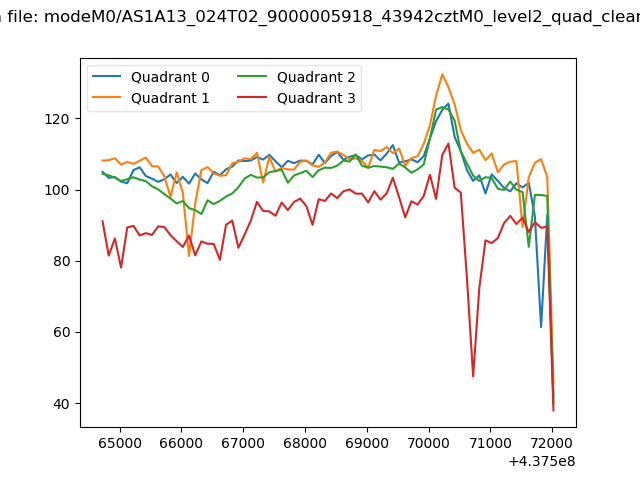 |
|
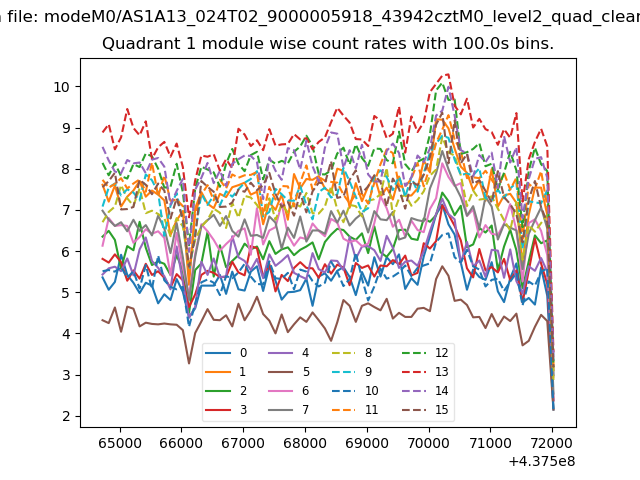
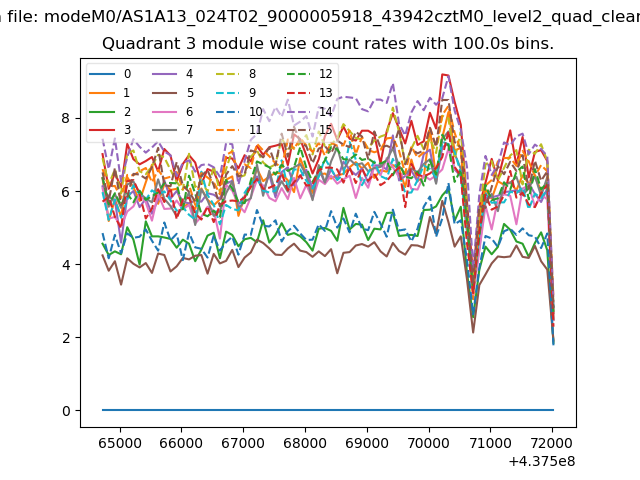
| Module-wise count rates for Quadrant A Data is divided into 100 sec bins |
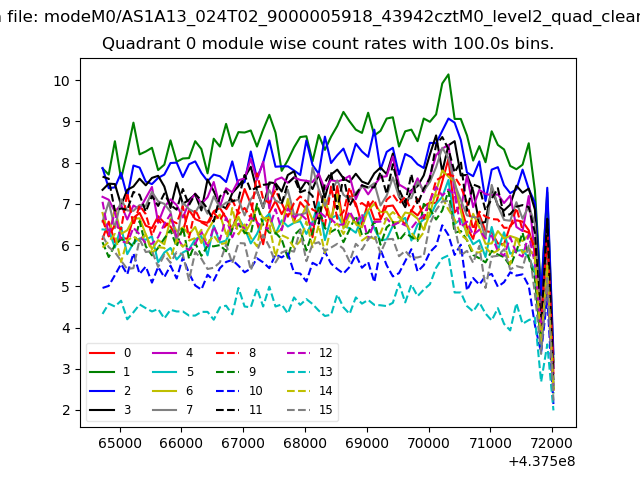 |
 |
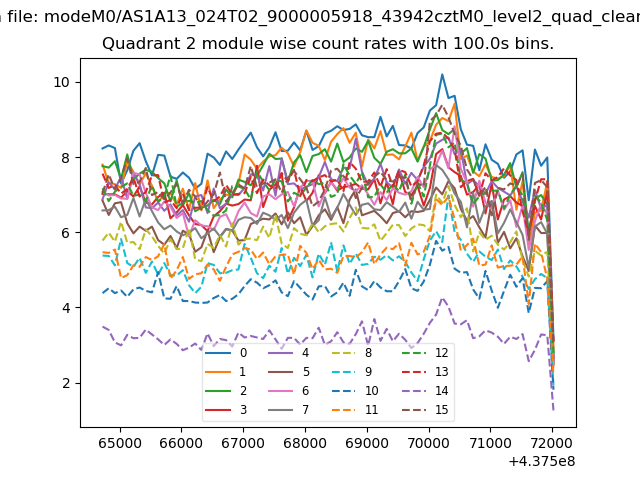
| Module-wise count rates for Quadrant B Data is divided into 100 sec bins |
 |
 |
| Module-wise count rates for Quadrant C Data is divided into 100 sec bins |
 |
 |
| Module-wise count rates for Quadrant D Data is divided into 100 sec bins |
 |
 |
| Parameter | Plot |
|---|---|
| CZT HV Monitor | 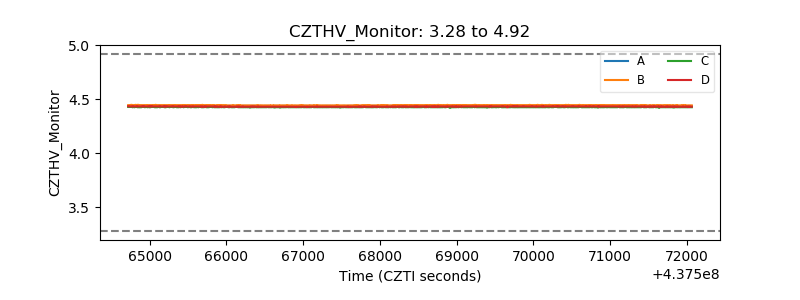 |
| D_VDD | 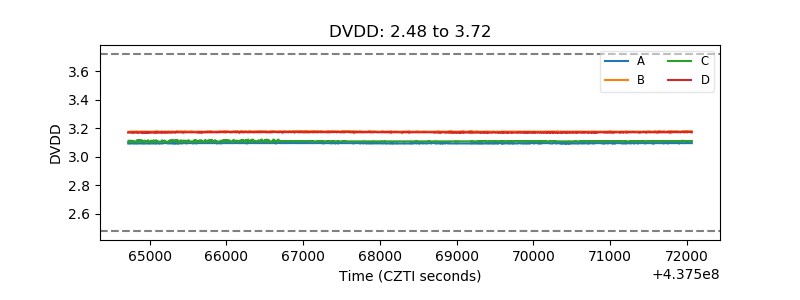 |
| Temperature 1 | 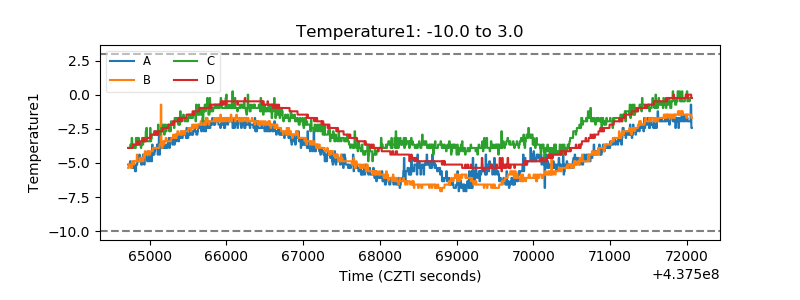 |
| Veto HV Monitor | 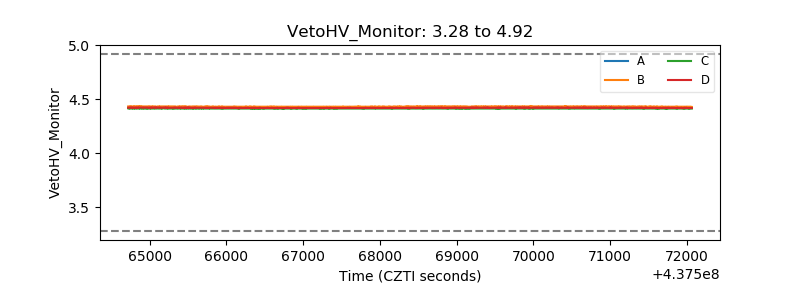 |
| Veto LLD | 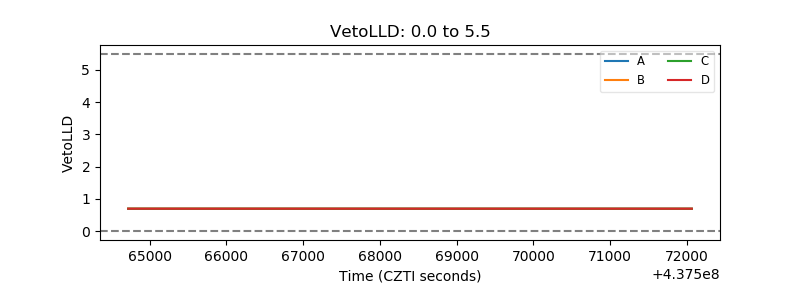 |
| Alpha Counter | 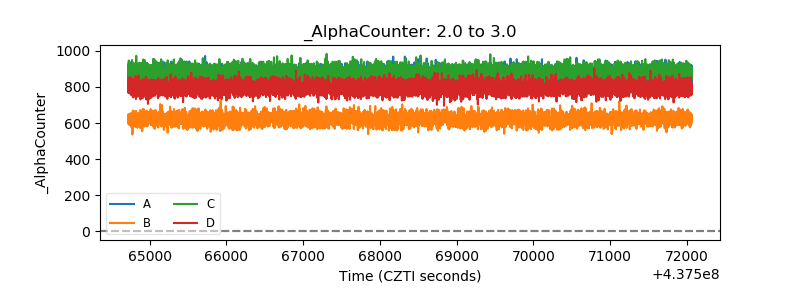 |
| _CPM_Rate | 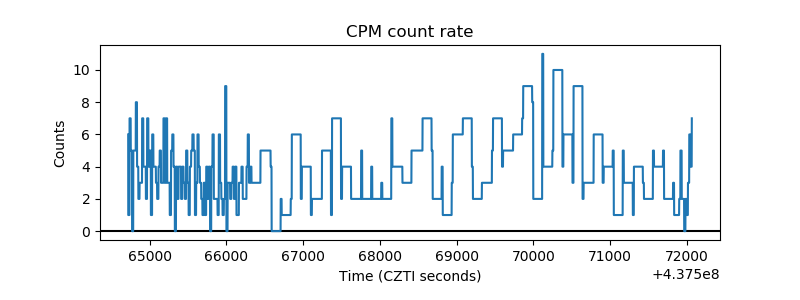 |
| CZT Counter | 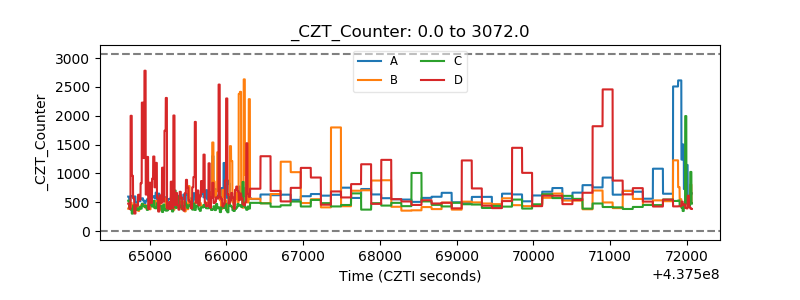 |
| +2.5 Volts monitor | 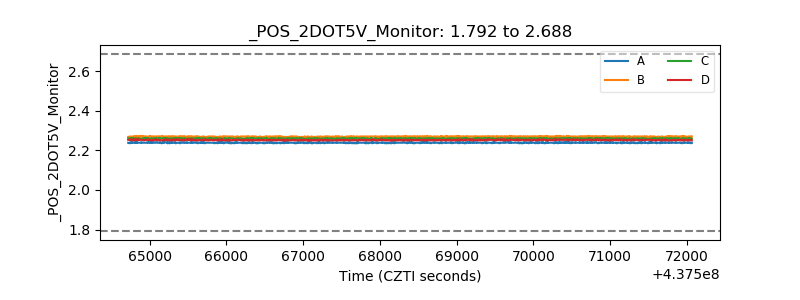 |
| +5 Volts monitor | 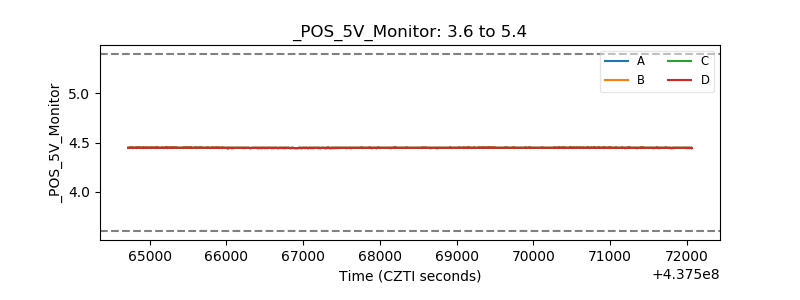 |
| _ROLL_ROT | 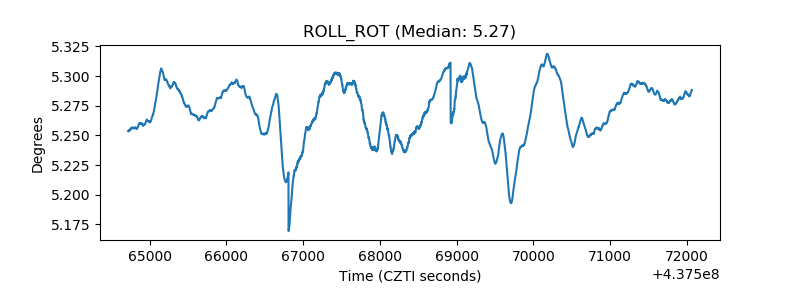 |
| _Roll_DEC |  |
| _Roll_RA | 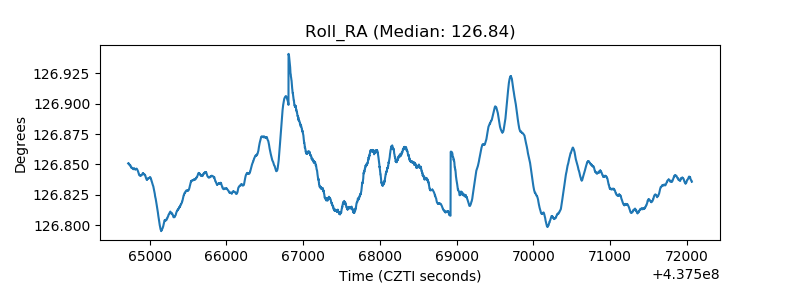 |
| Veto Counter | 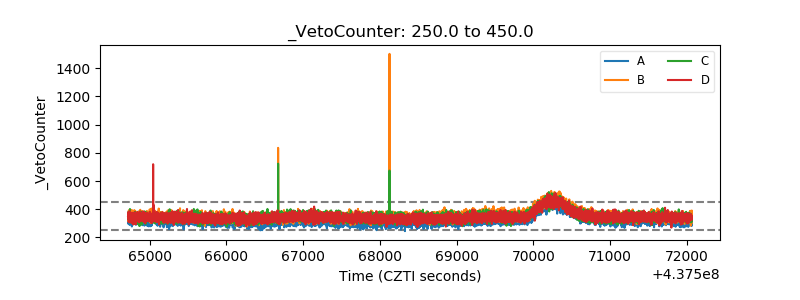 |