| Param | Original file | Final file |
|---|---|---|
| Filename | modeM0/AS1A13_025T01_9000005920_43943cztM0_level2.fits | modeM0/AS1A13_025T01_9000005920_43943cztM0_level2_quad_clean.evt |
| Size (bytes) | 229,682,880 | 39,216,960 |
| Size | 219.0 MB | 37.4 MB |
| Events in quadrant A | 2,739,374 | 243,127 |
| Events in quadrant B | 1,344,602 | 284,526 |
| Events in quadrant C | 2,084,527 | 248,453 |
| Events in quadrant D | 2,134,651 | 229,501 |
| Mode SS | |||
|---|---|---|---|
| Quadrant | BADHDUFLAG | Total packets | Discarded packets |
| A | 0 | 50 | 0 |
| B | 0 | 50 | 0 |
| C | 0 | 50 | 0 |
| D | 0 | 50 | 0 |
| Mode M0 | |||
|---|---|---|---|
| Quadrant | BADHDUFLAG | Total packets | Discarded packets |
| A | 0 | 9969 | 0 |
| B | 0 | 5658 | 0 |
| C | 0 | 7877 | 0 |
| D | 0 | 8066 | 0 |
| Quadrant | Total seconds | Saturated seconds | Saturation percentage |
|---|---|---|---|
| A | 2535 | 499 | 19.684418% |
| B | 2535 | 64 | 2.524655% |
| C | 2535 | 288 | 11.360947% |
| D | 2535 | 288 | 11.360947% |
Noise dominated data is calculated using 1-second bins in cleaned event files. If a bin has >2000 counts, and if more than 50% of those come from <1% of pixels, then it is considered to be noise-dominated and hence unusable.
| Quadrant | # 1 sec bins | Bins with >0 counts | Bins with >2000 counts | High rate bins dominated by noise | Noise dominated (total time) | Noise dominated (detector-on time) | Marked lightcurve |
|---|---|---|---|---|---|---|---|
| A | 2535 | 2535 | 303 | 303 | 11.95% | 11.95% | 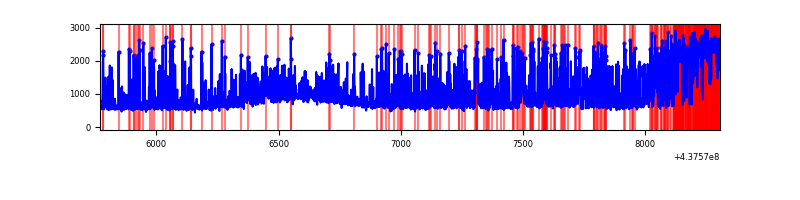 |
| B | 2535 | 2535 | 12 | 12 | 0.47% | 0.47% | 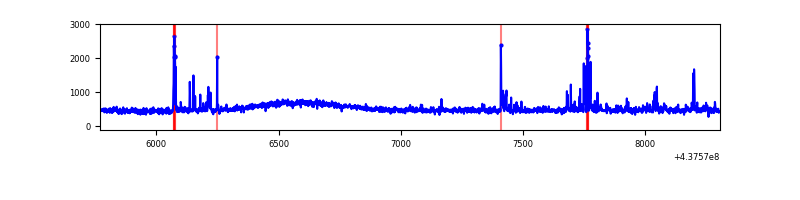 |
| C | 2535 | 2535 | 231 | 231 | 9.11% | 9.11% | 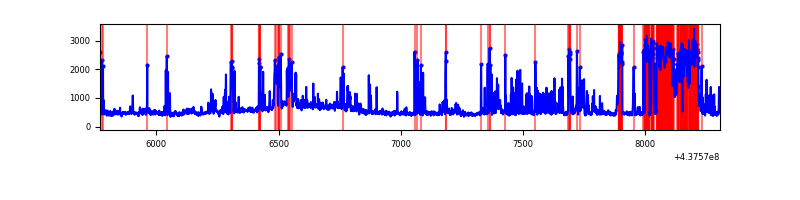 |
| D | 2535 | 2535 | 167 | 167 | 6.59% | 6.59% | 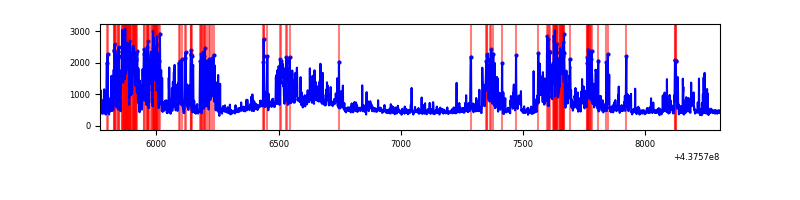 |
Top three noisy pixels from each quadrant. If the there are fewer than three noisy pixels in the level2.evt file, extra rows are filled as -1
| Pixel properties | Quadrant properties | ||||||
|---|---|---|---|---|---|---|---|
| Quadrant | DetID | PixID | Counts | Sigma | Mean | Median | Sigma |
| A | 15 | 222 | 1100167 | 17110.67 | 296 | 288 | 64.3 |
| A | 10 | 83 | 330284 | 5133.7 | 296 | 288 | 64.3 |
| A | 15 | 223 | 143722 | 2231.38 | 296 | 288 | 64.3 |
| B | 5 | 172 | 71613 | 1112.41 | 310 | 299 | 64.1 |
| B | 0 | 213 | 12719 | 193.74 | 310 | 299 | 64.1 |
| B | 0 | 200 | 11393 | 173.05 | 310 | 299 | 64.1 |
| C | 1 | 241 | 729141 | 10329.6 | 290 | 291 | 70.6 |
| C | 15 | 158 | 131416 | 1858.36 | 290 | 291 | 70.6 |
| C | 3 | 233 | 41051 | 577.67 | 290 | 291 | 70.6 |
| D | 12 | 17 | 309270 | 4033.52 | 295 | 284 | 76.6 |
| D | 4 | 235 | 283129 | 3692.27 | 295 | 284 | 76.6 |
| D | 2 | 249 | 119248 | 1552.96 | 295 | 284 | 76.6 |
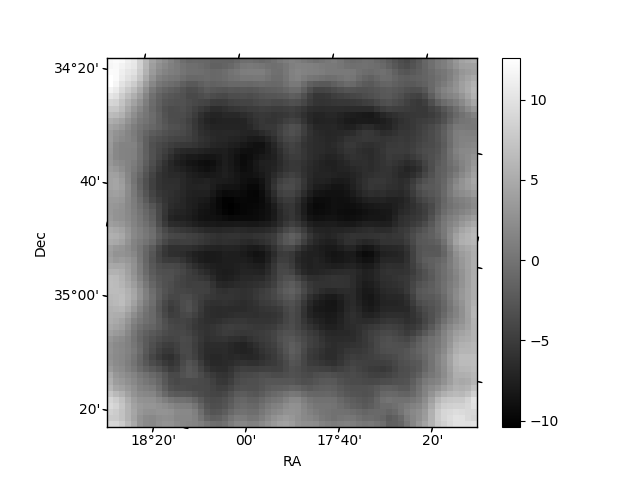
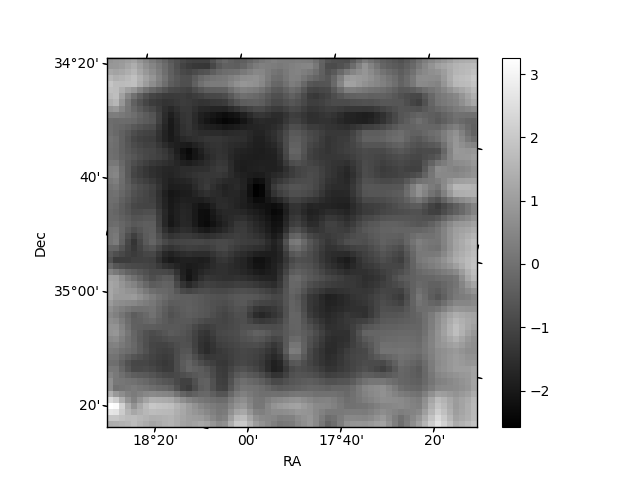
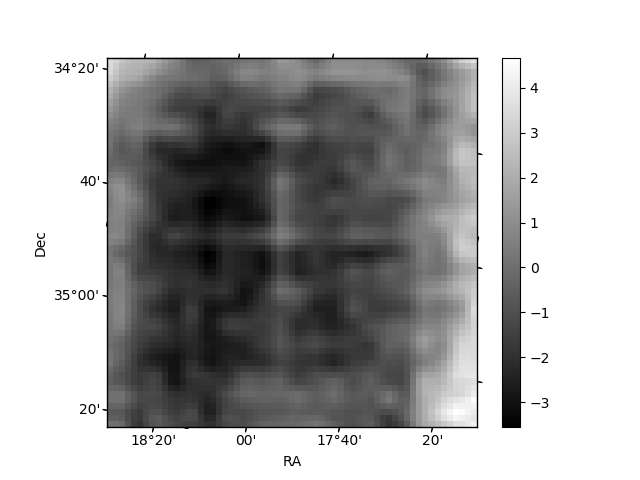
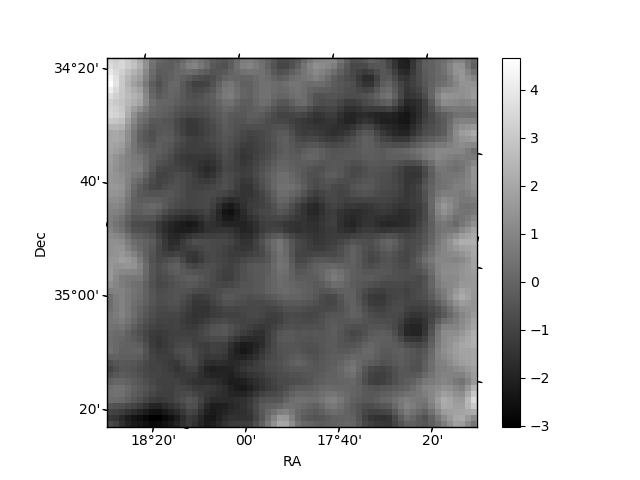
Histogram calculated using DETX and DETY for each event in the final _common_clean file
| Quadrant A | 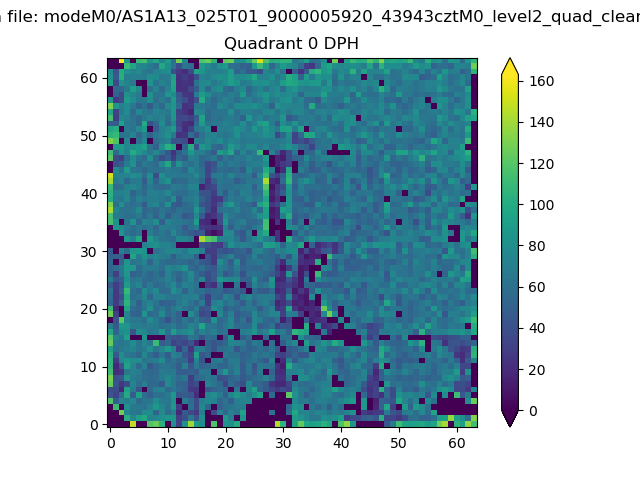 |
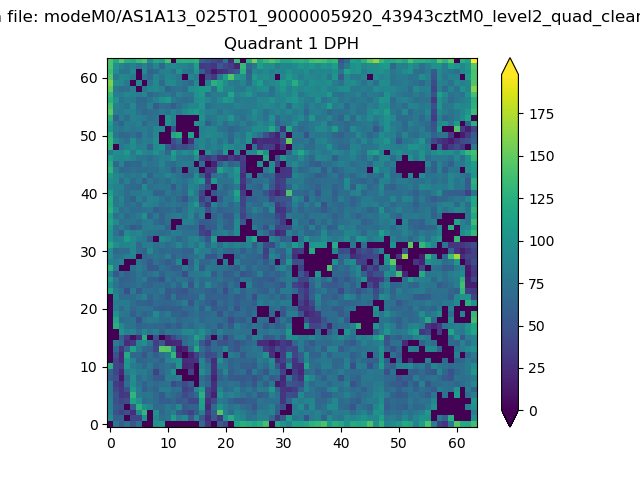 |
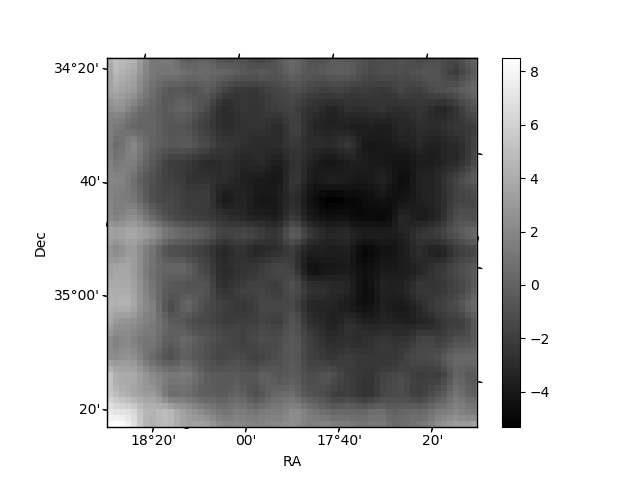
Quadrant B |
|---|---|---|---|
| Quadrant D | 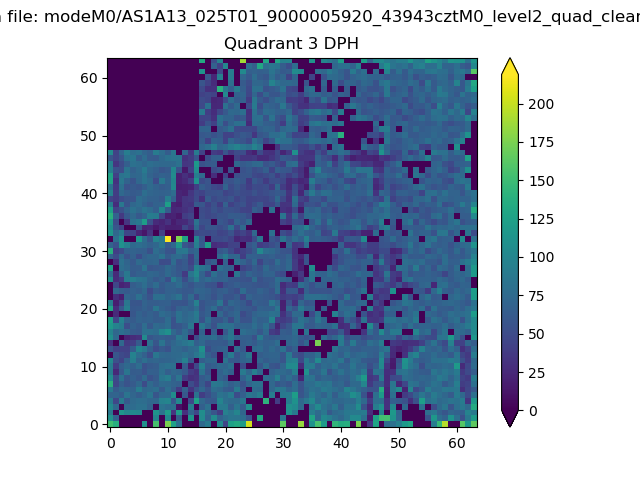 |
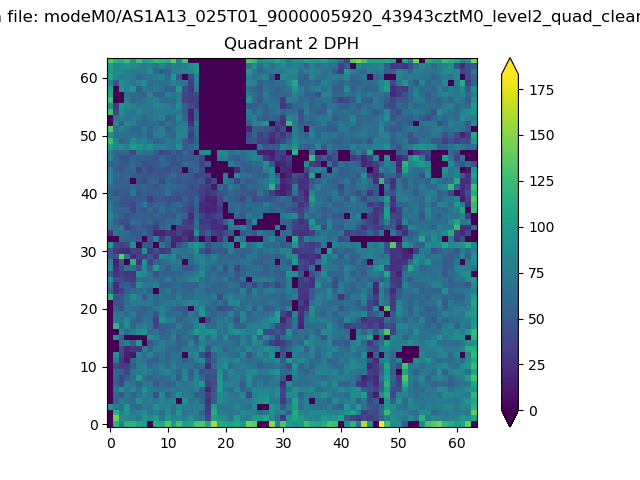 |
Quadrant C |
| Plot type | Count rate plots | Images |
|---|---|---|
| Comparison with Poisson distribution Blue bars denote a histogram of data divided into 1 sec bins. Red curve is a Poisson curve with rate = median count rate of data. |
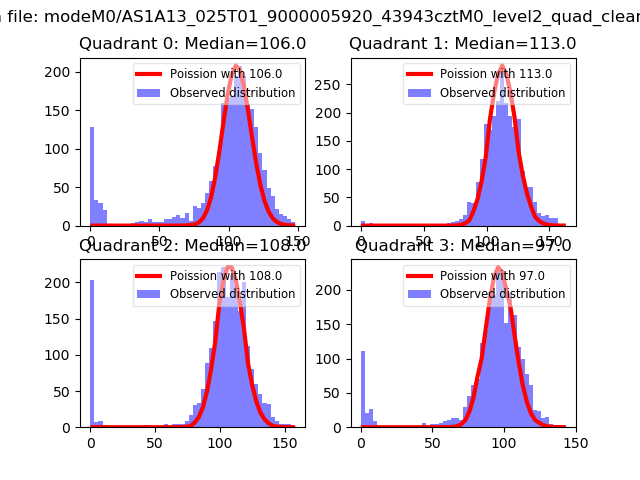 |
 |
| Quadrant-wise count rates Data is divided into 100 sec bins |
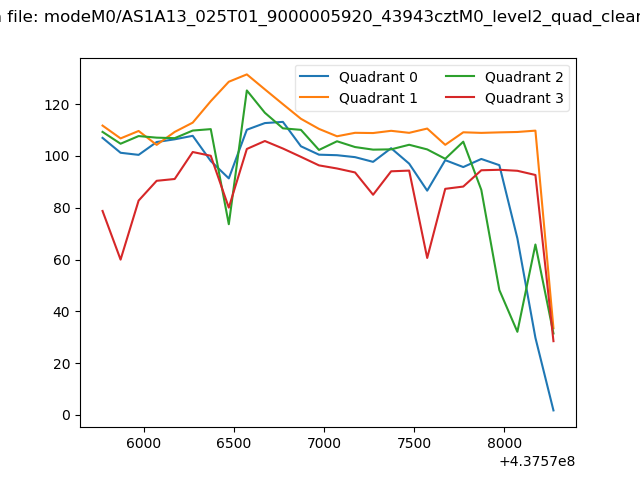 |
|
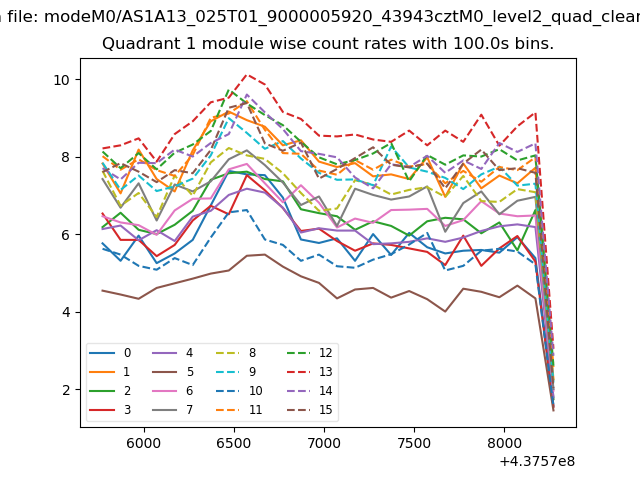
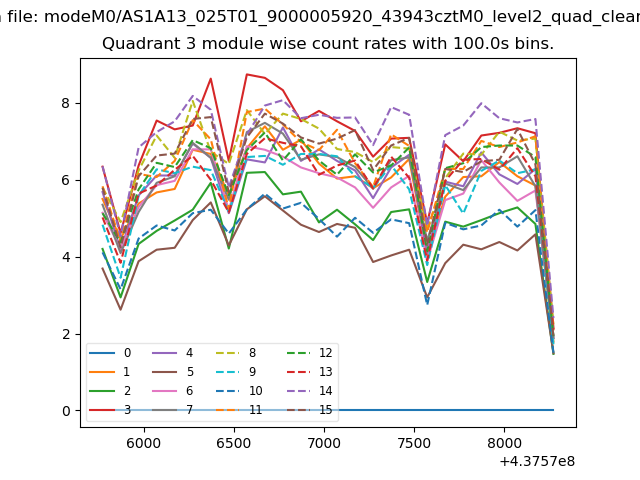
| Module-wise count rates for Quadrant A Data is divided into 100 sec bins |
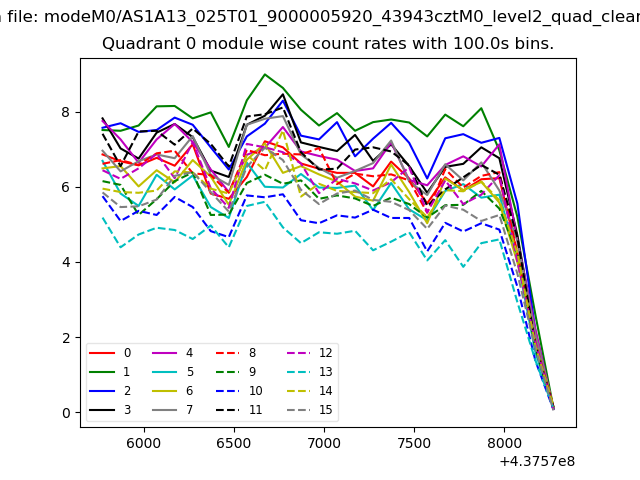 |
 |
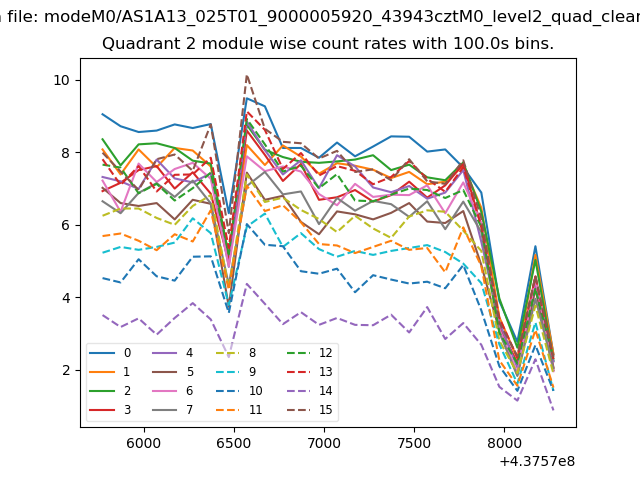
| Module-wise count rates for Quadrant B Data is divided into 100 sec bins |
 |
 |
| Module-wise count rates for Quadrant C Data is divided into 100 sec bins |
 |
 |
| Module-wise count rates for Quadrant D Data is divided into 100 sec bins |
 |
 |
| Parameter | Plot |
|---|---|
| CZT HV Monitor | 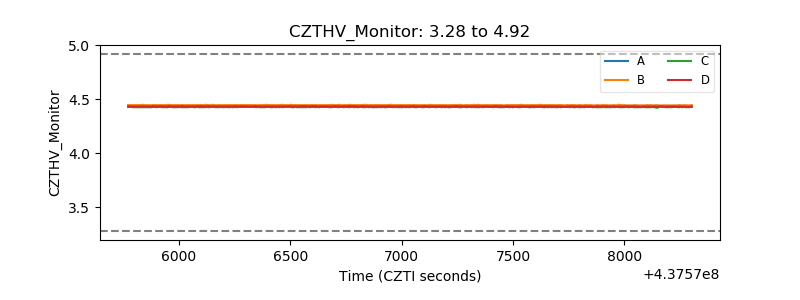 |
| D_VDD | 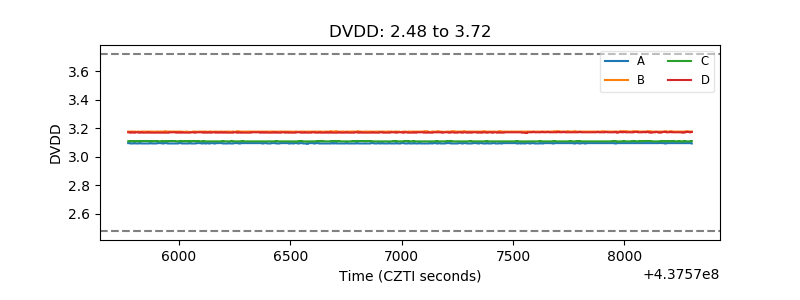 |
| Temperature 1 | 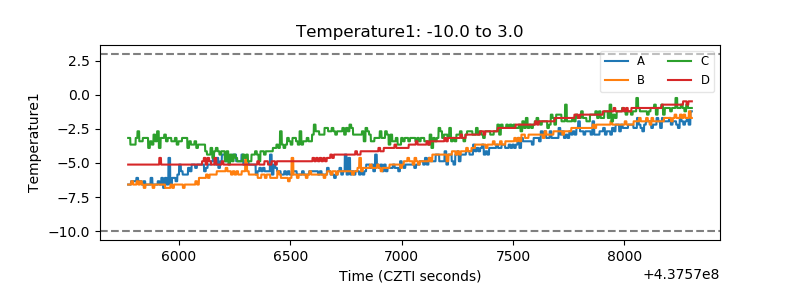 |
| Veto HV Monitor | 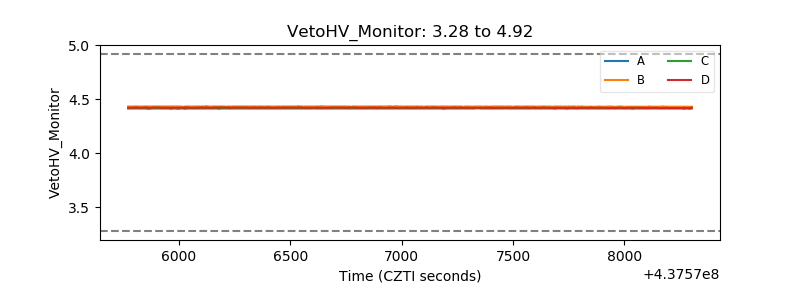 |
| Veto LLD | 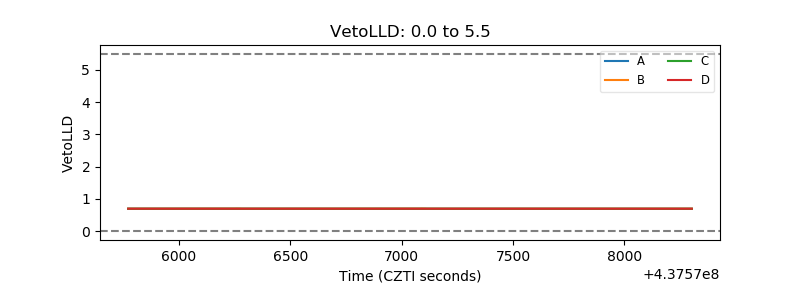 |
| Alpha Counter | 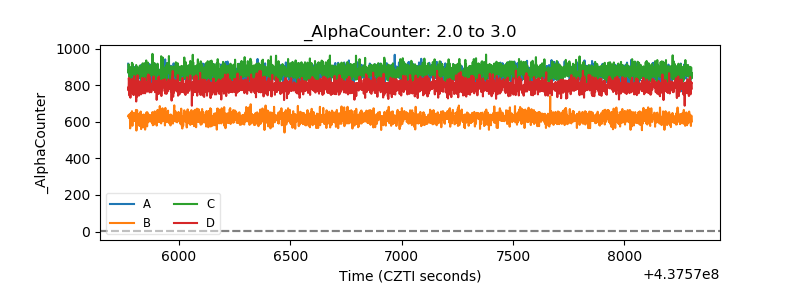 |
| _CPM_Rate | 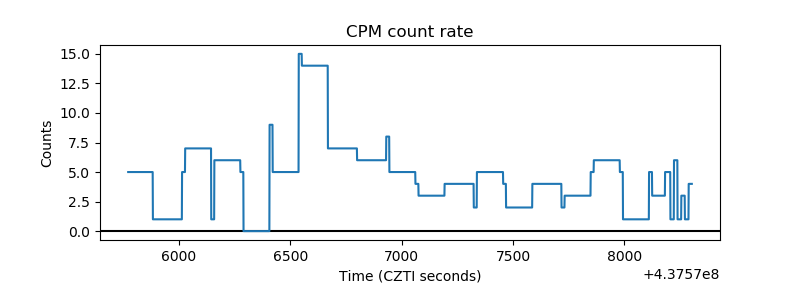 |
| CZT Counter | 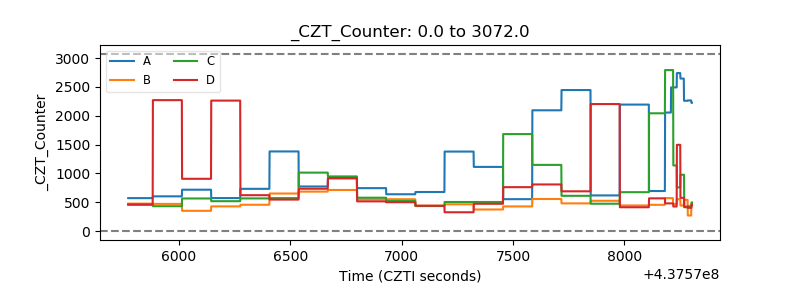 |
| +2.5 Volts monitor | 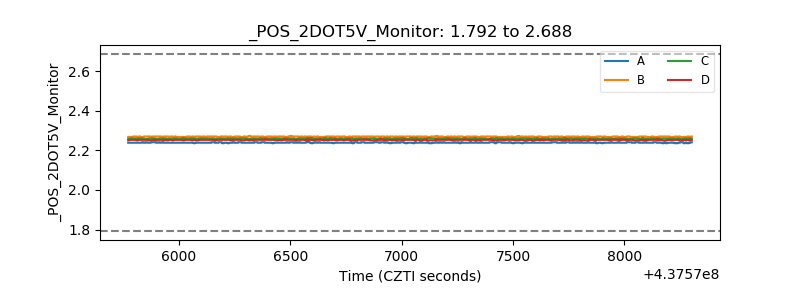 |
| +5 Volts monitor | 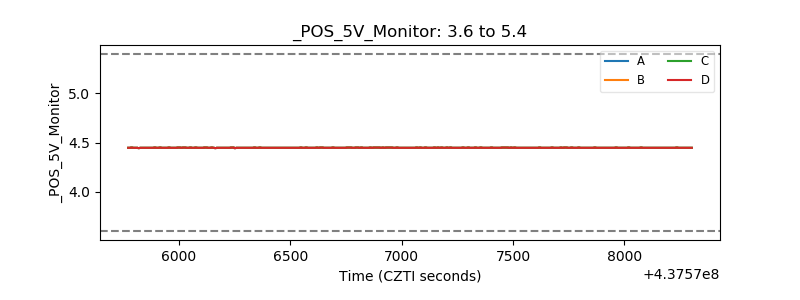 |
| _ROLL_ROT | 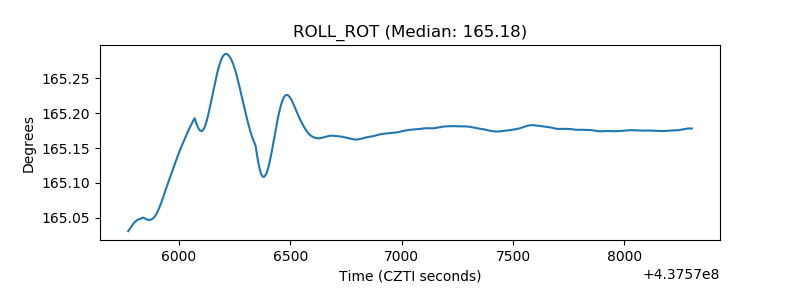 |
| _Roll_DEC | 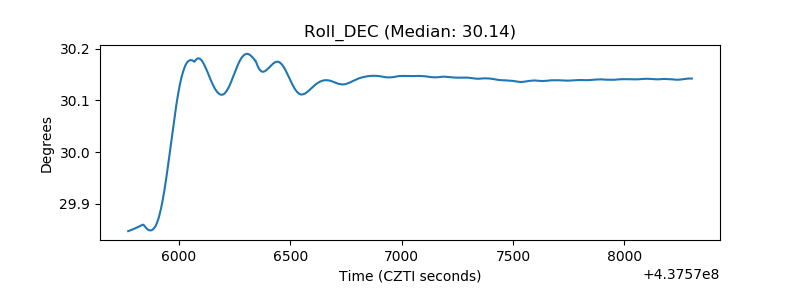 |
| _Roll_RA | 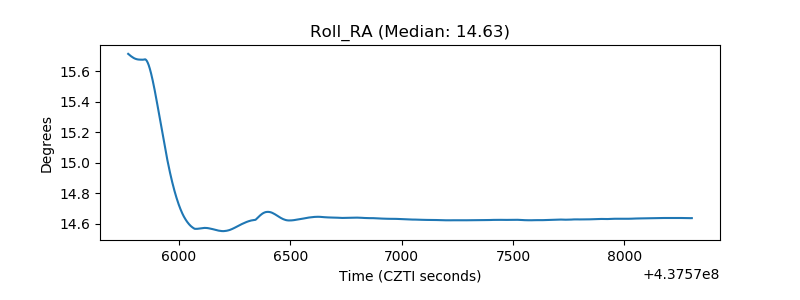 |
| Veto Counter | 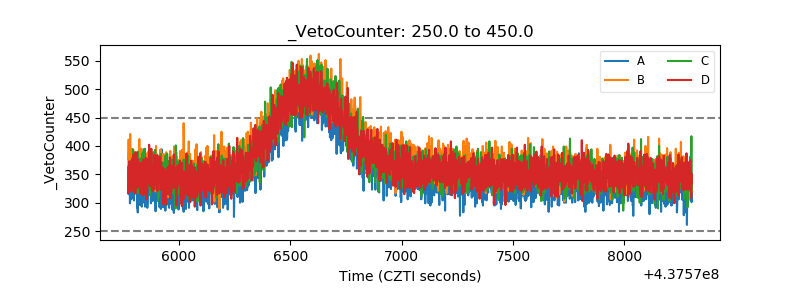 |