| Param | Original file | Final file |
|---|---|---|
| Filename | modeM0/AS1A13_025T01_9000005920_43947cztM0_level2.fits | modeM0/AS1A13_025T01_9000005920_43947cztM0_level2_quad_clean.evt |
| Size (bytes) | 502,554,240 | 111,280,320 |
| Size | 479.3 MB | 106.1 MB |
| Events in quadrant A | 5,467,191 | 743,335 |
| Events in quadrant B | 3,854,554 | 752,643 |
| Events in quadrant C | 3,509,341 | 736,392 |
| Events in quadrant D | 5,228,294 | 649,435 |
| Mode M9 | |||
|---|---|---|---|
| Quadrant | BADHDUFLAG | Total packets | Discarded packets |
| A | 0 | 15 | 0 |
| B | 0 | 16 | 0 |
| C | 0 | 16 | 0 |
| D | 0 | 16 | 0 |
| Mode SS | |||
|---|---|---|---|
| Quadrant | BADHDUFLAG | Total packets | Discarded packets |
| A | 0 | 142 | 0 |
| B | 0 | 142 | 0 |
| C | 0 | 142 | 0 |
| D | 0 | 142 | 0 |
| Mode M0 | |||
|---|---|---|---|
| Quadrant | BADHDUFLAG | Total packets | Discarded packets |
| A | 0 | 21284 | 2 |
| B | 0 | 16258 | 2 |
| C | 0 | 15386 | 2 |
| D | 0 | 20291 | 3 |
| Quadrant | Total seconds | Saturated seconds | Saturation percentage |
|---|---|---|---|
| A | 7003 | 129 | 1.842068% |
| B | 7003 | 150 | 2.141939% |
| C | 7003 | 71 | 1.013851% |
| D | 7002 | 438 | 6.255356% |
Noise dominated data is calculated using 1-second bins in cleaned event files. If a bin has >2000 counts, and if more than 50% of those come from <1% of pixels, then it is considered to be noise-dominated and hence unusable.
| Quadrant | # 1 sec bins | Bins with >0 counts | Bins with >2000 counts | High rate bins dominated by noise | Noise dominated (total time) | Noise dominated (detector-on time) | Marked lightcurve |
|---|---|---|---|---|---|---|---|
| A | 7848 | 7004 | 10 | 10 | 0.13% | 0.14% | 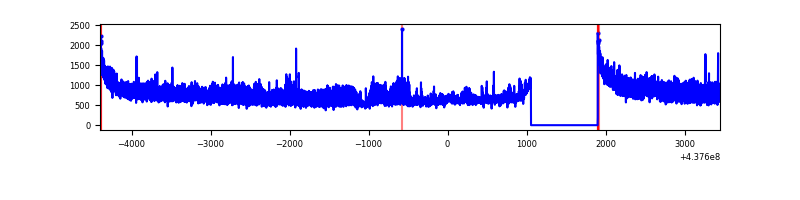 |
| B | 7848 | 7004 | 86 | 86 | 1.10% | 1.23% | 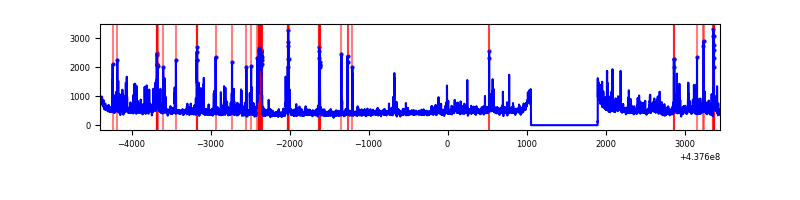 |
| C | 7848 | 7004 | 40 | 40 | 0.51% | 0.57% | 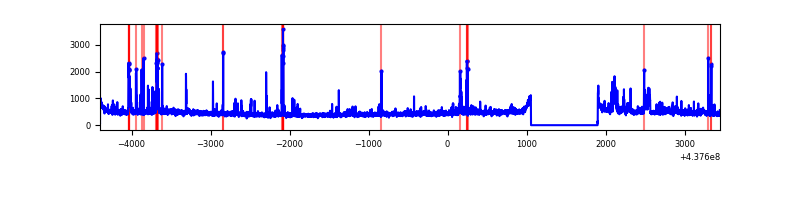 |
| D | 7847 | 7003 | 355 | 355 | 4.52% | 5.07% | 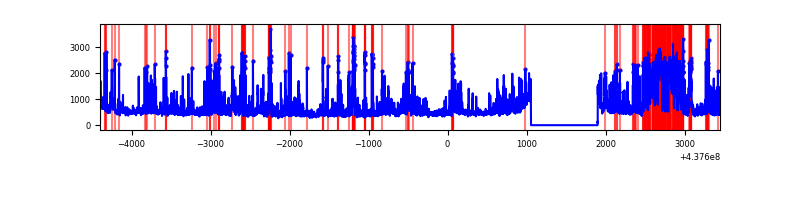 |
Top three noisy pixels from each quadrant. If the there are fewer than three noisy pixels in the level2.evt file, extra rows are filled as -1
| Pixel properties | Quadrant properties | ||||||
|---|---|---|---|---|---|---|---|
| Quadrant | DetID | PixID | Counts | Sigma | Mean | Median | Sigma |
| A | 10 | 83 | 1322915 | 8301.23 | 772 | 755 | 159.3 |
| A | 15 | 222 | 1048535 | 6578.53 | 772 | 755 | 159.3 |
| A | 15 | 223 | 40860 | 251.8 | 772 | 755 | 159.3 |
| B | 0 | 200 | 163386 | 1075.49 | 768 | 744 | 151.2 |
| B | 4 | 171 | 141848 | 933.06 | 768 | 744 | 151.2 |
| B | 4 | 222 | 141845 | 933.04 | 768 | 744 | 151.2 |
| C | 1 | 241 | 265155 | 1469.47 | 762 | 767 | 179.9 |
| C | 3 | 233 | 166432 | 920.77 | 762 | 767 | 179.9 |
| C | 14 | 254 | 49281 | 269.64 | 762 | 767 | 179.9 |
| D | 7 | 204 | 767883 | 4014.46 | 749 | 726 | 191.1 |
| D | 12 | 17 | 260250 | 1358.06 | 749 | 726 | 191.1 |
| D | 5 | 235 | 238115 | 1242.23 | 749 | 726 | 191.1 |
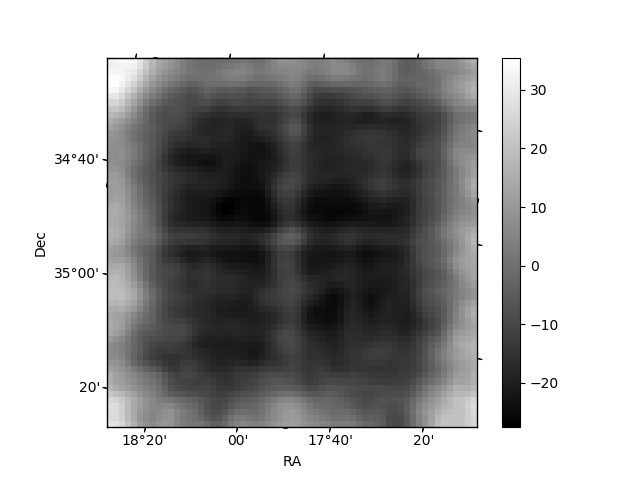
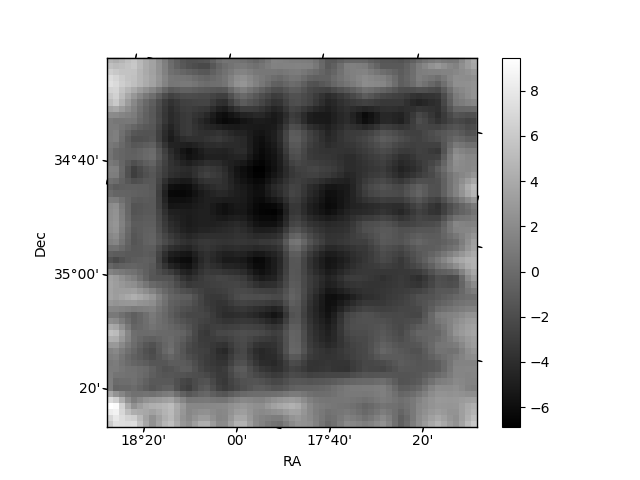
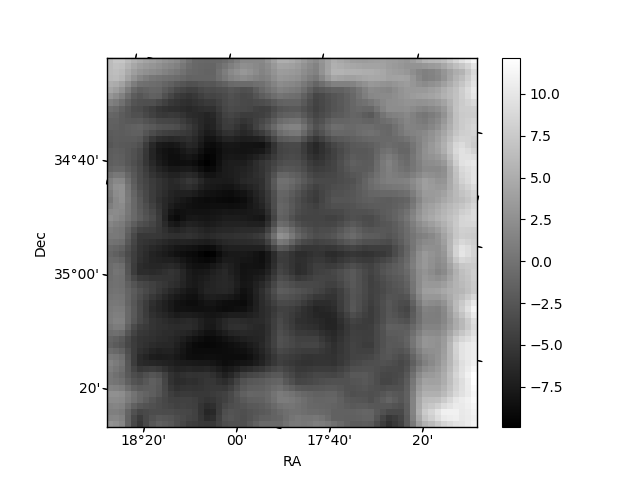
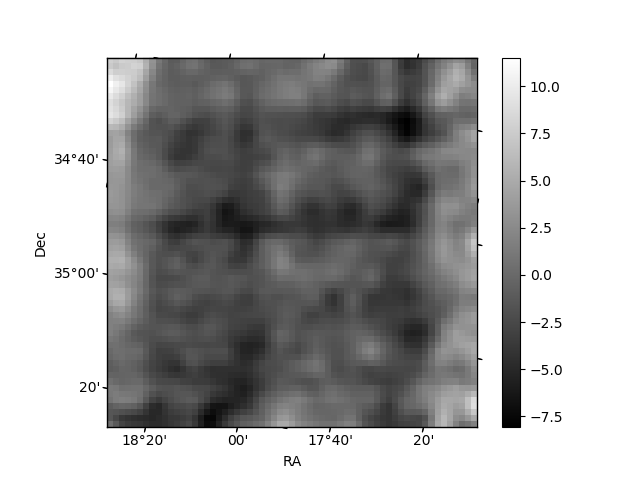
Histogram calculated using DETX and DETY for each event in the final _common_clean file
| Quadrant A | 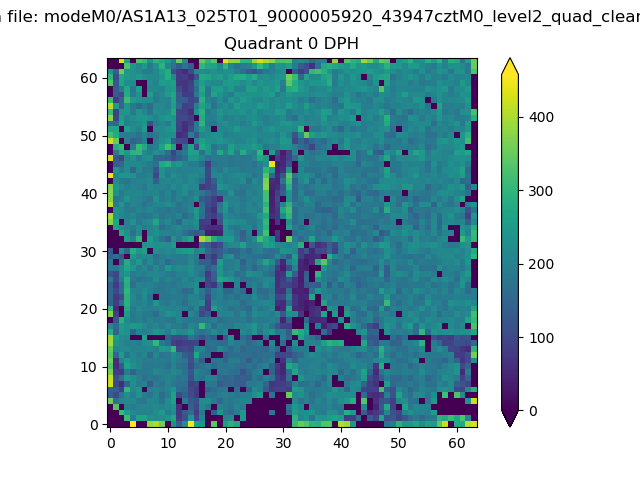 |
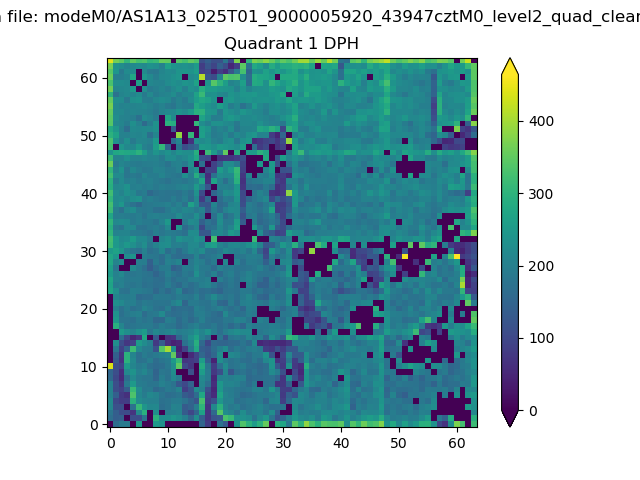 |
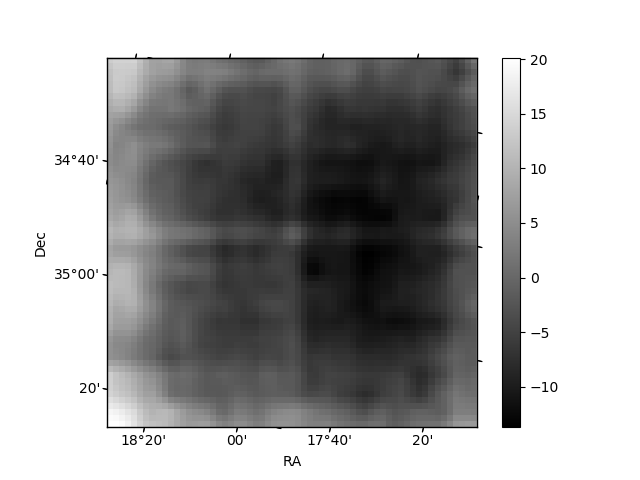
Quadrant B |
|---|---|---|---|
| Quadrant D | 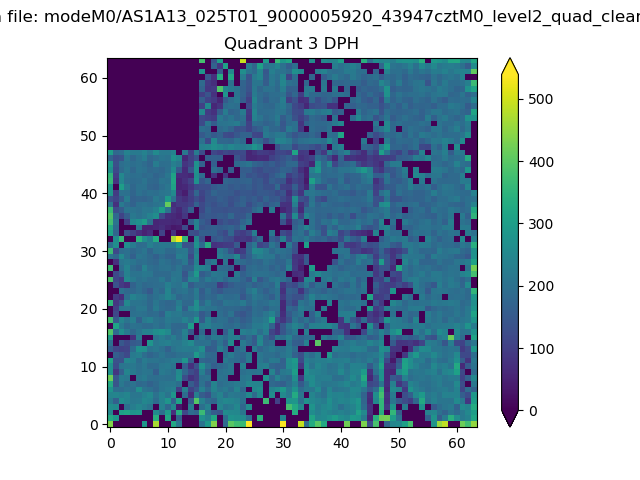 |
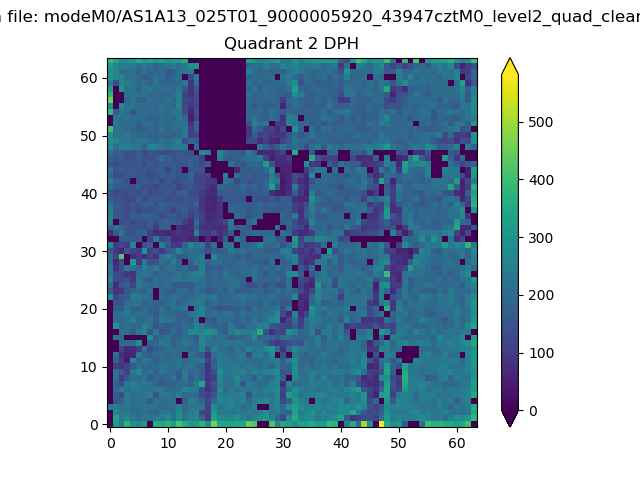 |
Quadrant C |
| Plot type | Count rate plots | Images |
|---|---|---|
| Comparison with Poisson distribution Blue bars denote a histogram of data divided into 1 sec bins. Red curve is a Poisson curve with rate = median count rate of data. |
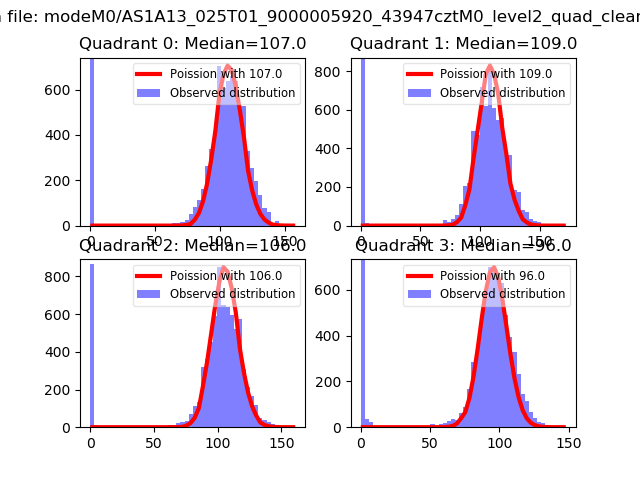 |
 |
| Quadrant-wise count rates Data is divided into 100 sec bins |
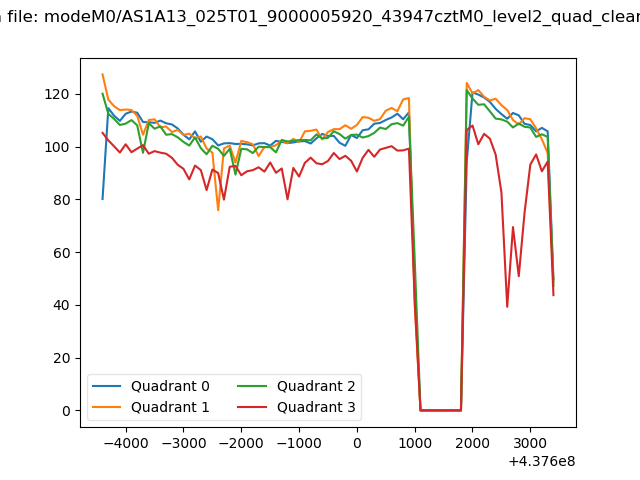 |
|
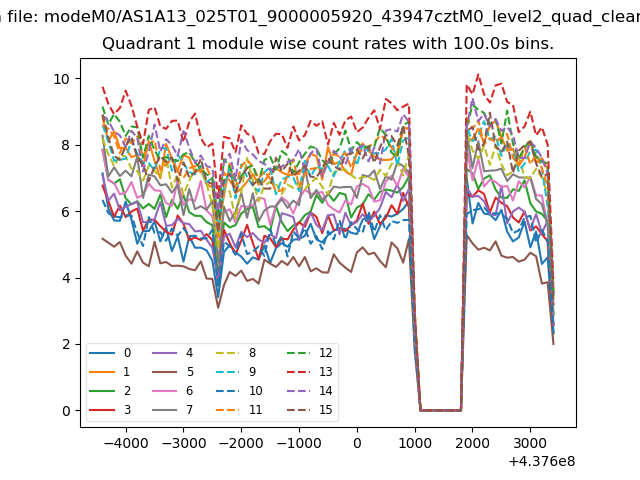
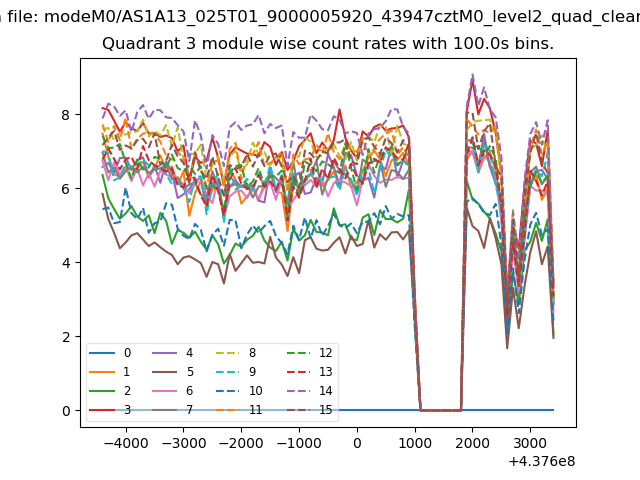
| Module-wise count rates for Quadrant A Data is divided into 100 sec bins |
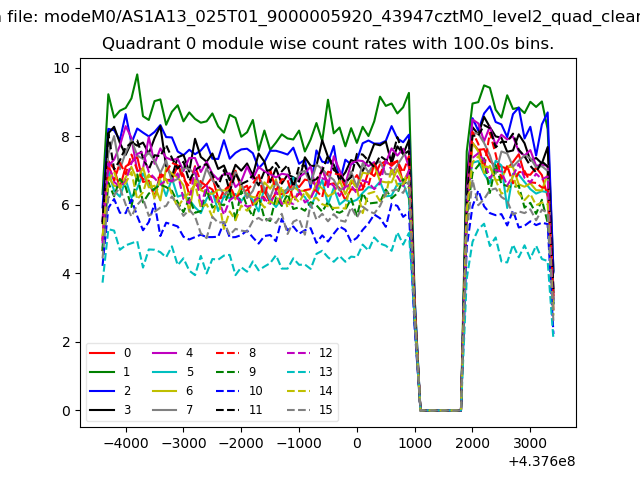 |
 |
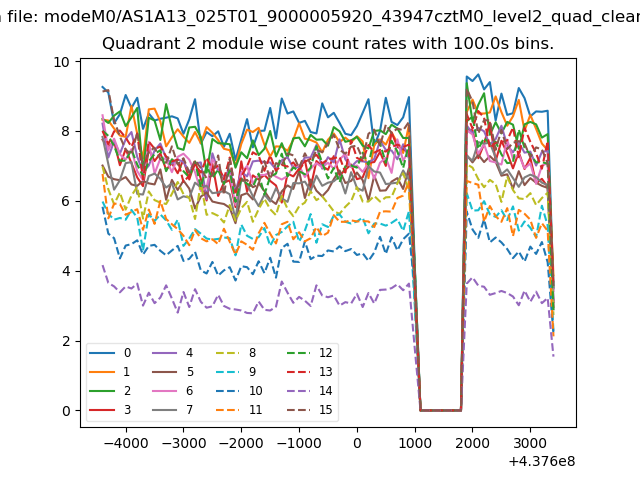
| Module-wise count rates for Quadrant B Data is divided into 100 sec bins |
 |
 |
| Module-wise count rates for Quadrant C Data is divided into 100 sec bins |
 |
 |
| Module-wise count rates for Quadrant D Data is divided into 100 sec bins |
 |
 |
| Parameter | Plot |
|---|---|
| CZT HV Monitor | 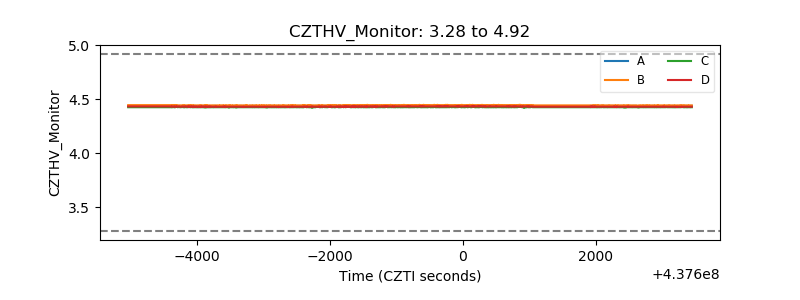 |
| D_VDD | 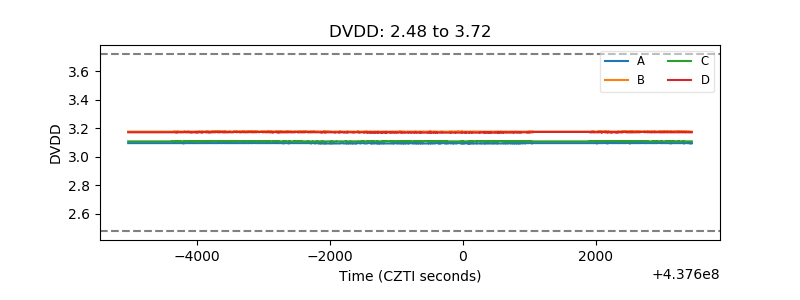 |
| Temperature 1 | 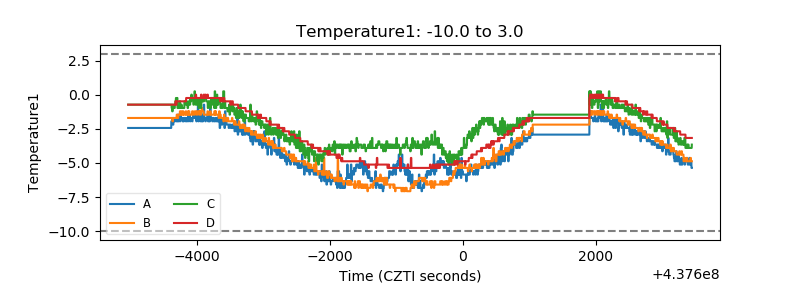 |
| Veto HV Monitor | 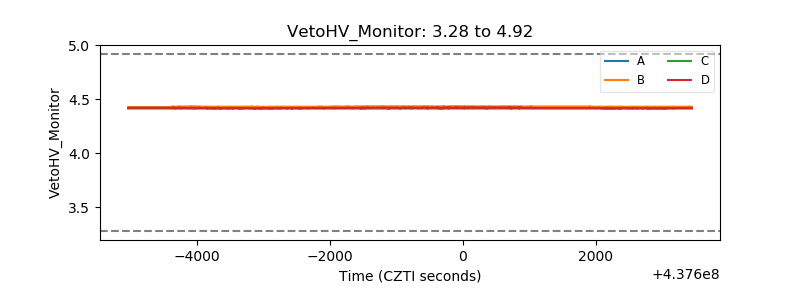 |
| Veto LLD | 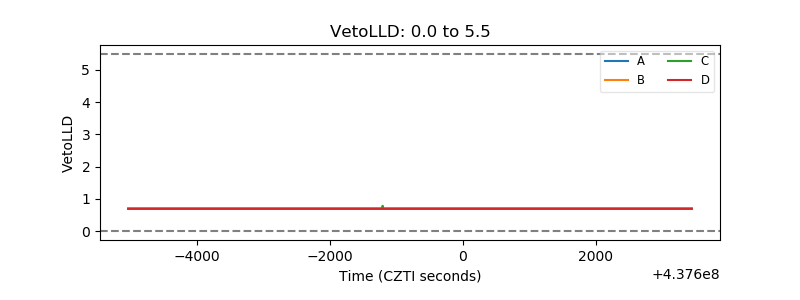 |
| Alpha Counter | 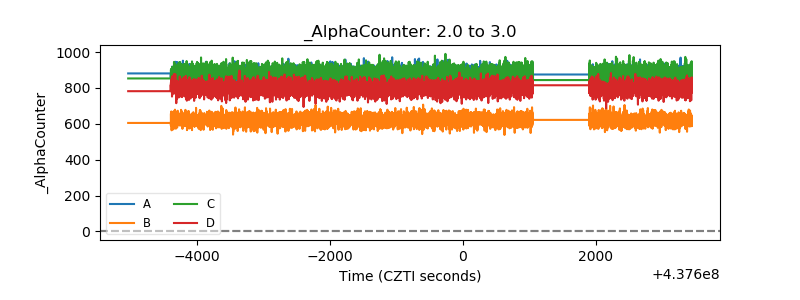 |
| _CPM_Rate | 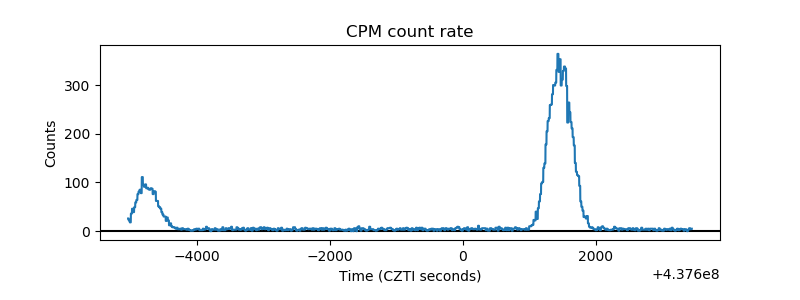 |
| CZT Counter | 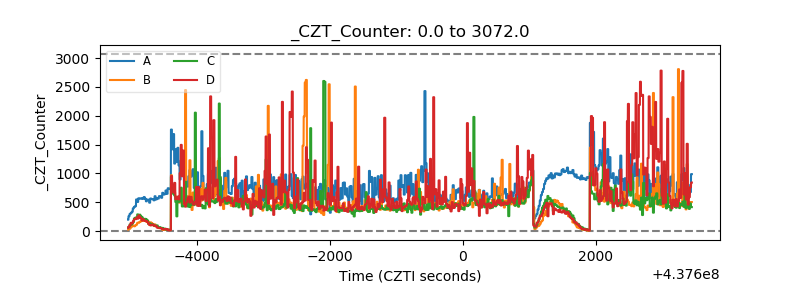 |
| +2.5 Volts monitor | 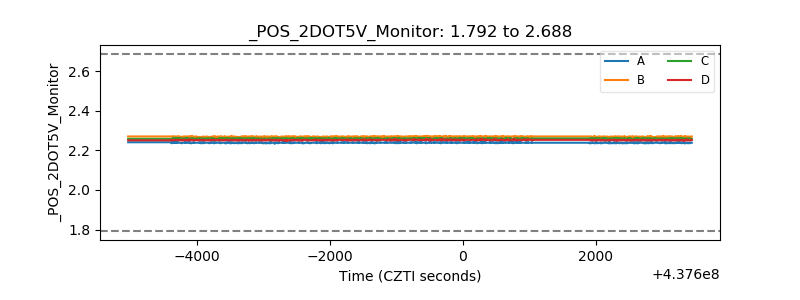 |
| +5 Volts monitor | 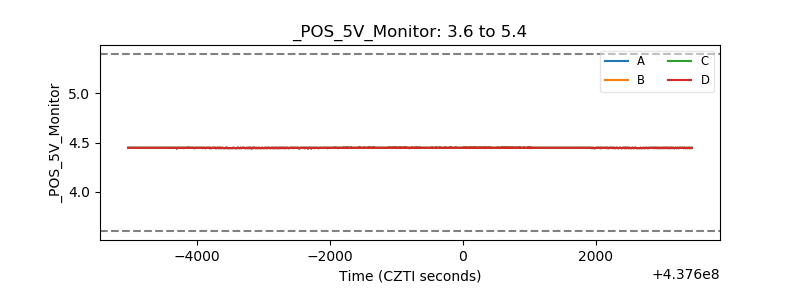 |
| _ROLL_ROT | 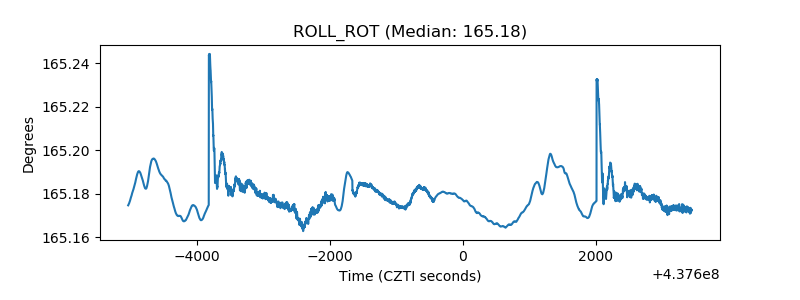 |
| _Roll_DEC | 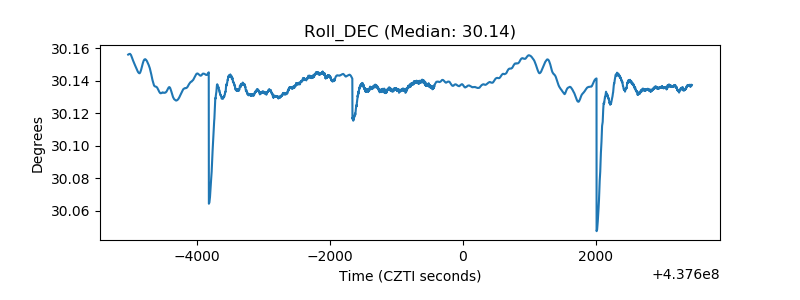 |
| _Roll_RA | 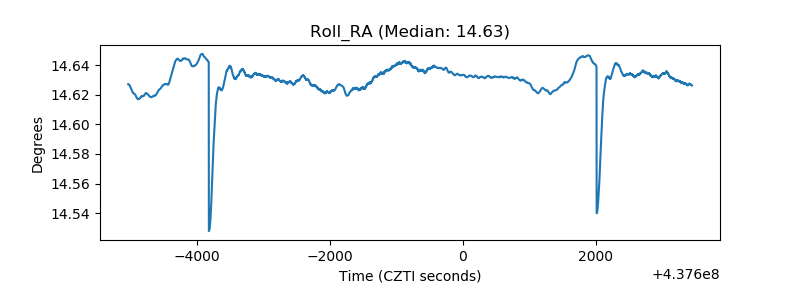 |
| Veto Counter | 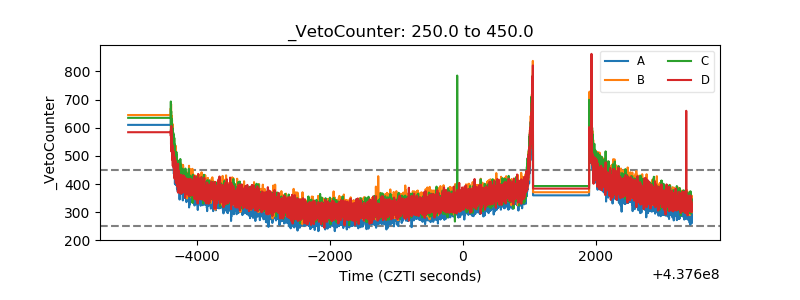 |