| Param | Original file | Final file |
|---|---|---|
| Filename | modeM0/AS1A13_025T01_9000005920_43949cztM0_level2.fits | modeM0/AS1A13_025T01_9000005920_43949cztM0_level2_quad_clean.evt |
| Size (bytes) | 499,570,560 | 106,859,520 |
| Size | 476.4 MB | 101.9 MB |
| Events in quadrant A | 6,116,204 | 705,192 |
| Events in quadrant B | 3,552,577 | 731,522 |
| Events in quadrant C | 3,367,540 | 710,802 |
| Events in quadrant D | 4,942,469 | 626,037 |
| Mode M9 | |||
|---|---|---|---|
| Quadrant | BADHDUFLAG | Total packets | Discarded packets |
| A | 0 | 14 | 0 |
| B | 0 | 15 | 0 |
| C | 0 | 15 | 0 |
| D | 0 | 15 | 0 |
| Mode SS | |||
|---|---|---|---|
| Quadrant | BADHDUFLAG | Total packets | Discarded packets |
| A | 0 | 134 | 0 |
| B | 0 | 134 | 0 |
| C | 0 | 134 | 0 |
| D | 0 | 134 | 0 |
| Mode M0 | |||
|---|---|---|---|
| Quadrant | BADHDUFLAG | Total packets | Discarded packets |
| A | 0 | 22920 | 2 |
| B | 0 | 15122 | 2 |
| C | 0 | 14665 | 2 |
| D | 0 | 19300 | 2 |
| Quadrant | Total seconds | Saturated seconds | Saturation percentage |
|---|---|---|---|
| A | 6623 | 240 | 3.623735% |
| B | 6623 | 96 | 1.449494% |
| C | 6623 | 42 | 0.634154% |
| D | 6623 | 410 | 6.190548% |
Noise dominated data is calculated using 1-second bins in cleaned event files. If a bin has >2000 counts, and if more than 50% of those come from <1% of pixels, then it is considered to be noise-dominated and hence unusable.
| Quadrant | # 1 sec bins | Bins with >0 counts | Bins with >2000 counts | High rate bins dominated by noise | Noise dominated (total time) | Noise dominated (detector-on time) | Marked lightcurve |
|---|---|---|---|---|---|---|---|
| A | 7643 | 6624 | 133 | 133 | 1.74% | 2.01% | 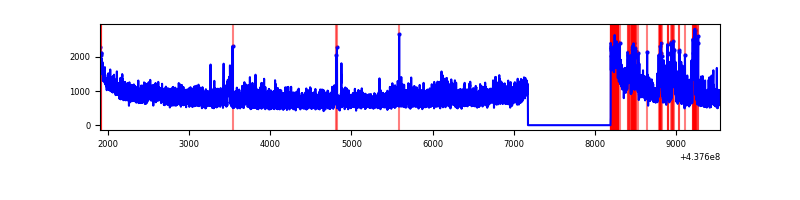 |
| B | 7643 | 6624 | 40 | 40 | 0.52% | 0.60% | 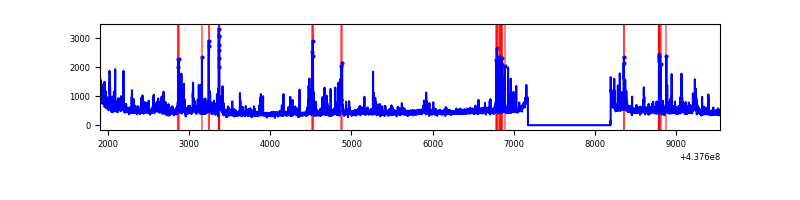 |
| C | 7643 | 6624 | 30 | 30 | 0.39% | 0.45% | 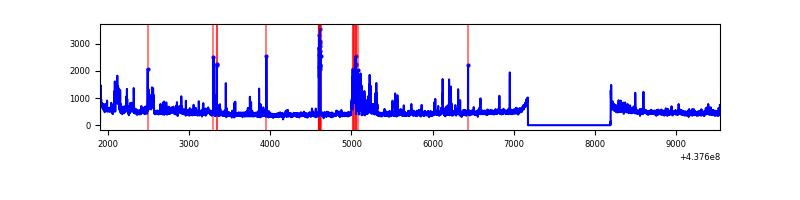 |
| D | 7643 | 6624 | 379 | 379 | 4.96% | 5.72% | 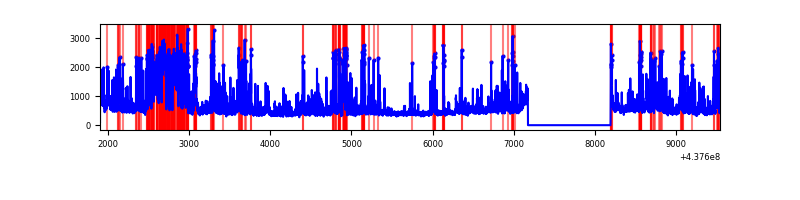 |
Top three noisy pixels from each quadrant. If the there are fewer than three noisy pixels in the level2.evt file, extra rows are filled as -1
| Pixel properties | Quadrant properties | ||||||
|---|---|---|---|---|---|---|---|
| Quadrant | DetID | PixID | Counts | Sigma | Mean | Median | Sigma |
| A | 15 | 222 | 1579586 | 10572.26 | 724 | 709 | 149.3 |
| A | 10 | 83 | 1284615 | 8597.12 | 724 | 709 | 149.3 |
| A | 15 | 223 | 396402 | 2649.59 | 724 | 709 | 149.3 |
| B | 0 | 200 | 213395 | 1493.46 | 729 | 707 | 142.4 |
| B | 5 | 172 | 114769 | 800.93 | 729 | 707 | 142.4 |
| B | 0 | 213 | 87584 | 610.04 | 729 | 707 | 142.4 |
| C | 1 | 241 | 348689 | 2051.74 | 722 | 728 | 169.6 |
| C | 3 | 233 | 158369 | 929.53 | 722 | 728 | 169.6 |
| C | 14 | 254 | 23015 | 131.41 | 722 | 728 | 169.6 |
| D | 7 | 204 | 702168 | 3972.52 | 703 | 681 | 176.6 |
| D | 5 | 235 | 444424 | 2512.92 | 703 | 681 | 176.6 |
| D | 1 | 52 | 318734 | 1801.14 | 703 | 681 | 176.6 |
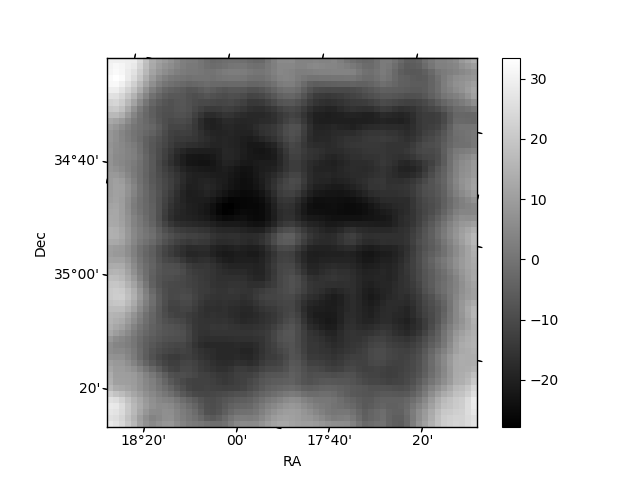
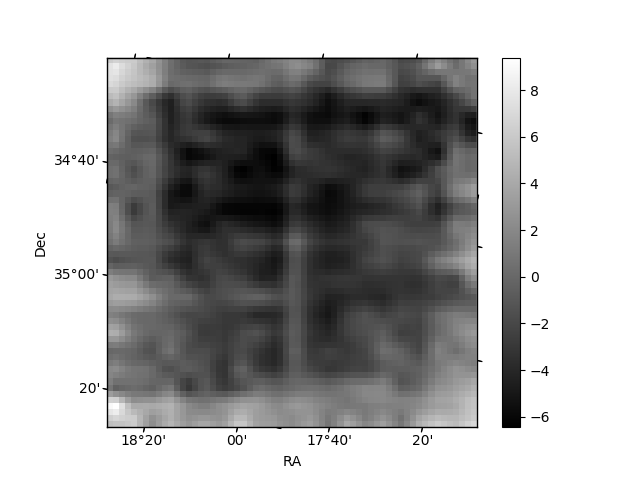
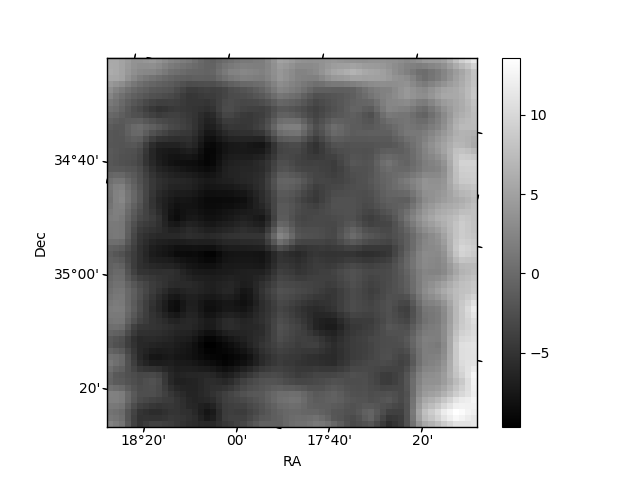
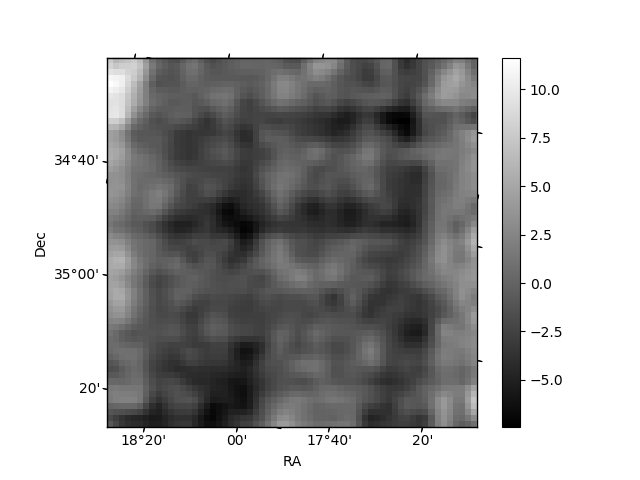
Histogram calculated using DETX and DETY for each event in the final _common_clean file
| Quadrant A | 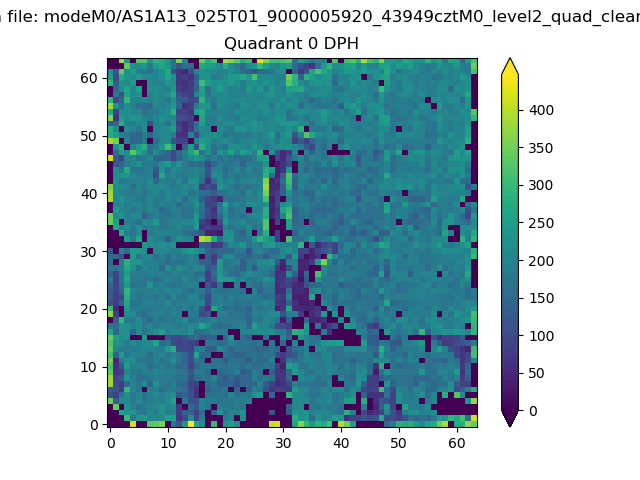 |
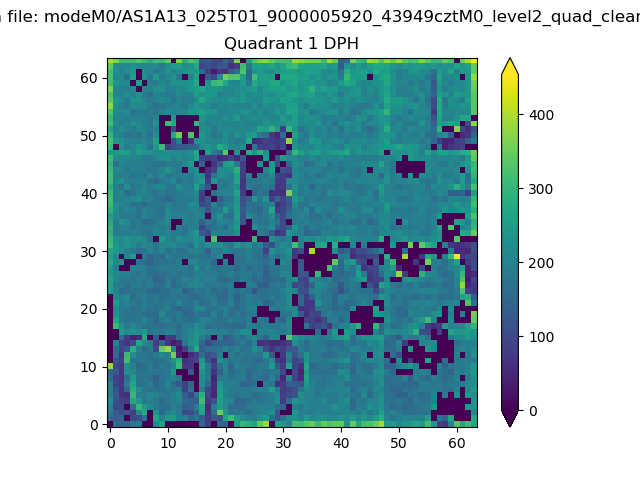 |
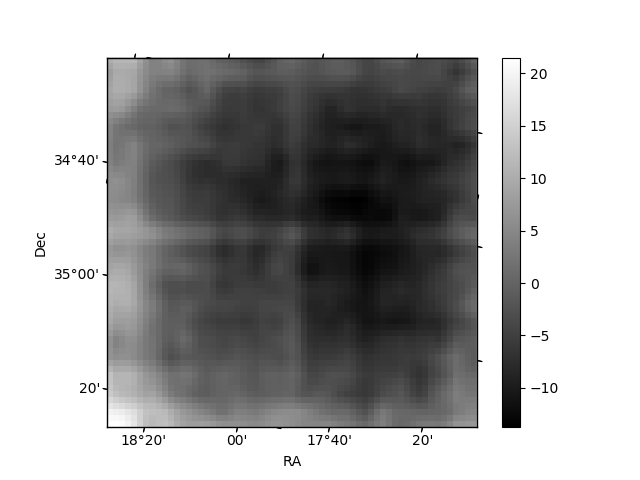
Quadrant B |
|---|---|---|---|
| Quadrant D | 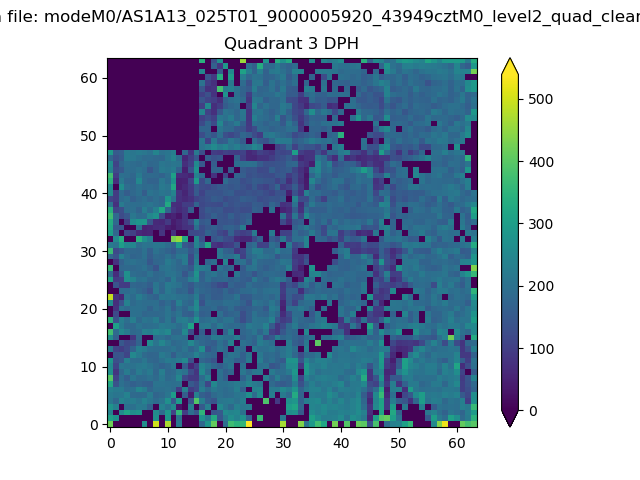 |
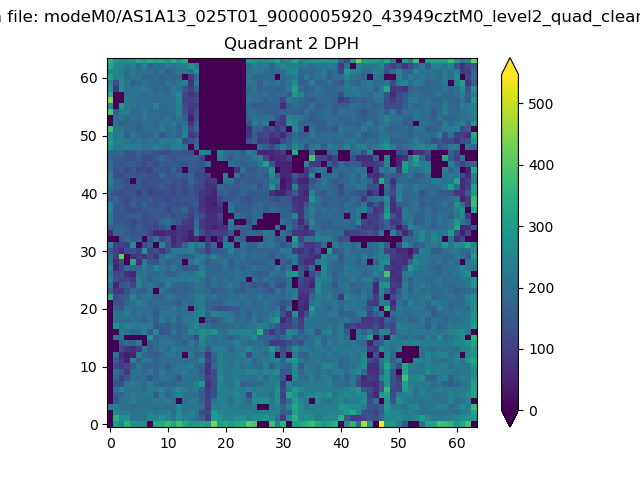 |
Quadrant C |
| Plot type | Count rate plots | Images |
|---|---|---|
| Comparison with Poisson distribution Blue bars denote a histogram of data divided into 1 sec bins. Red curve is a Poisson curve with rate = median count rate of data. |
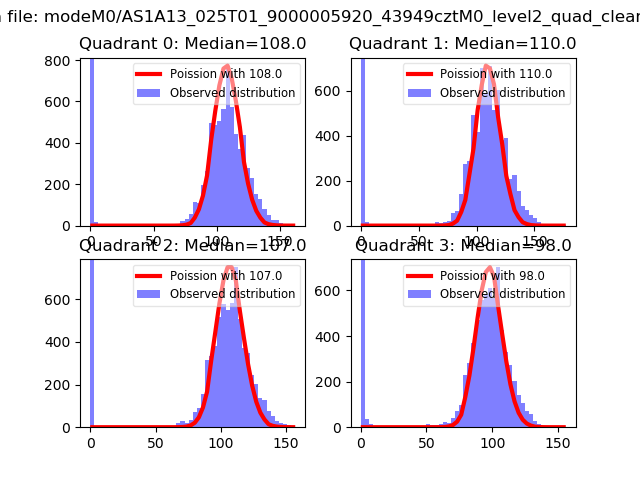 |
 |
| Quadrant-wise count rates Data is divided into 100 sec bins |
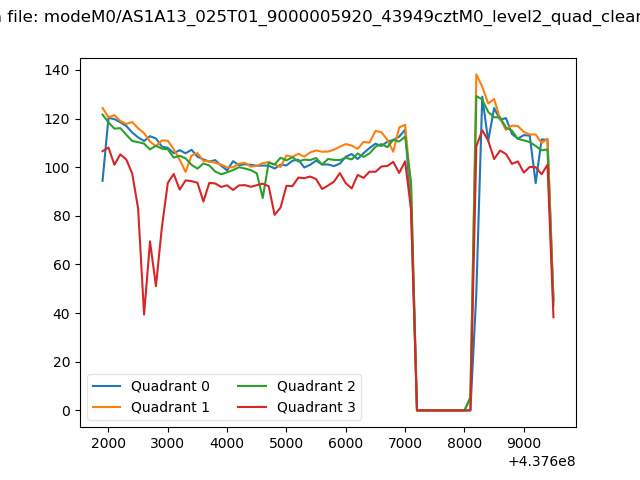 |
|
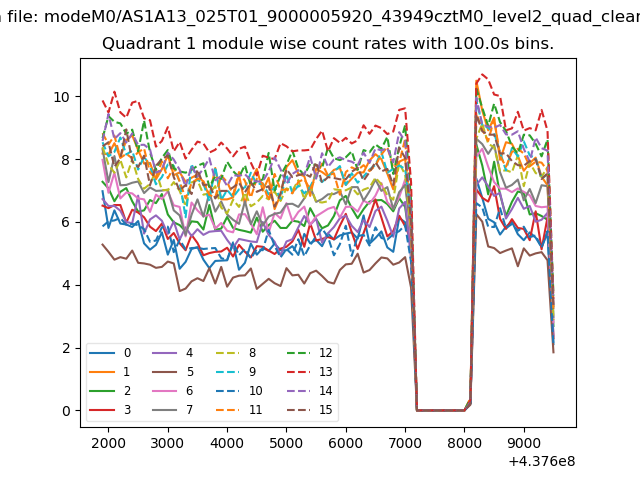
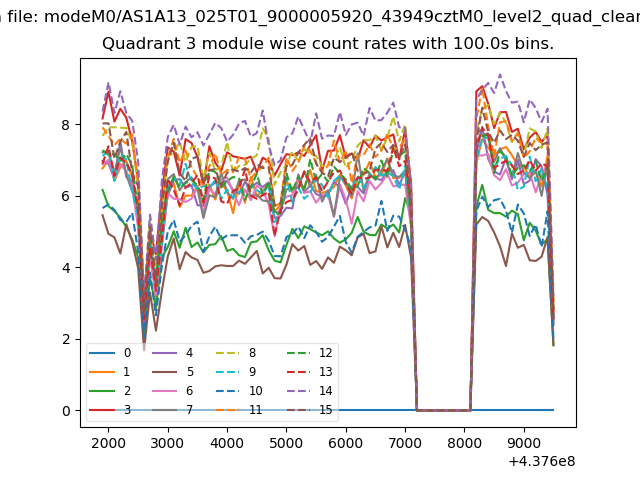
| Module-wise count rates for Quadrant A Data is divided into 100 sec bins |
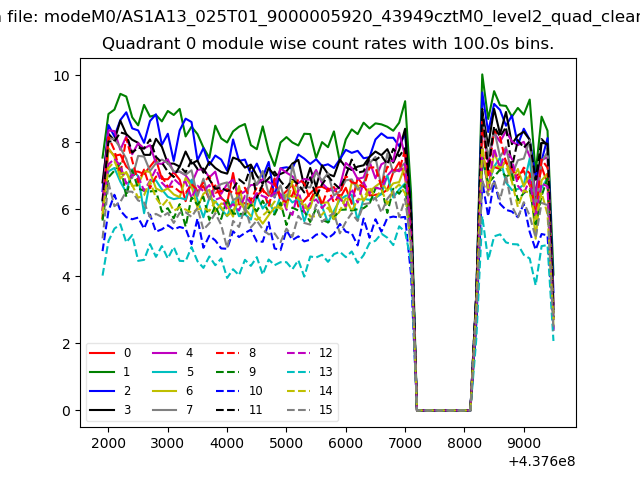 |
 |
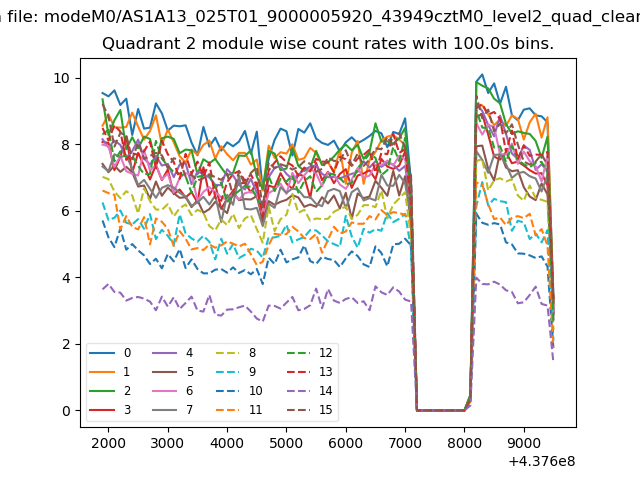
| Module-wise count rates for Quadrant B Data is divided into 100 sec bins |
 |
 |
| Module-wise count rates for Quadrant C Data is divided into 100 sec bins |
 |
 |
| Module-wise count rates for Quadrant D Data is divided into 100 sec bins |
 |
 |
| Parameter | Plot |
|---|---|
| CZT HV Monitor | 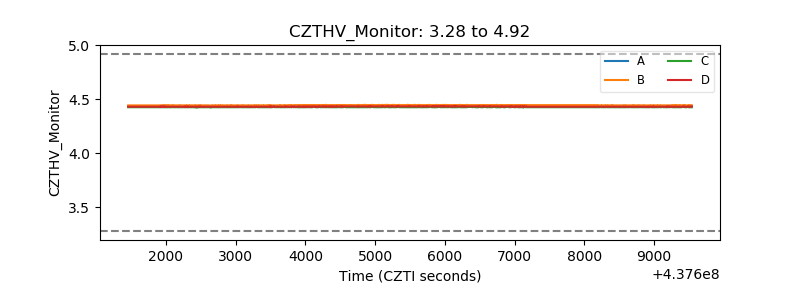 |
| D_VDD | 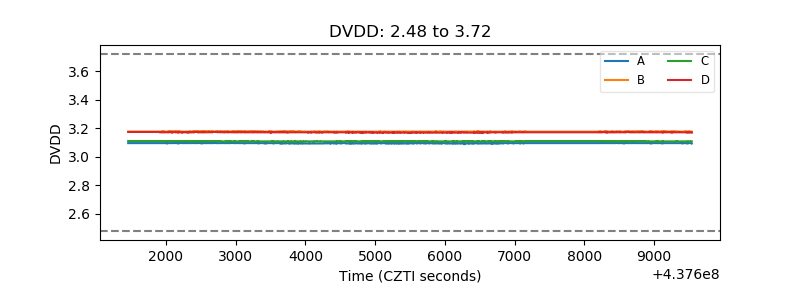 |
| Temperature 1 | 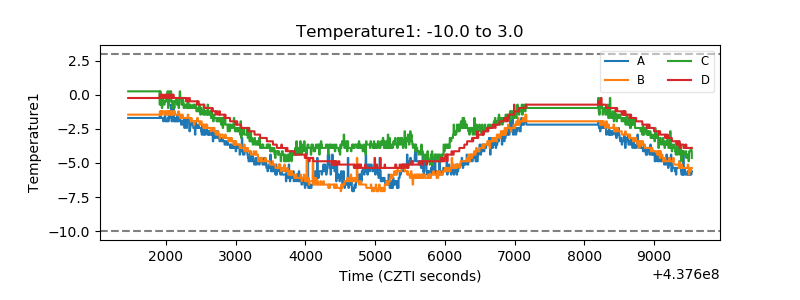 |
| Veto HV Monitor |  |
| Veto LLD | 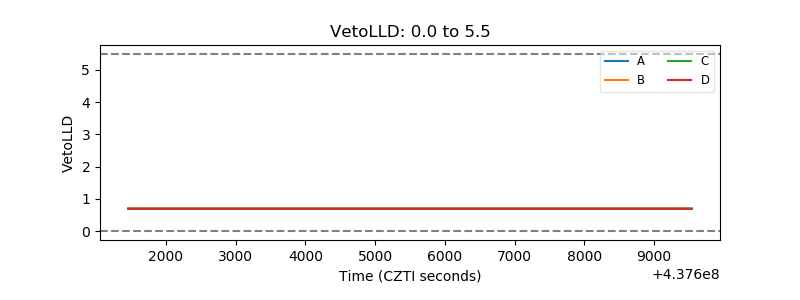 |
| Alpha Counter | 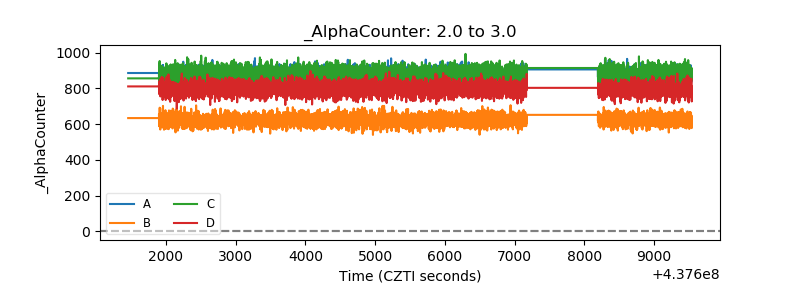 |
| _CPM_Rate | 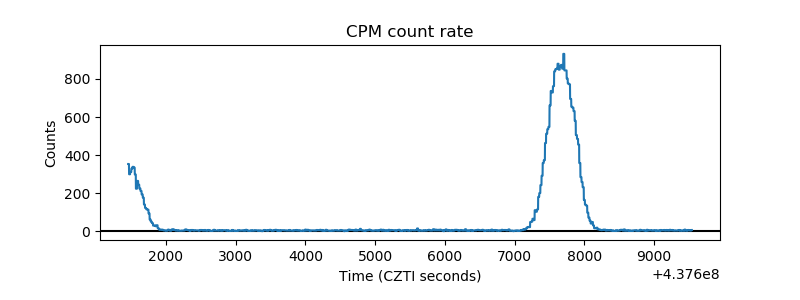 |
| CZT Counter | 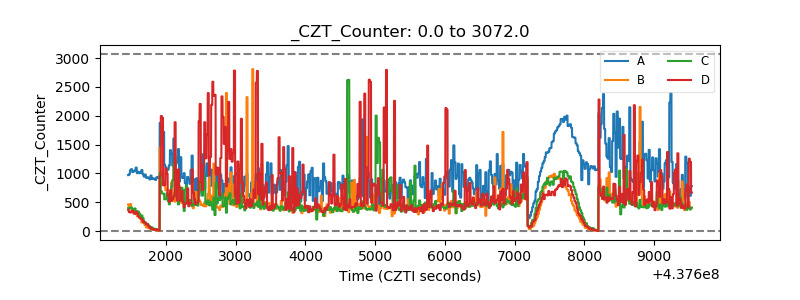 |
| +2.5 Volts monitor | 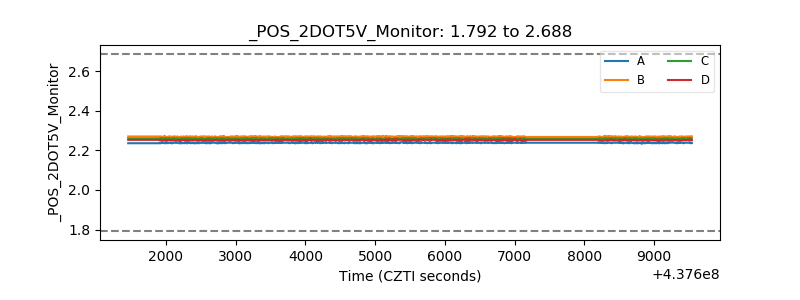 |
| +5 Volts monitor | 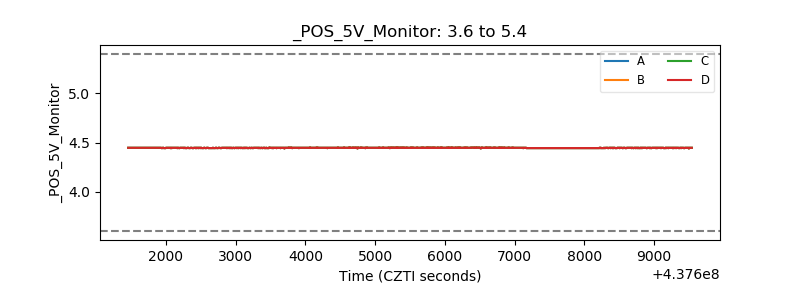 |
| _ROLL_ROT | 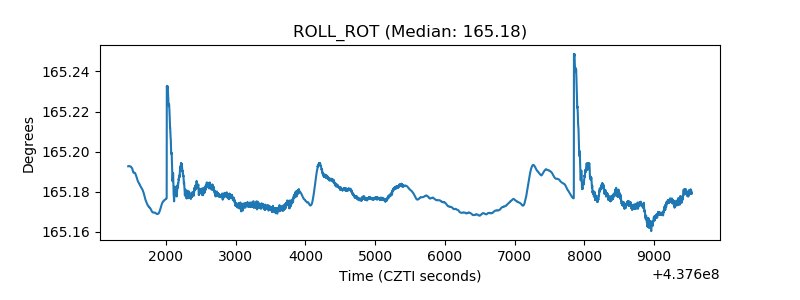 |
| _Roll_DEC | 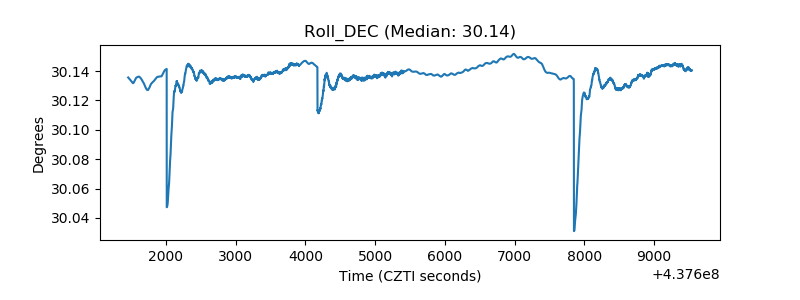 |
| _Roll_RA | 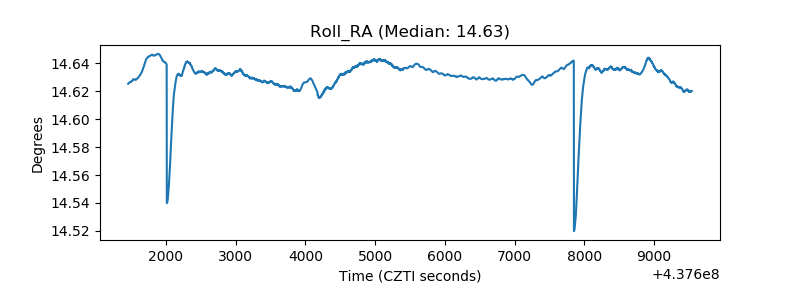 |
| Veto Counter | 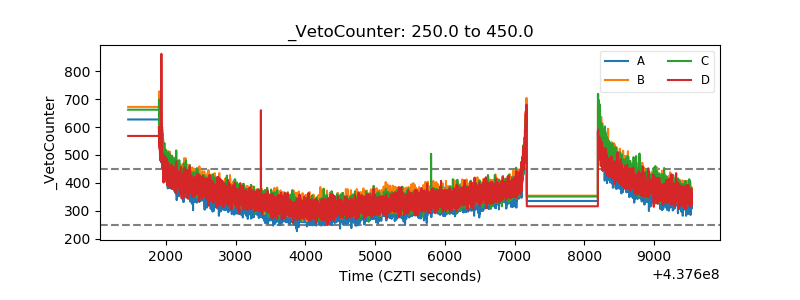 |