| Param | Original file | Final file |
|---|---|---|
| Filename | modeM0/AS1A13_025T01_9000005920_43950cztM0_level2.fits | modeM0/AS1A13_025T01_9000005920_43950cztM0_level2_quad_clean.evt |
| Size (bytes) | 486,843,840 | 108,328,320 |
| Size | 464.3 MB | 103.3 MB |
| Events in quadrant A | 5,701,841 | 717,286 |
| Events in quadrant B | 3,912,563 | 737,444 |
| Events in quadrant C | 3,194,105 | 723,864 |
| Events in quadrant D | 4,706,633 | 646,320 |
| Mode M9 | |||
|---|---|---|---|
| Quadrant | BADHDUFLAG | Total packets | Discarded packets |
| A | 0 | 15 | 0 |
| B | 0 | 16 | 0 |
| C | 0 | 16 | 0 |
| D | 0 | 16 | 0 |
| Mode SS | |||
|---|---|---|---|
| Quadrant | BADHDUFLAG | Total packets | Discarded packets |
| A | 0 | 132 | 0 |
| B | 0 | 132 | 0 |
| C | 0 | 132 | 0 |
| D | 0 | 132 | 0 |
| Mode M0 | |||
|---|---|---|---|
| Quadrant | BADHDUFLAG | Total packets | Discarded packets |
| A | 0 | 21538 | 2 |
| B | 0 | 16081 | 2 |
| C | 0 | 14018 | 2 |
| D | 0 | 18504 | 2 |
| Quadrant | Total seconds | Saturated seconds | Saturation percentage |
|---|---|---|---|
| A | 6527 | 223 | 3.416577% |
| B | 6527 | 196 | 3.002911% |
| C | 6527 | 41 | 0.628160% |
| D | 6527 | 190 | 2.910985% |
Noise dominated data is calculated using 1-second bins in cleaned event files. If a bin has >2000 counts, and if more than 50% of those come from <1% of pixels, then it is considered to be noise-dominated and hence unusable.
| Quadrant | # 1 sec bins | Bins with >0 counts | Bins with >2000 counts | High rate bins dominated by noise | Noise dominated (total time) | Noise dominated (detector-on time) | Marked lightcurve |
|---|---|---|---|---|---|---|---|
| A | 7647 | 6528 | 137 | 137 | 1.79% | 2.10% | 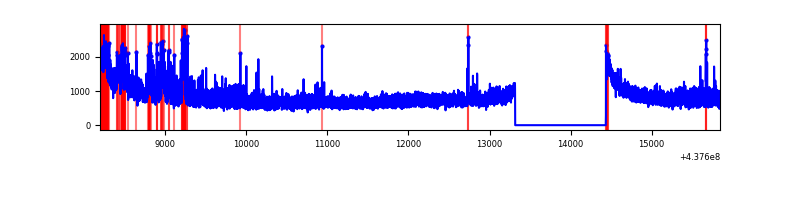 |
| B | 7647 | 6528 | 130 | 130 | 1.70% | 1.99% | 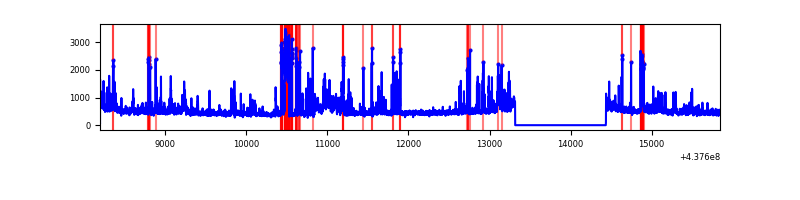 |
| C | 7647 | 6528 | 21 | 21 | 0.27% | 0.32% | 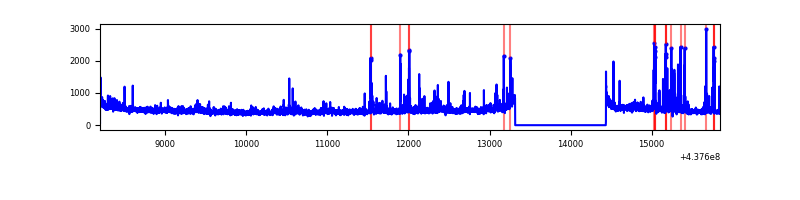 |
| D | 7647 | 6528 | 168 | 168 | 2.20% | 2.57% | 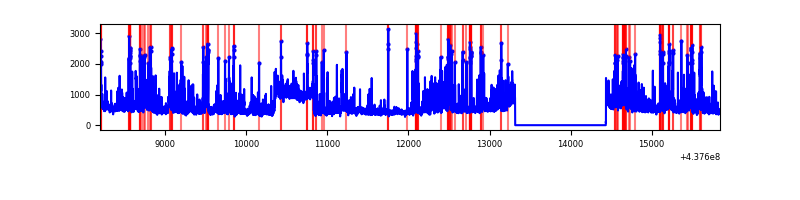 |
Top three noisy pixels from each quadrant. If the there are fewer than three noisy pixels in the level2.evt file, extra rows are filled as -1
| Pixel properties | Quadrant properties | ||||||
|---|---|---|---|---|---|---|---|
| Quadrant | DetID | PixID | Counts | Sigma | Mean | Median | Sigma |
| A | 10 | 83 | 1241631 | 8338.13 | 721 | 706 | 148.8 |
| A | 15 | 222 | 1235432 | 8296.48 | 721 | 706 | 148.8 |
| A | 15 | 223 | 380759 | 2553.68 | 721 | 706 | 148.8 |
| B | 5 | 235 | 490211 | 3469.97 | 722 | 701 | 141.1 |
| B | 4 | 171 | 142687 | 1006.49 | 722 | 701 | 141.1 |
| B | 0 | 200 | 111754 | 787.22 | 722 | 701 | 141.1 |
| C | 14 | 254 | 145288 | 855.01 | 719 | 722 | 169.1 |
| C | 3 | 233 | 128549 | 756.01 | 719 | 722 | 169.1 |
| C | 1 | 241 | 86394 | 506.69 | 719 | 722 | 169.1 |
| D | 5 | 235 | 614495 | 3422.68 | 706 | 685 | 179.3 |
| D | 4 | 235 | 295223 | 1642.38 | 706 | 685 | 179.3 |
| D | 12 | 17 | 193549 | 1075.43 | 706 | 685 | 179.3 |
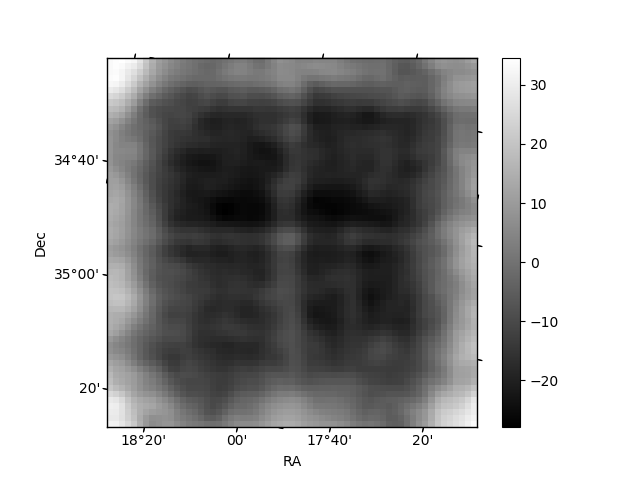
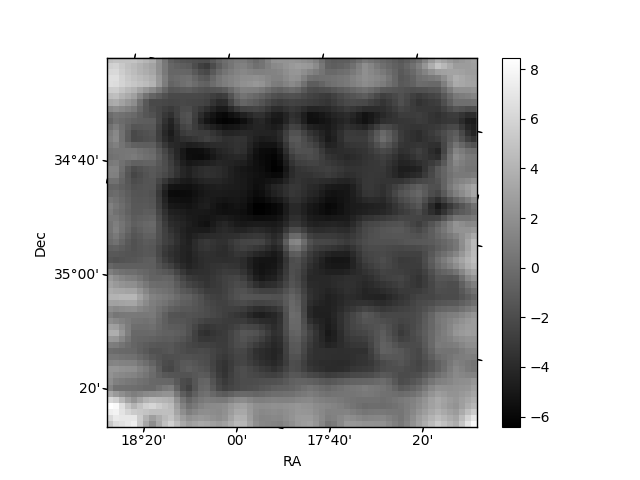
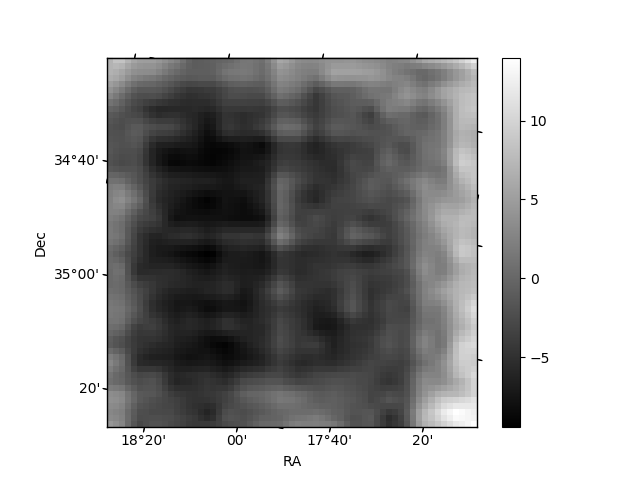
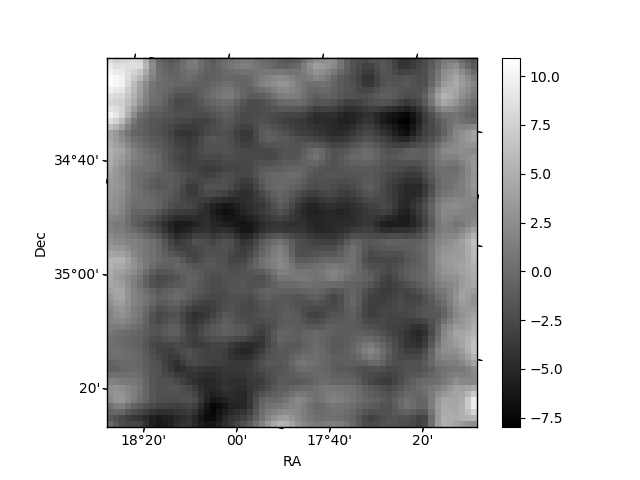
Histogram calculated using DETX and DETY for each event in the final _common_clean file
| Quadrant A | 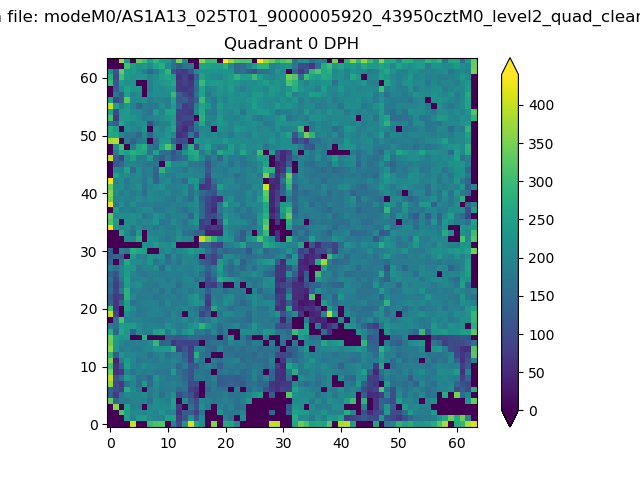 |
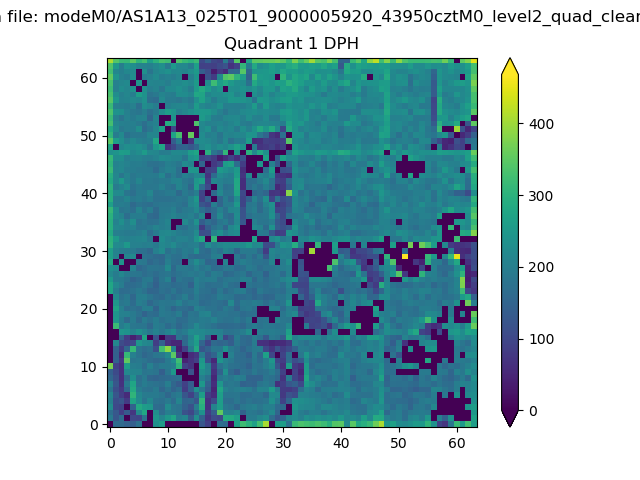 |
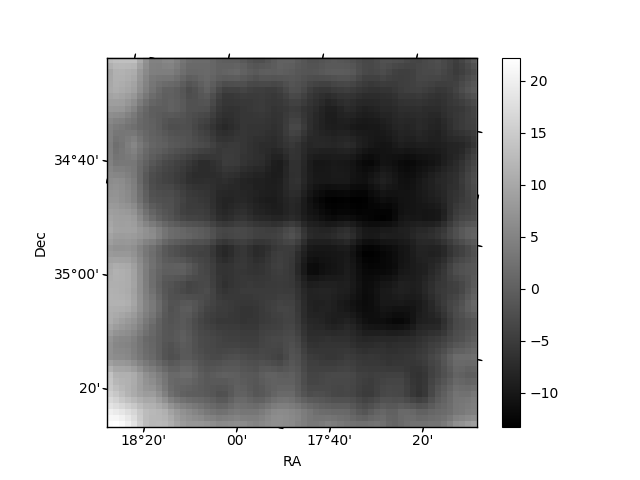
Quadrant B |
|---|---|---|---|
| Quadrant D | 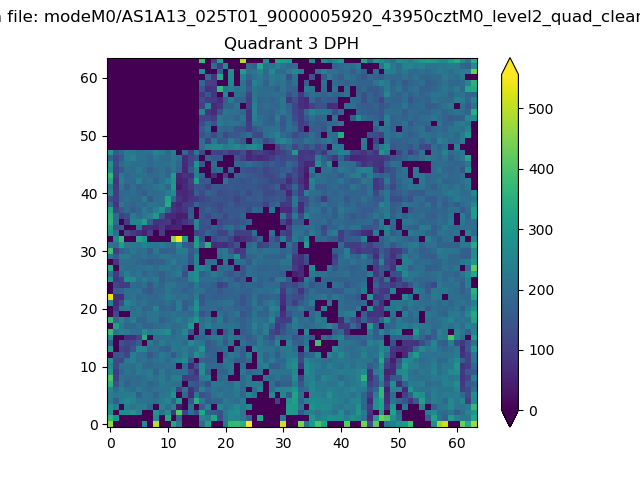 |
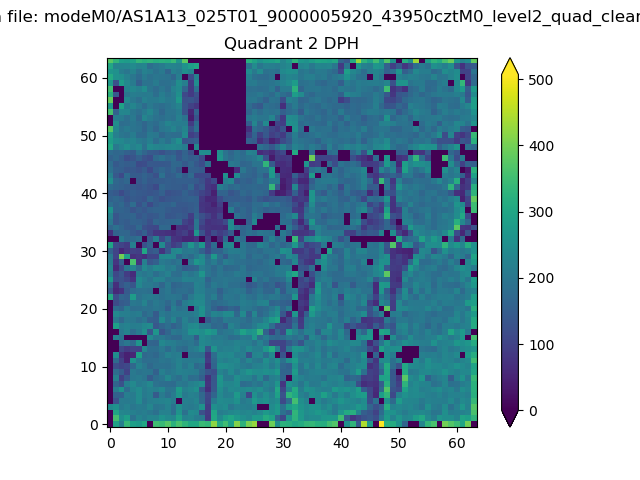 |
Quadrant C |
| Plot type | Count rate plots | Images |
|---|---|---|
| Comparison with Poisson distribution Blue bars denote a histogram of data divided into 1 sec bins. Red curve is a Poisson curve with rate = median count rate of data. |
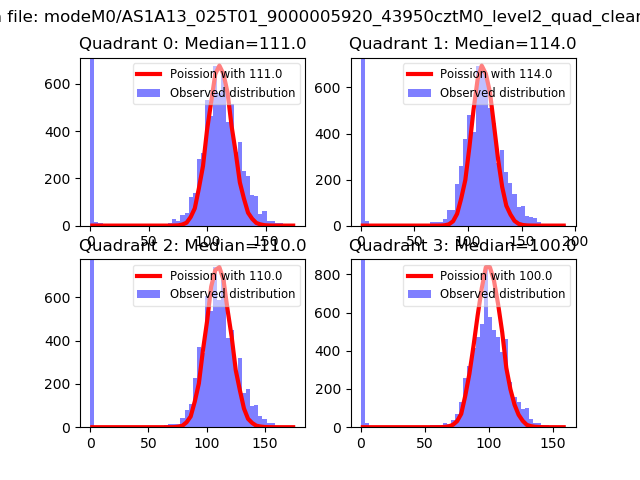 |
 |
| Quadrant-wise count rates Data is divided into 100 sec bins |
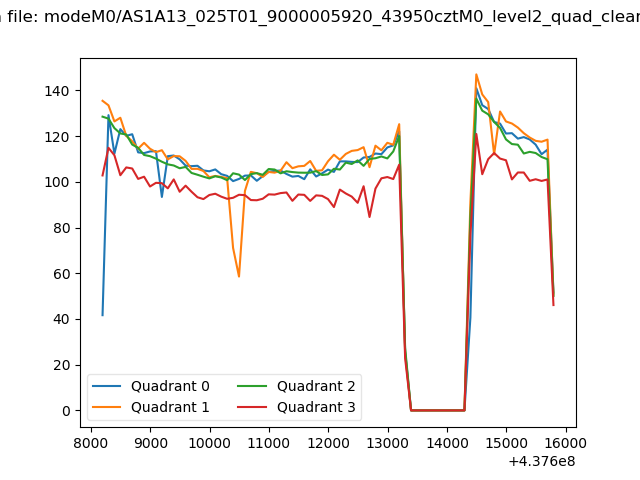 |
|
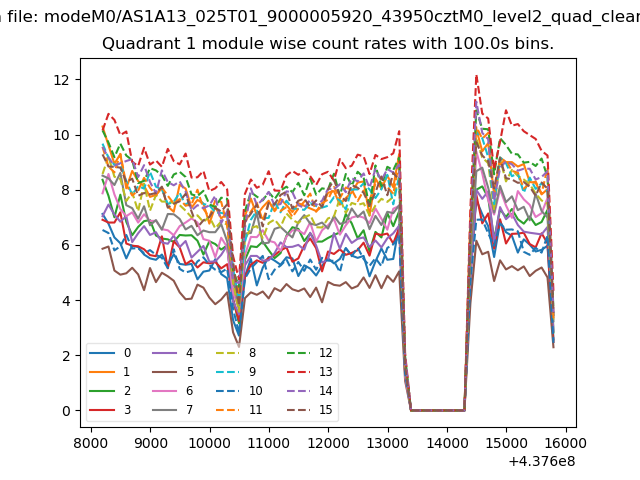
| Module-wise count rates for Quadrant A Data is divided into 100 sec bins |
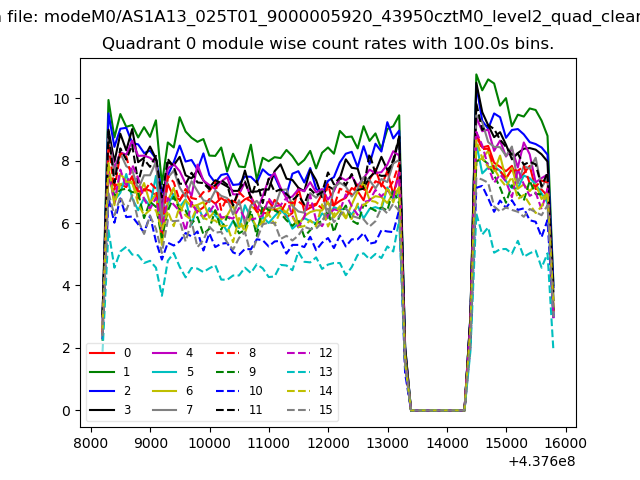 |
 |
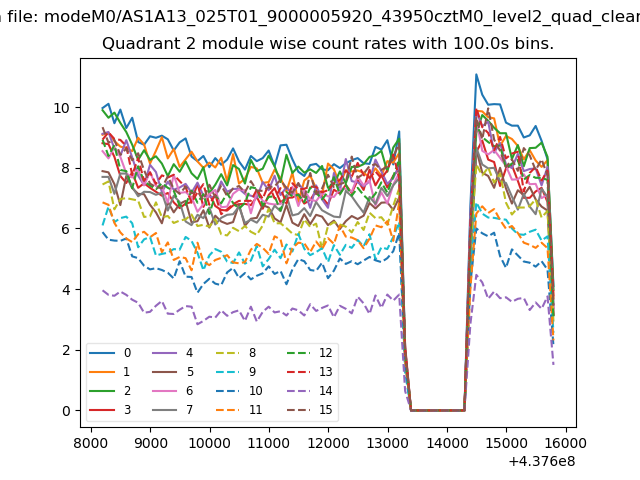
| Module-wise count rates for Quadrant B Data is divided into 100 sec bins |
 |
 |
| Module-wise count rates for Quadrant C Data is divided into 100 sec bins |
 |
 |
| Module-wise count rates for Quadrant D Data is divided into 100 sec bins |
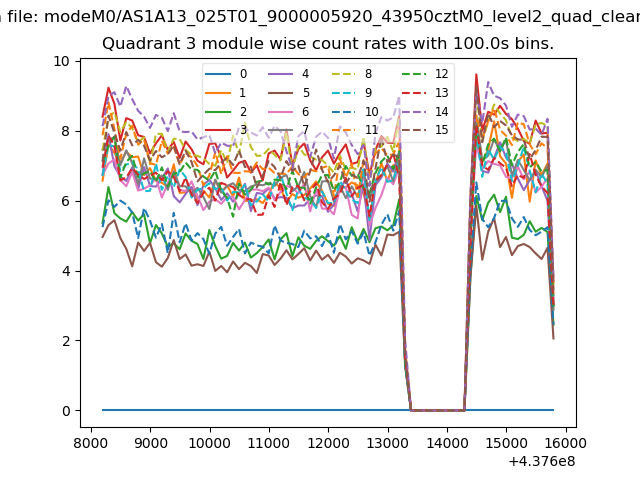 |
 |
| Parameter | Plot |
|---|---|
| CZT HV Monitor | 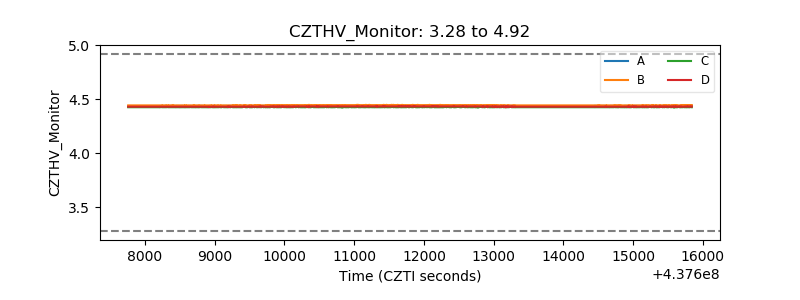 |
| D_VDD | 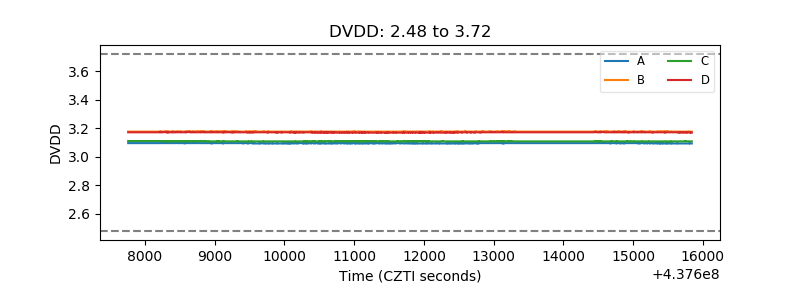 |
| Temperature 1 | 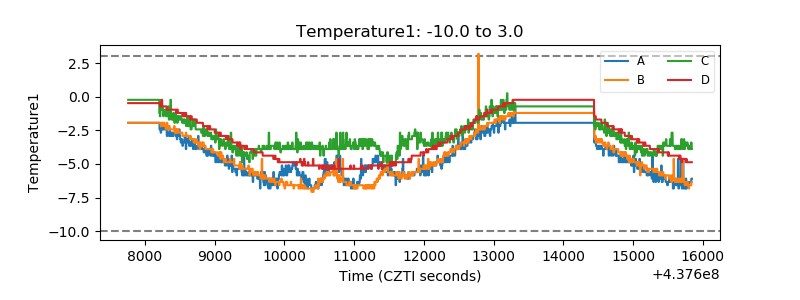 |
| Veto HV Monitor | 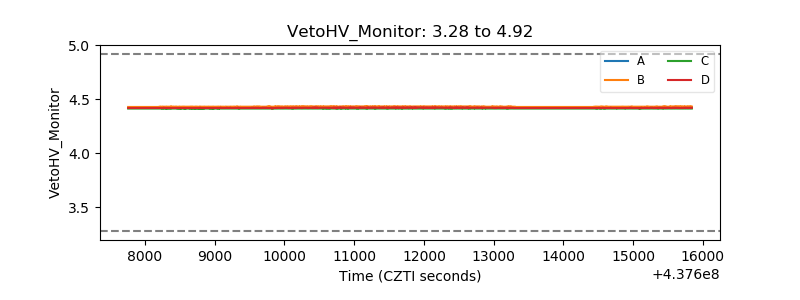 |
| Veto LLD | 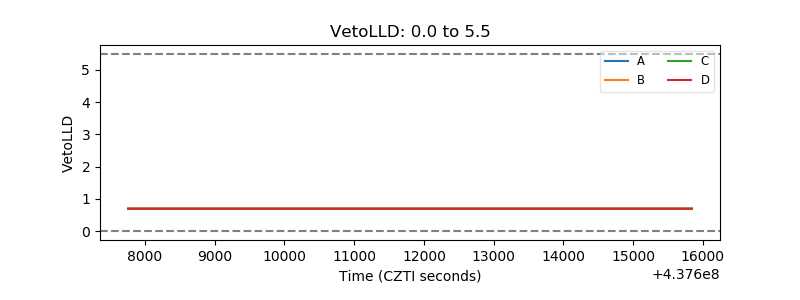 |
| Alpha Counter | 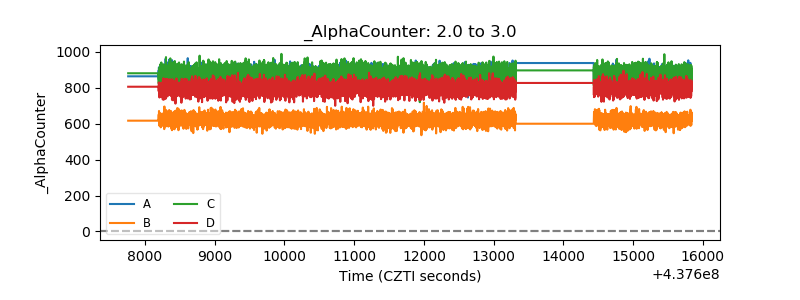 |
| _CPM_Rate | 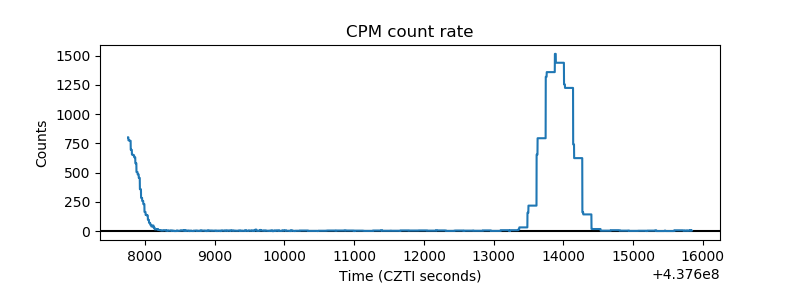 |
| CZT Counter | 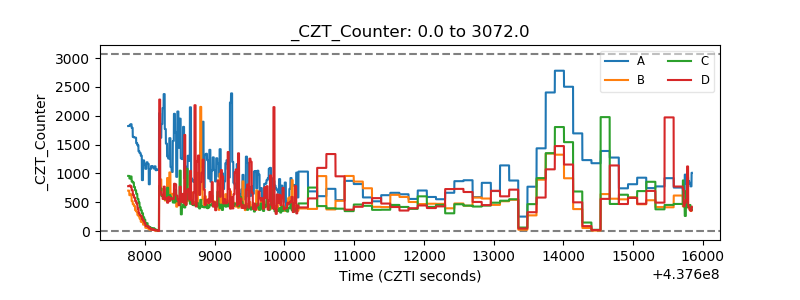 |
| +2.5 Volts monitor | 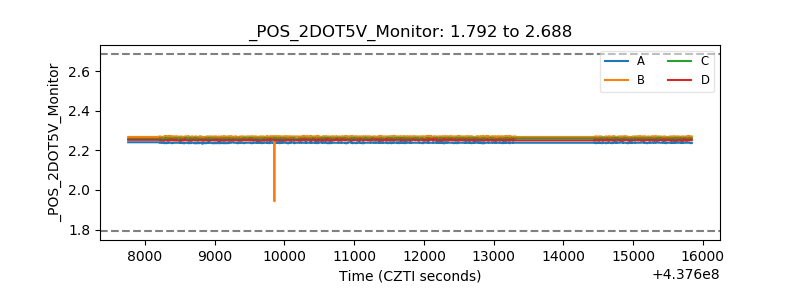 |
| +5 Volts monitor | 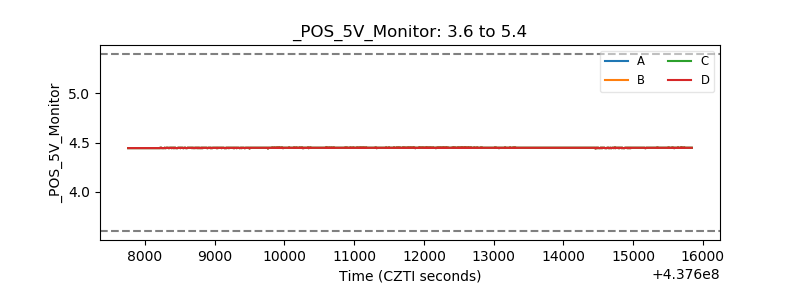 |
| _ROLL_ROT | 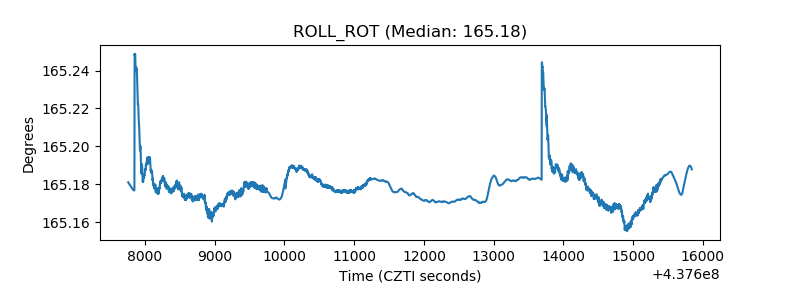 |
| _Roll_DEC | 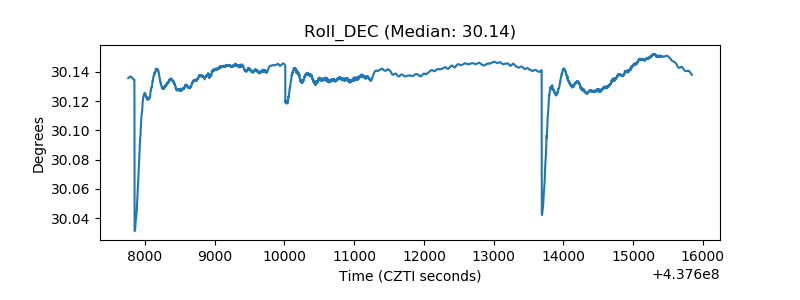 |
| _Roll_RA | 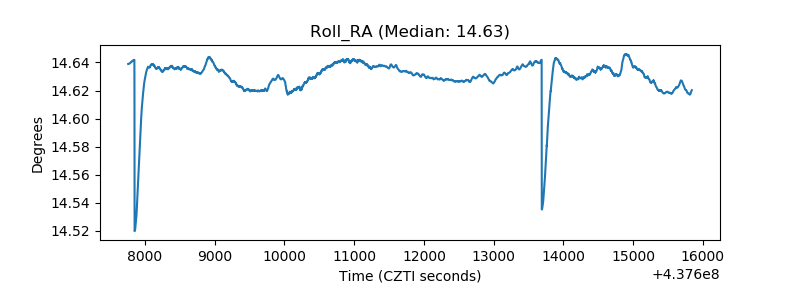 |
| Veto Counter | 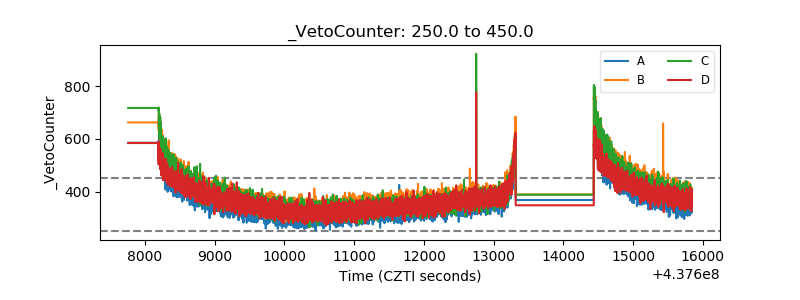 |