| Param | Original file | Final file |
|---|---|---|
| Filename | modeM0/AS1A13_025T01_9000005920_43951cztM0_level2.fits | modeM0/AS1A13_025T01_9000005920_43951cztM0_level2_quad_clean.evt |
| Size (bytes) | 465,013,440 | 108,843,840 |
| Size | 443.5 MB | 103.8 MB |
| Events in quadrant A | 5,361,028 | 729,122 |
| Events in quadrant B | 3,455,892 | 757,706 |
| Events in quadrant C | 3,530,585 | 719,201 |
| Events in quadrant D | 4,371,061 | 644,843 |
| Mode M9 | |||
|---|---|---|---|
| Quadrant | BADHDUFLAG | Total packets | Discarded packets |
| A | 0 | 15 | 0 |
| B | 0 | 16 | 0 |
| C | 0 | 16 | 0 |
| D | 0 | 16 | 0 |
| Mode SS | |||
|---|---|---|---|
| Quadrant | BADHDUFLAG | Total packets | Discarded packets |
| A | 0 | 130 | 0 |
| B | 0 | 130 | 0 |
| C | 0 | 130 | 0 |
| D | 0 | 130 | 0 |
| Mode M0 | |||
|---|---|---|---|
| Quadrant | BADHDUFLAG | Total packets | Discarded packets |
| A | 0 | 20471 | 2 |
| B | 0 | 14621 | 2 |
| C | 0 | 14833 | 2 |
| D | 0 | 17400 | 2 |
| Quadrant | Total seconds | Saturated seconds | Saturation percentage |
|---|---|---|---|
| A | 6375 | 130 | 2.039216% |
| B | 6375 | 111 | 1.741176% |
| C | 6375 | 137 | 2.149020% |
| D | 6375 | 250 | 3.921569% |
Noise dominated data is calculated using 1-second bins in cleaned event files. If a bin has >2000 counts, and if more than 50% of those come from <1% of pixels, then it is considered to be noise-dominated and hence unusable.
| Quadrant | # 1 sec bins | Bins with >0 counts | Bins with >2000 counts | High rate bins dominated by noise | Noise dominated (total time) | Noise dominated (detector-on time) | Marked lightcurve |
|---|---|---|---|---|---|---|---|
| A | 7560 | 6376 | 18 | 18 | 0.24% | 0.28% | 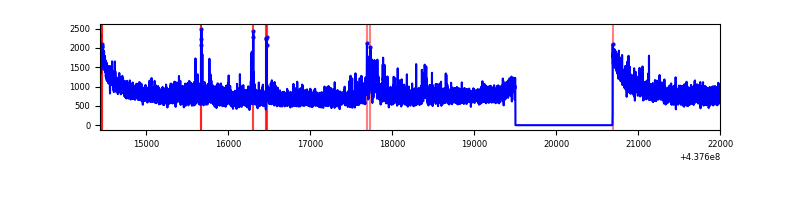 |
| B | 7560 | 6376 | 33 | 33 | 0.44% | 0.52% | 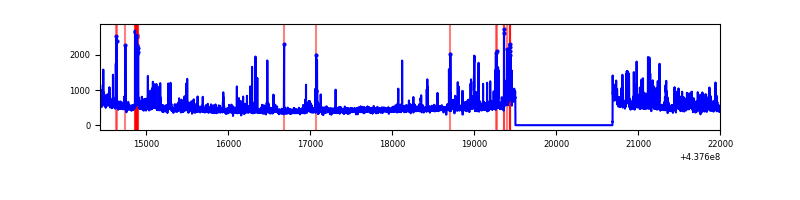 |
| C | 7560 | 6376 | 114 | 114 | 1.51% | 1.79% | 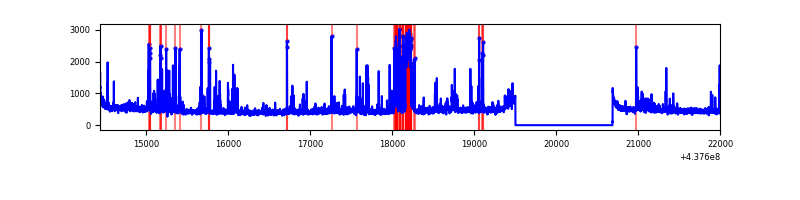 |
| D | 7560 | 6376 | 215 | 215 | 2.84% | 3.37% | 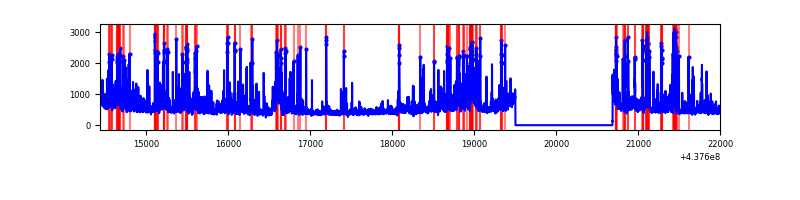 |
Top three noisy pixels from each quadrant. If the there are fewer than three noisy pixels in the level2.evt file, extra rows are filled as -1
| Pixel properties | Quadrant properties | ||||||
|---|---|---|---|---|---|---|---|
| Quadrant | DetID | PixID | Counts | Sigma | Mean | Median | Sigma |
| A | 10 | 83 | 1189322 | 7961.72 | 724 | 708 | 149.3 |
| A | 15 | 222 | 1051820 | 7040.69 | 724 | 708 | 149.3 |
| A | 14 | 254 | 180084 | 1201.52 | 724 | 708 | 149.3 |
| B | 5 | 172 | 103761 | 723.76 | 729 | 707 | 142.4 |
| B | 0 | 200 | 103042 | 718.71 | 729 | 707 | 142.4 |
| B | 4 | 158 | 94788 | 660.74 | 729 | 707 | 142.4 |
| C | 14 | 254 | 542210 | 3223.24 | 713 | 717 | 168.0 |
| C | 1 | 241 | 74779 | 440.85 | 713 | 717 | 168.0 |
| C | 3 | 233 | 74177 | 437.27 | 713 | 717 | 168.0 |
| D | 5 | 235 | 490685 | 2790.22 | 700 | 678 | 175.6 |
| D | 1 | 52 | 298164 | 1693.96 | 700 | 678 | 175.6 |
| D | 12 | 17 | 227473 | 1291.42 | 700 | 678 | 175.6 |
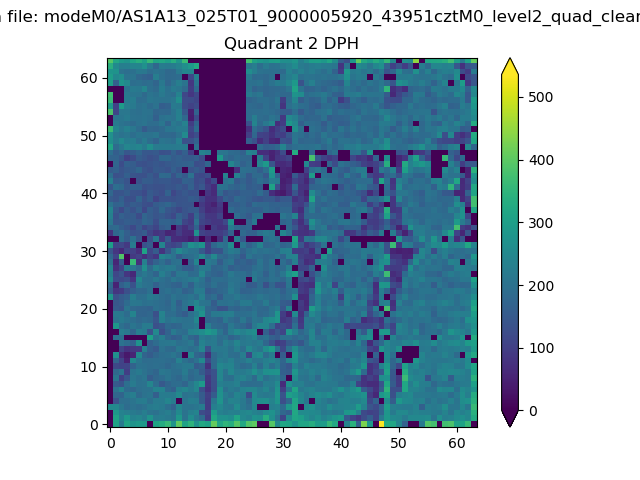
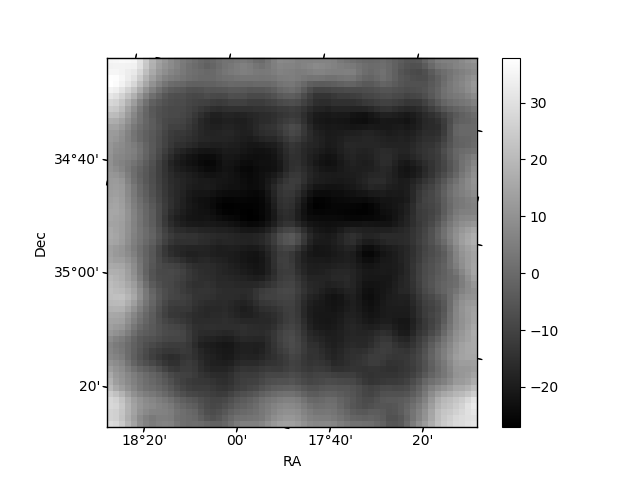
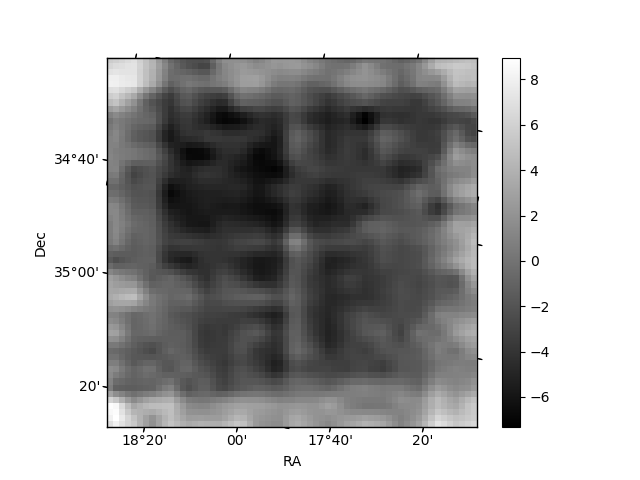
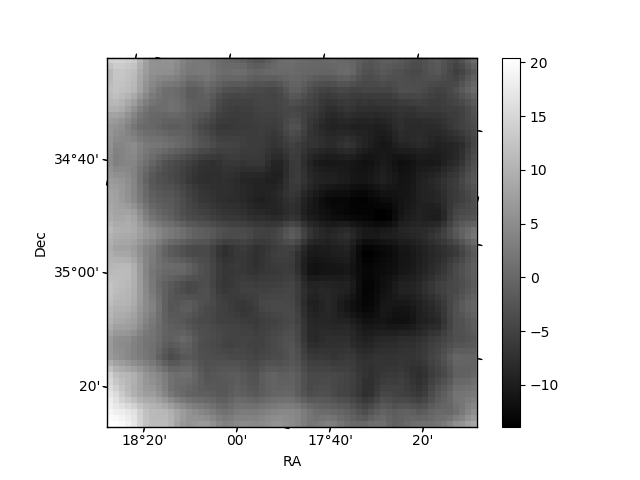
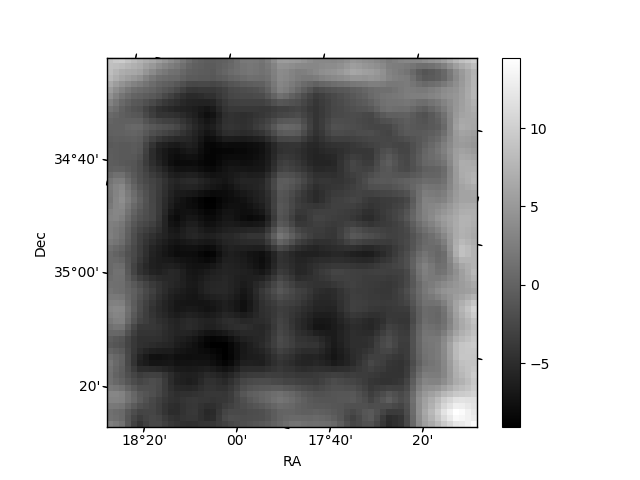
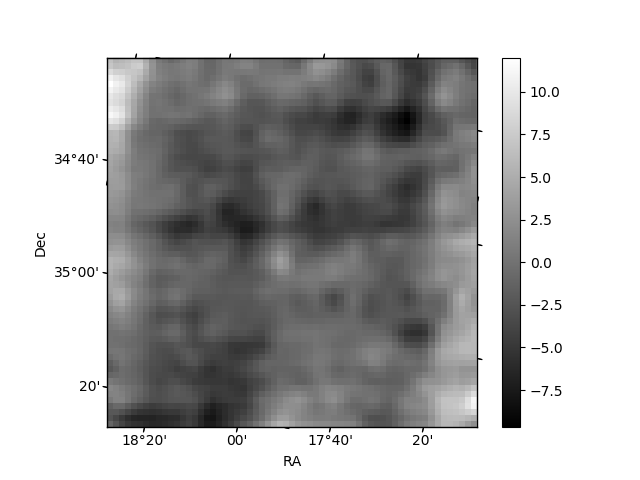
Histogram calculated using DETX and DETY for each event in the final _common_clean file
| Quadrant A | 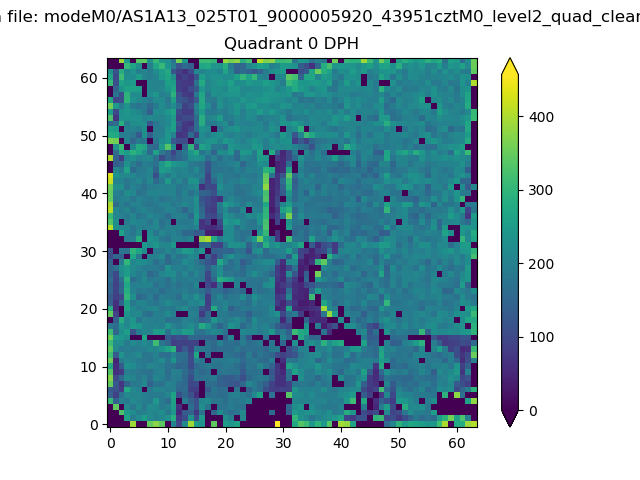 |
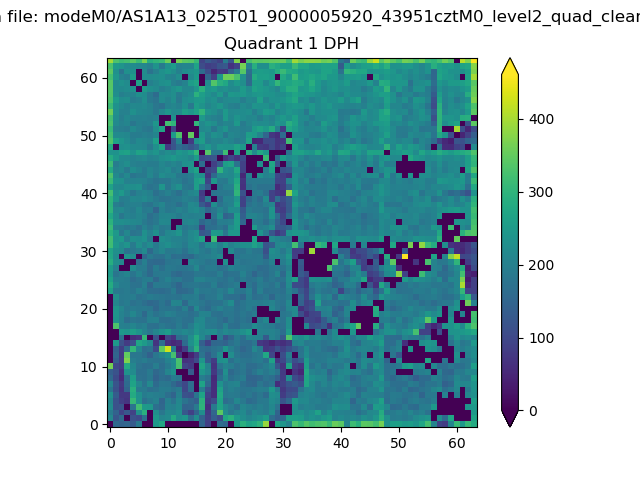 |
Quadrant B |
|---|---|---|---|
| Quadrant D | 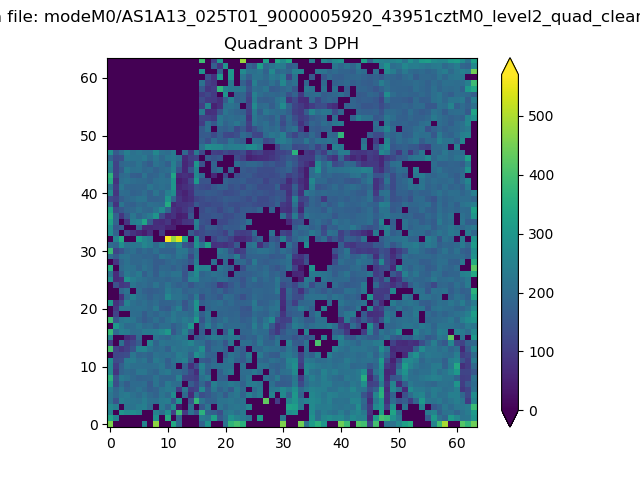 |
 |
Quadrant C |
| Plot type | Count rate plots | Images |
|---|---|---|
| Comparison with Poisson distribution Blue bars denote a histogram of data divided into 1 sec bins. Red curve is a Poisson curve with rate = median count rate of data. |
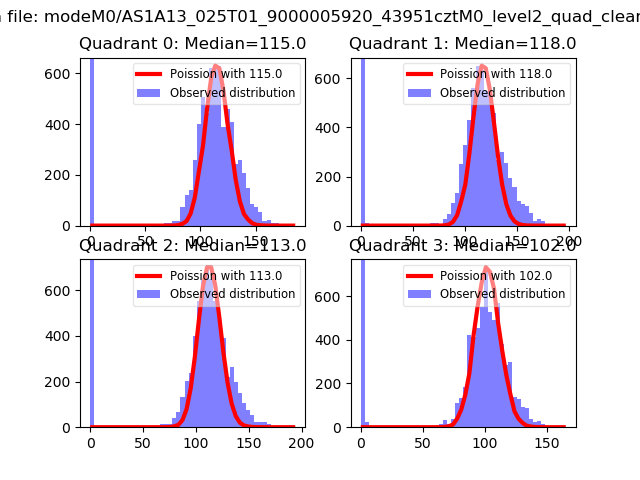 |
 |
| Quadrant-wise count rates Data is divided into 100 sec bins |
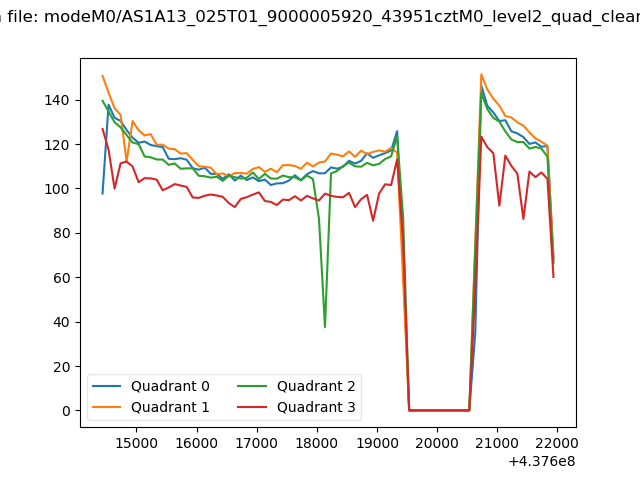 |
|
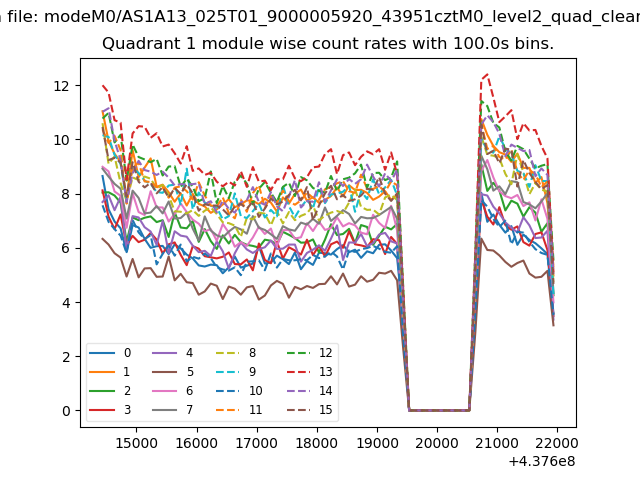
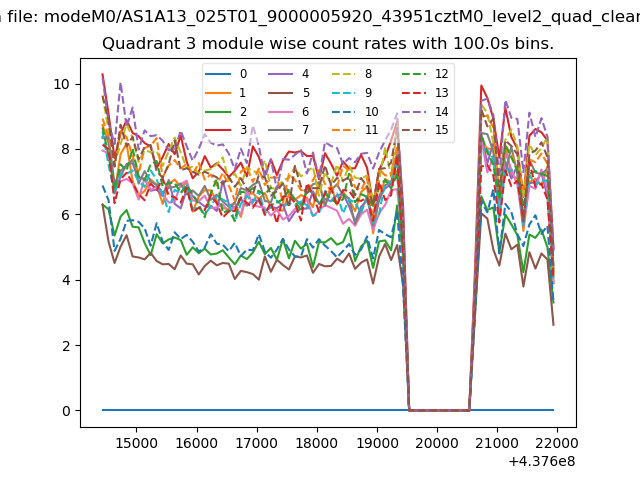
| Module-wise count rates for Quadrant A Data is divided into 100 sec bins |
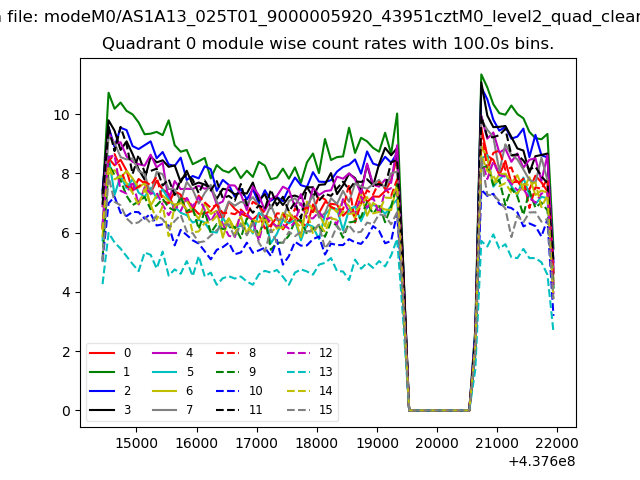 |
 |
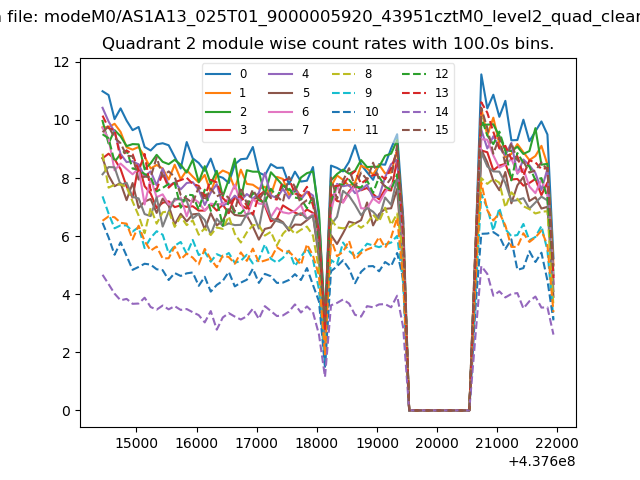
| Module-wise count rates for Quadrant B Data is divided into 100 sec bins |
 |
 |
| Module-wise count rates for Quadrant C Data is divided into 100 sec bins |
 |
 |
| Module-wise count rates for Quadrant D Data is divided into 100 sec bins |
 |
 |
| Parameter | Plot |
|---|---|
| CZT HV Monitor | 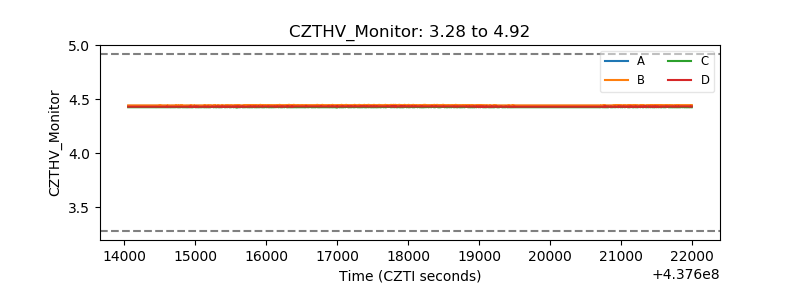 |
| D_VDD | 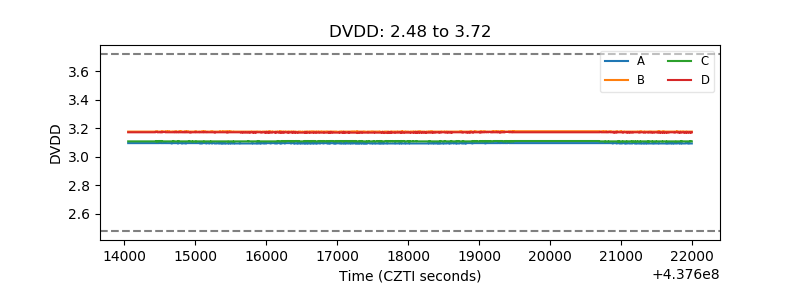 |
| Temperature 1 | 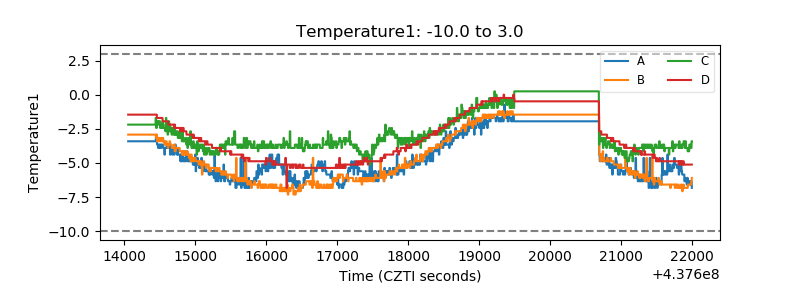 |
| Veto HV Monitor | 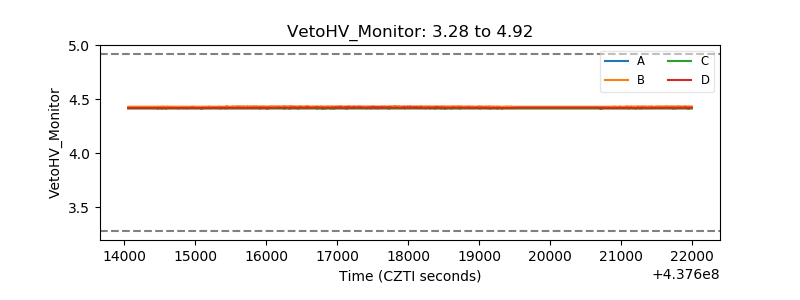 |
| Veto LLD | 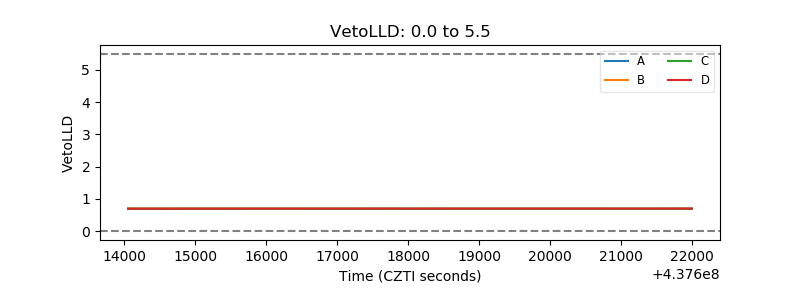 |
| Alpha Counter | 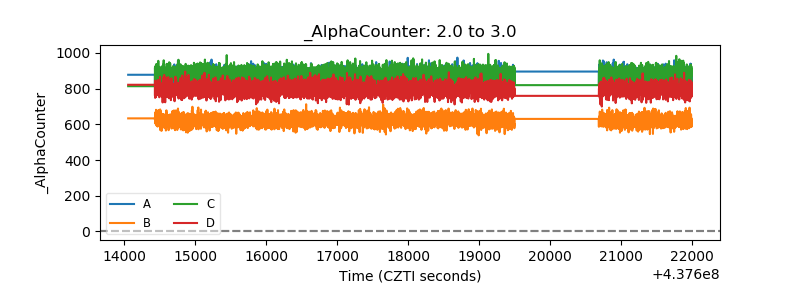 |
| _CPM_Rate | 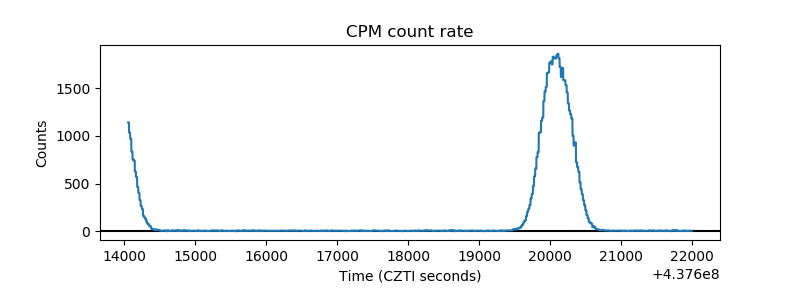 |
| CZT Counter | 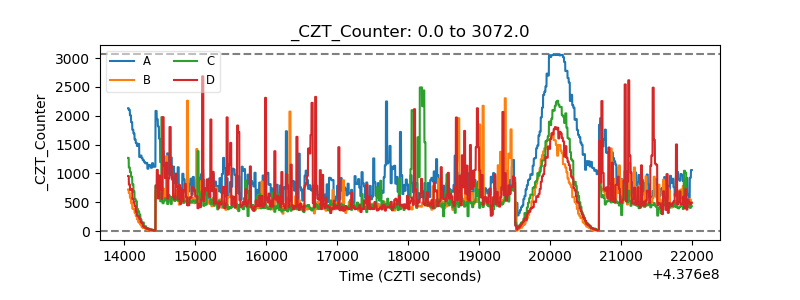 |
| +2.5 Volts monitor | 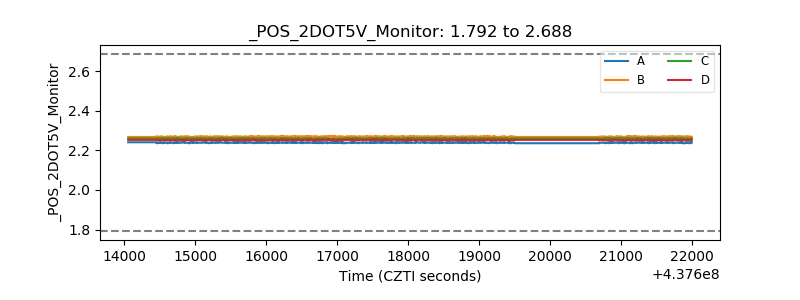 |
| +5 Volts monitor | 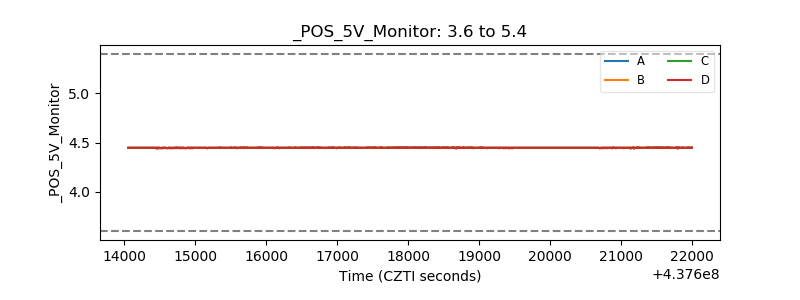 |
| _ROLL_ROT | 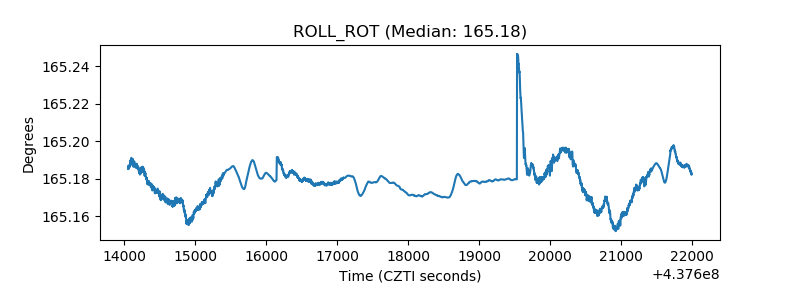 |
| _Roll_DEC | 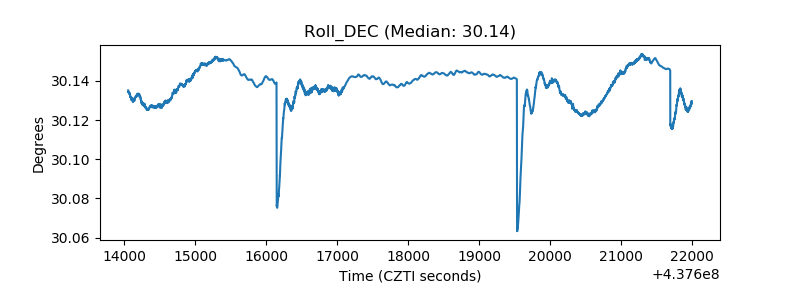 |
| _Roll_RA | 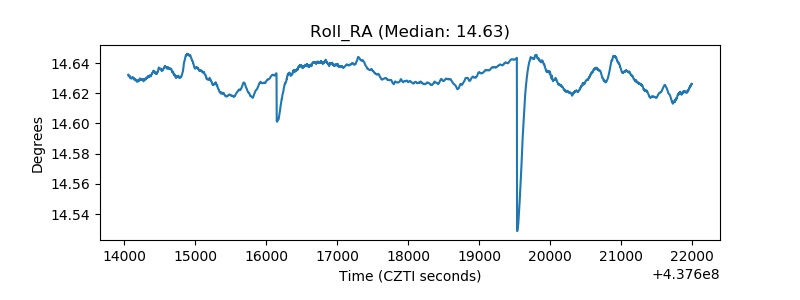 |
| Veto Counter | 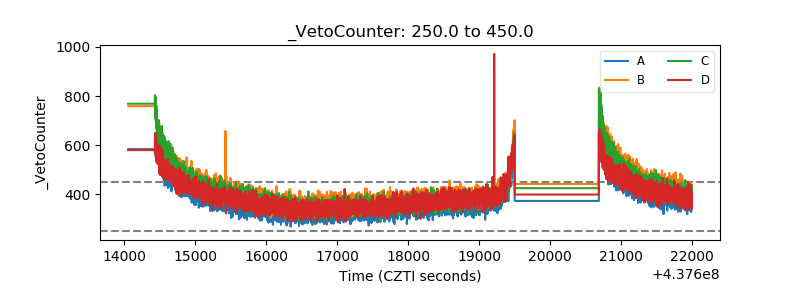 |