| Param | Original file | Final file |
|---|---|---|
| Filename | modeM0/AS1A13_025T01_9000005920_43952cztM0_level2.fits | modeM0/AS1A13_025T01_9000005920_43952cztM0_level2_quad_clean.evt |
| Size (bytes) | 460,739,520 | 108,887,040 |
| Size | 439.4 MB | 103.8 MB |
| Events in quadrant A | 5,643,425 | 725,507 |
| Events in quadrant B | 3,705,797 | 761,321 |
| Events in quadrant C | 3,078,036 | 732,613 |
| Events in quadrant D | 4,141,437 | 640,196 |
| Mode M9 | |||
|---|---|---|---|
| Quadrant | BADHDUFLAG | Total packets | Discarded packets |
| A | 0 | 15 | 0 |
| B | 0 | 16 | 0 |
| C | 0 | 16 | 0 |
| D | 0 | 16 | 0 |
| Mode SS | |||
|---|---|---|---|
| Quadrant | BADHDUFLAG | Total packets | Discarded packets |
| A | 0 | 128 | 0 |
| B | 0 | 128 | 0 |
| C | 0 | 128 | 0 |
| D | 0 | 128 | 0 |
| Mode M0 | |||
|---|---|---|---|
| Quadrant | BADHDUFLAG | Total packets | Discarded packets |
| A | 0 | 21265 | 2 |
| B | 0 | 15158 | 3 |
| C | 0 | 13453 | 2 |
| D | 0 | 16624 | 2 |
| Quadrant | Total seconds | Saturated seconds | Saturation percentage |
|---|---|---|---|
| A | 6268 | 191 | 3.047224% |
| B | 6267 | 124 | 1.978618% |
| C | 6267 | 32 | 0.510611% |
| D | 6267 | 258 | 4.116802% |
Noise dominated data is calculated using 1-second bins in cleaned event files. If a bin has >2000 counts, and if more than 50% of those come from <1% of pixels, then it is considered to be noise-dominated and hence unusable.
| Quadrant | # 1 sec bins | Bins with >0 counts | Bins with >2000 counts | High rate bins dominated by noise | Noise dominated (total time) | Noise dominated (detector-on time) | Marked lightcurve |
|---|---|---|---|---|---|---|---|
| A | 7503 | 6269 | 84 | 84 | 1.12% | 1.34% | 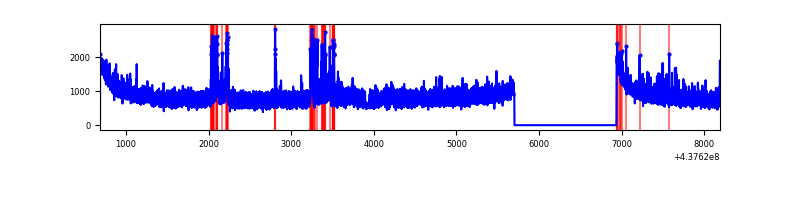 |
| B | 7502 | 6268 | 60 | 60 | 0.80% | 0.96% | 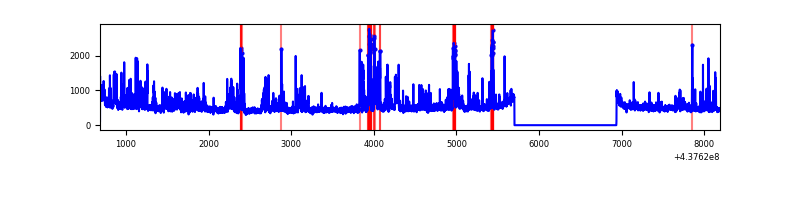 |
| C | 7502 | 6268 | 19 | 19 | 0.25% | 0.30% | 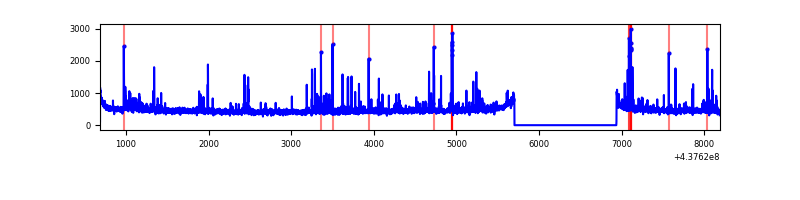 |
| D | 7502 | 6268 | 183 | 183 | 2.44% | 2.92% | 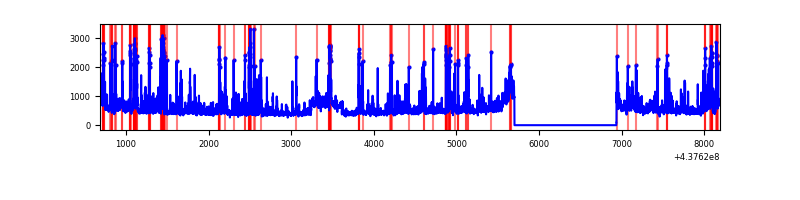 |
Top three noisy pixels from each quadrant. If the there are fewer than three noisy pixels in the level2.evt file, extra rows are filled as -1
| Pixel properties | Quadrant properties | ||||||
|---|---|---|---|---|---|---|---|
| Quadrant | DetID | PixID | Counts | Sigma | Mean | Median | Sigma |
| A | 15 | 222 | 1193418 | 8032.81 | 720 | 706 | 148.5 |
| A | 10 | 83 | 1156990 | 7787.47 | 720 | 706 | 148.5 |
| A | 14 | 254 | 384614 | 2585.59 | 720 | 706 | 148.5 |
| B | 5 | 235 | 263772 | 1851.87 | 729 | 709 | 142.1 |
| B | 5 | 172 | 243614 | 1709.96 | 729 | 709 | 142.1 |
| B | 0 | 200 | 153811 | 1077.78 | 729 | 709 | 142.1 |
| C | 14 | 254 | 99015 | 585.97 | 715 | 721 | 167.7 |
| C | 1 | 241 | 83662 | 494.45 | 715 | 721 | 167.7 |
| C | 15 | 208 | 33892 | 197.75 | 715 | 721 | 167.7 |
| D | 5 | 235 | 332548 | 1875.49 | 697 | 674 | 177.0 |
| D | 1 | 52 | 216002 | 1216.86 | 697 | 674 | 177.0 |
| D | 13 | 249 | 168308 | 947.33 | 697 | 674 | 177.0 |
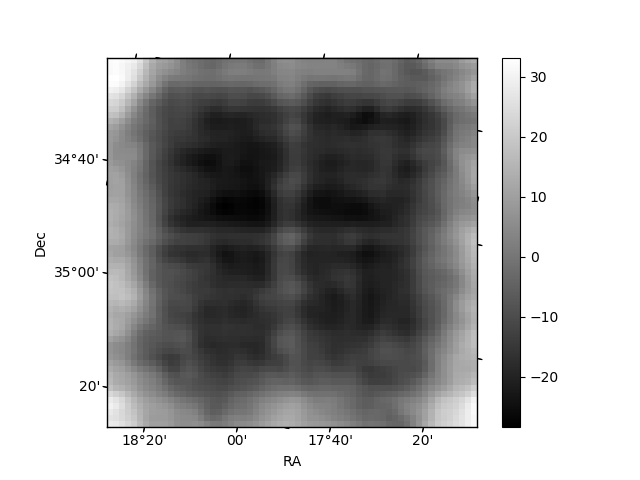
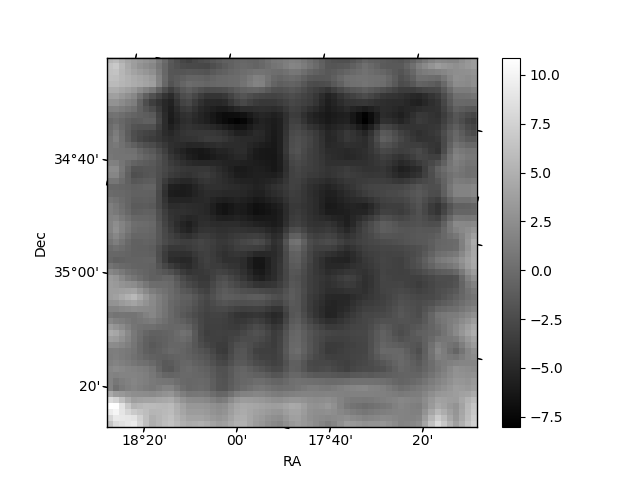
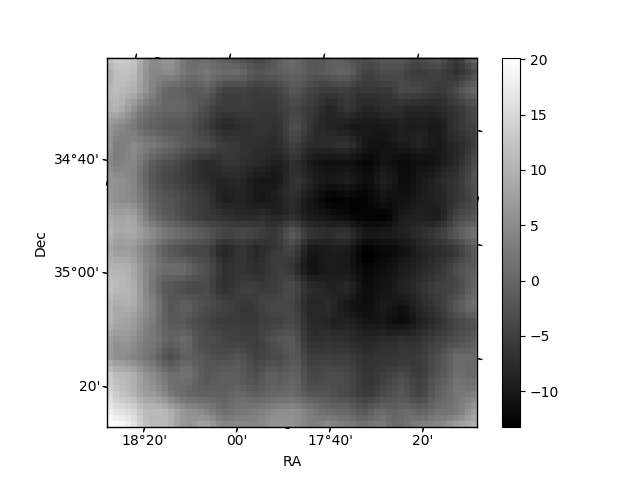
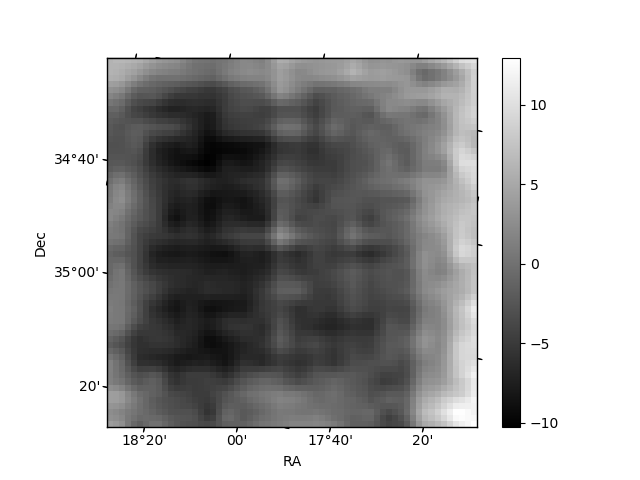
Histogram calculated using DETX and DETY for each event in the final _common_clean file
| Quadrant A | 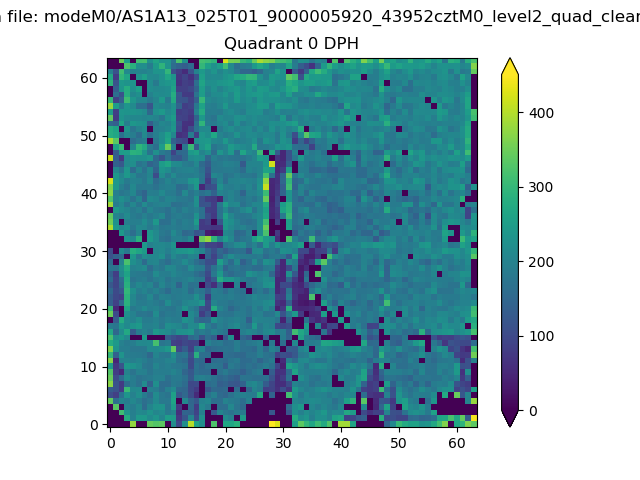 |
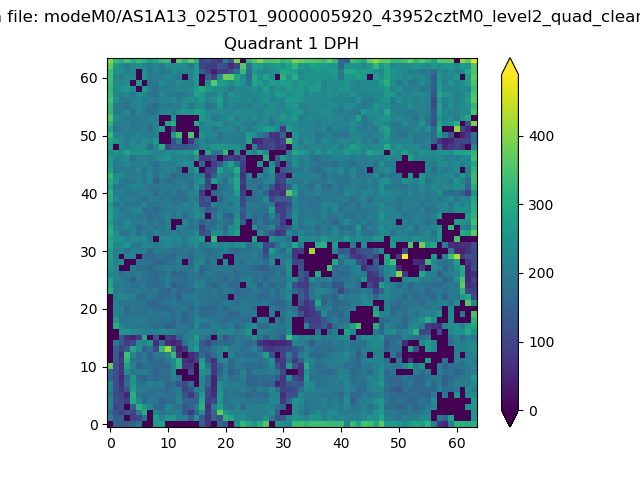 |
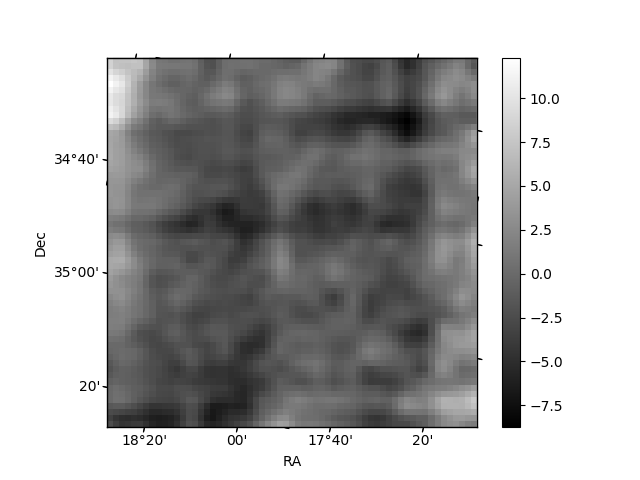
Quadrant B |
|---|---|---|---|
| Quadrant D | 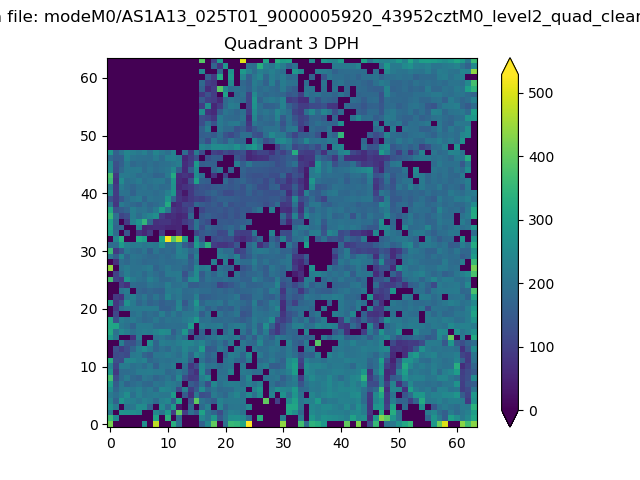 |
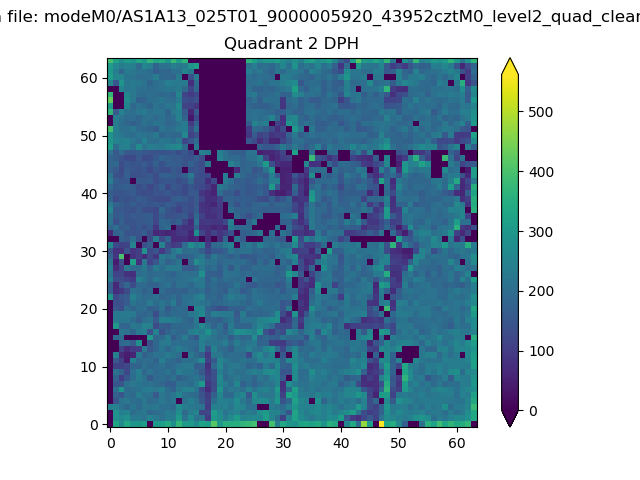 |
Quadrant C |
| Plot type | Count rate plots | Images |
|---|---|---|
| Comparison with Poisson distribution Blue bars denote a histogram of data divided into 1 sec bins. Red curve is a Poisson curve with rate = median count rate of data. |
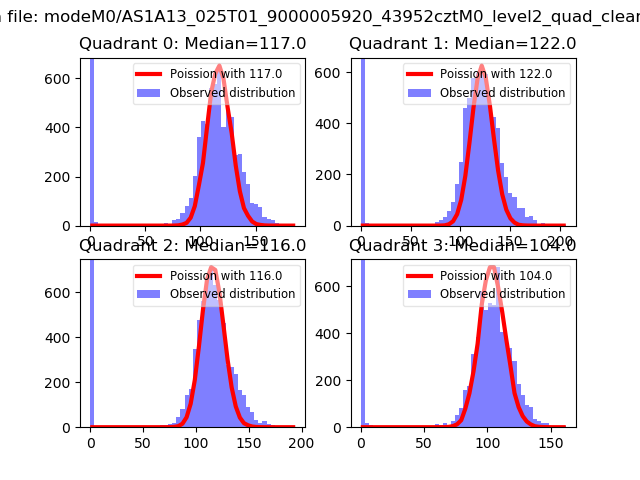 |
 |
| Quadrant-wise count rates Data is divided into 100 sec bins |
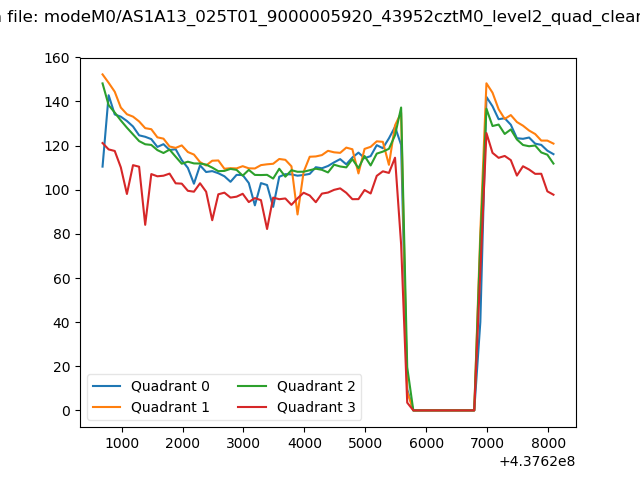 |
|
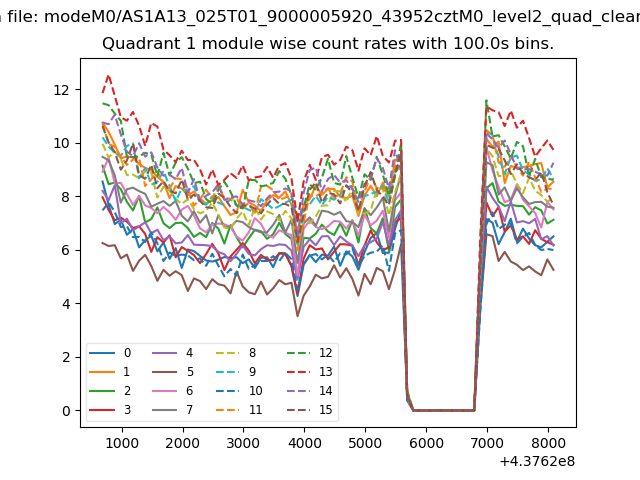
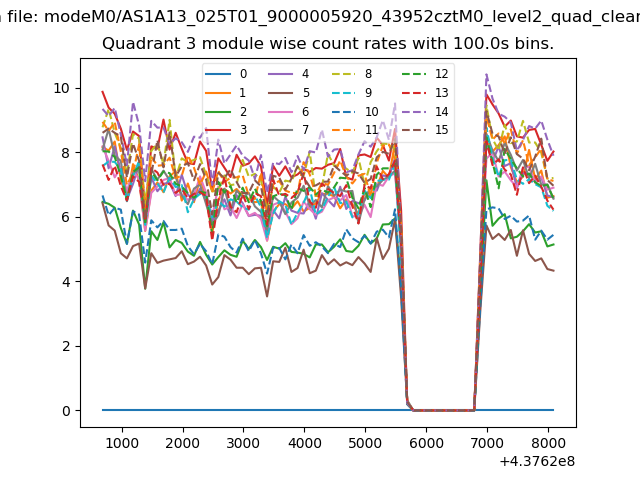
| Module-wise count rates for Quadrant A Data is divided into 100 sec bins |
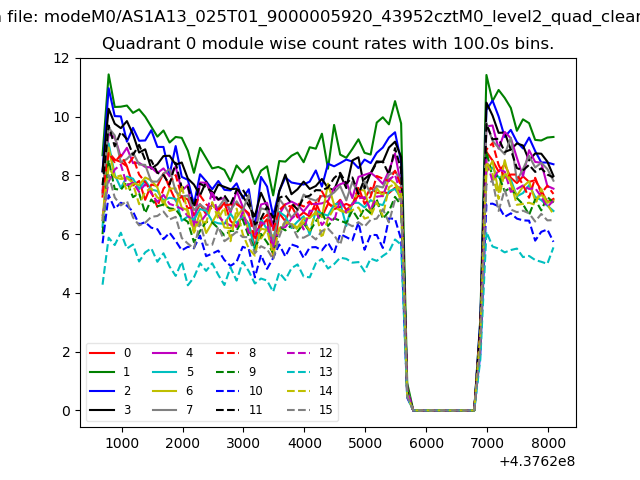 |
 |
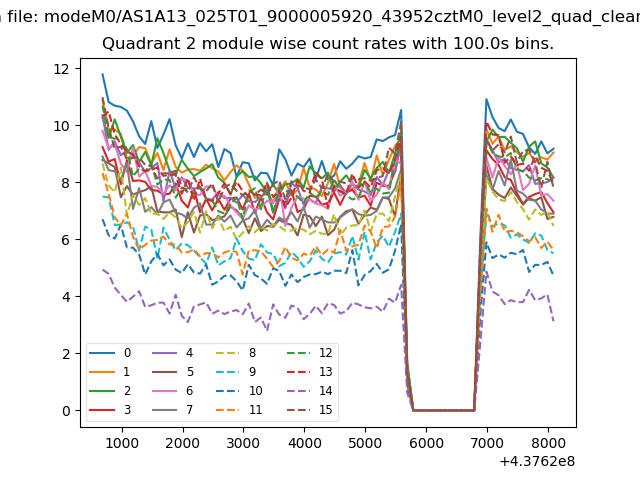
| Module-wise count rates for Quadrant B Data is divided into 100 sec bins |
 |
 |
| Module-wise count rates for Quadrant C Data is divided into 100 sec bins |
 |
 |
| Module-wise count rates for Quadrant D Data is divided into 100 sec bins |
 |
 |
| Parameter | Plot |
|---|---|
| CZT HV Monitor |  |
| D_VDD | 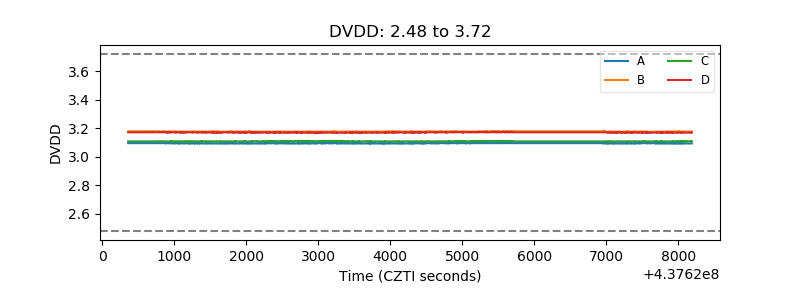 |
| Temperature 1 | 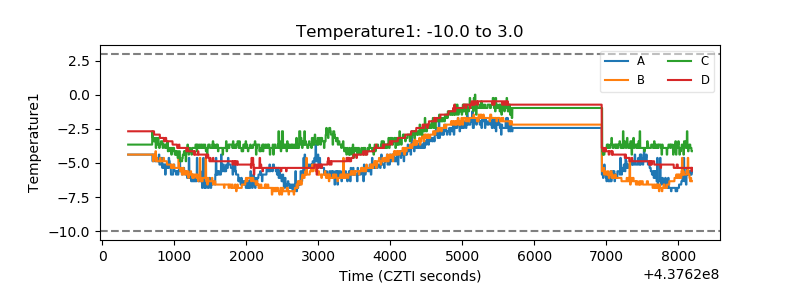 |
| Veto HV Monitor | 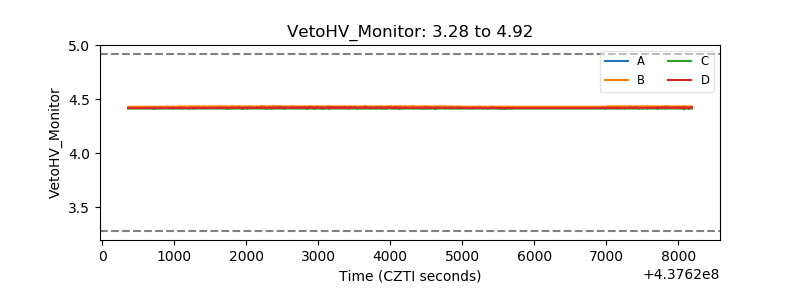 |
| Veto LLD | 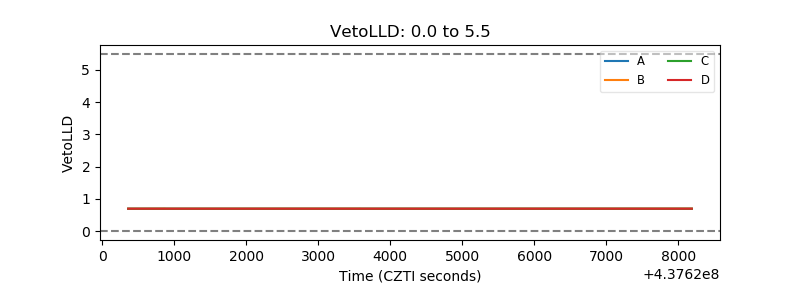 |
| Alpha Counter | 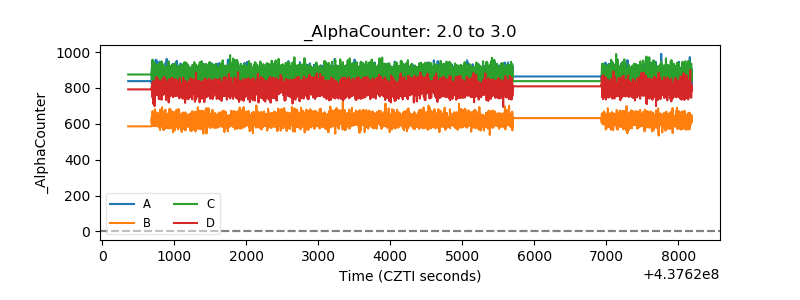 |
| _CPM_Rate | 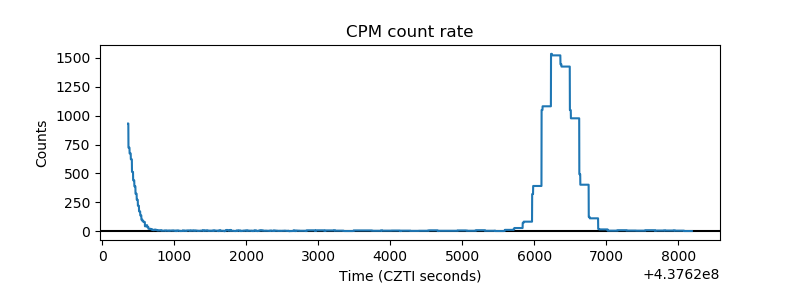 |
| CZT Counter | 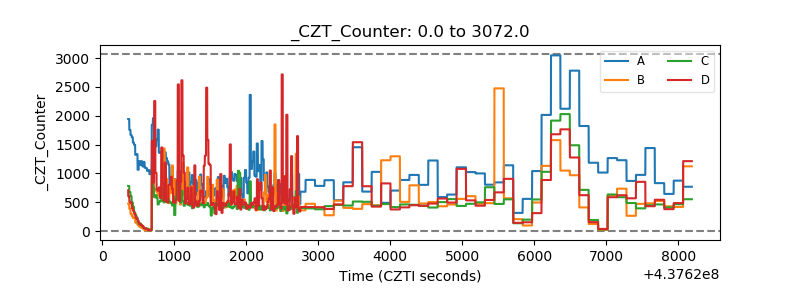 |
| +2.5 Volts monitor | 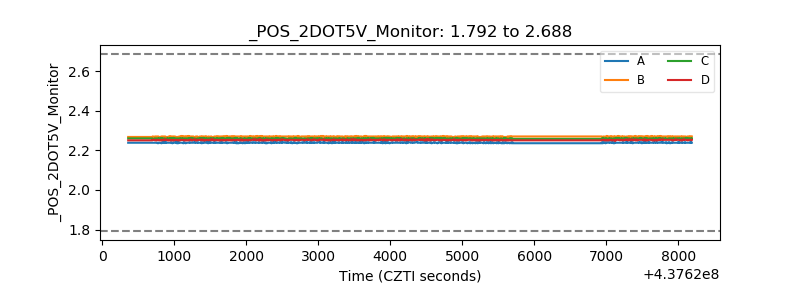 |
| +5 Volts monitor | 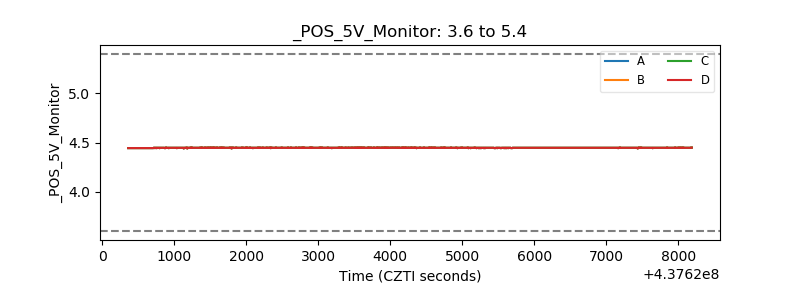 |
| _ROLL_ROT | 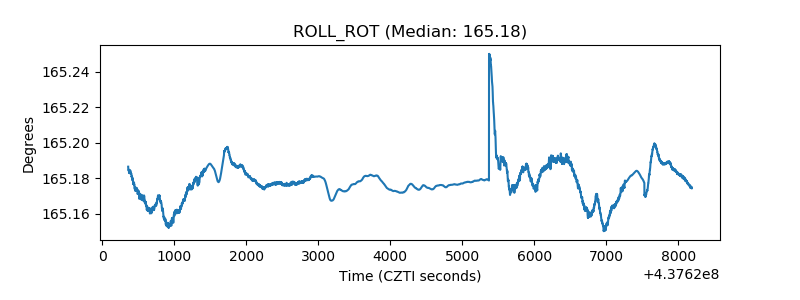 |
| _Roll_DEC | 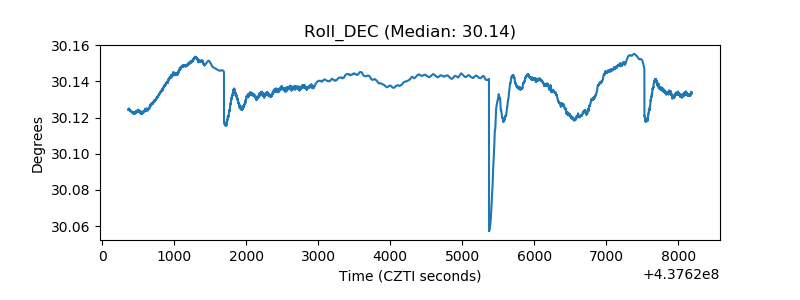 |
| _Roll_RA | 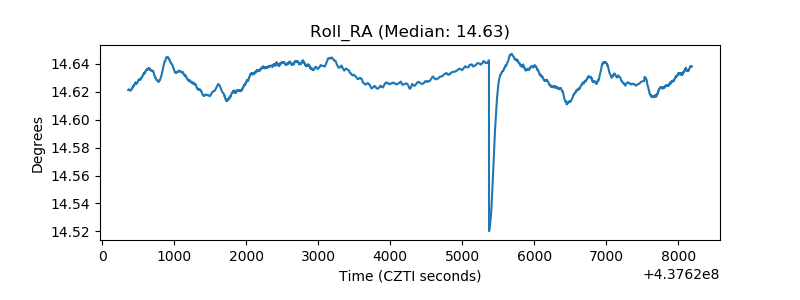 |
| Veto Counter | 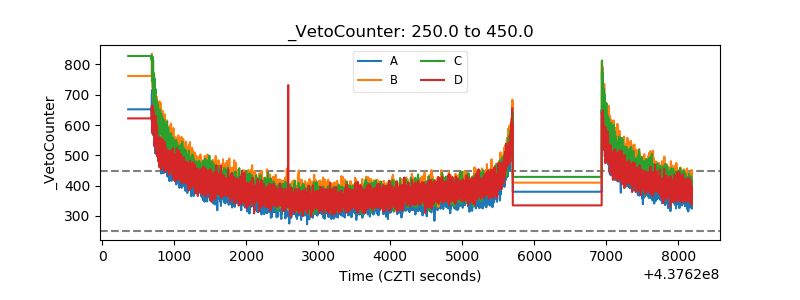 |