| Param | Original file | Final file |
|---|---|---|
| Filename | modeM0/AS1A13_025T01_9000005920_43953cztM0_level2.fits | modeM0/AS1A13_025T01_9000005920_43953cztM0_level2_quad_clean.evt |
| Size (bytes) | 487,532,160 | 114,603,840 |
| Size | 464.9 MB | 109.3 MB |
| Events in quadrant A | 5,840,259 | 761,858 |
| Events in quadrant B | 3,979,376 | 773,344 |
| Events in quadrant C | 3,287,650 | 773,360 |
| Events in quadrant D | 4,416,609 | 691,428 |
| Mode M9 | |||
|---|---|---|---|
| Quadrant | BADHDUFLAG | Total packets | Discarded packets |
| A | 0 | 12 | 0 |
| B | 0 | 12 | 0 |
| C | 0 | 13 | 0 |
| D | 0 | 13 | 0 |
| Mode SS | |||
|---|---|---|---|
| Quadrant | BADHDUFLAG | Total packets | Discarded packets |
| A | 0 | 140 | 0 |
| B | 0 | 140 | 0 |
| C | 0 | 140 | 0 |
| D | 0 | 140 | 0 |
| Mode M0 | |||
|---|---|---|---|
| Quadrant | BADHDUFLAG | Total packets | Discarded packets |
| A | 0 | 22253 | 2 |
| B | 0 | 16261 | 2 |
| C | 0 | 14498 | 2 |
| D | 0 | 17803 | 2 |
| Quadrant | Total seconds | Saturated seconds | Saturation percentage |
|---|---|---|---|
| A | 6738 | 248 | 3.680617% |
| B | 6738 | 358 | 5.313149% |
| C | 6738 | 55 | 0.816266% |
| D | 6738 | 188 | 2.790145% |
Noise dominated data is calculated using 1-second bins in cleaned event files. If a bin has >2000 counts, and if more than 50% of those come from <1% of pixels, then it is considered to be noise-dominated and hence unusable.
| Quadrant | # 1 sec bins | Bins with >0 counts | Bins with >2000 counts | High rate bins dominated by noise | Noise dominated (total time) | Noise dominated (detector-on time) | Marked lightcurve |
|---|---|---|---|---|---|---|---|
| A | 7928 | 6739 | 97 | 97 | 1.22% | 1.44% | 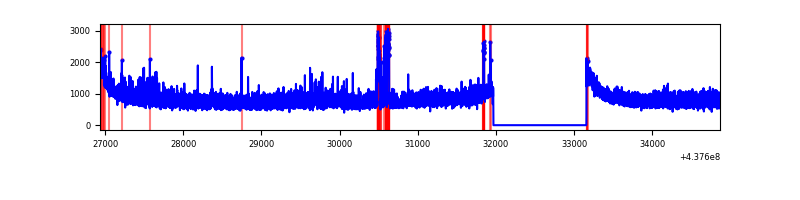 |
| B | 7928 | 6739 | 192 | 192 | 2.42% | 2.85% | 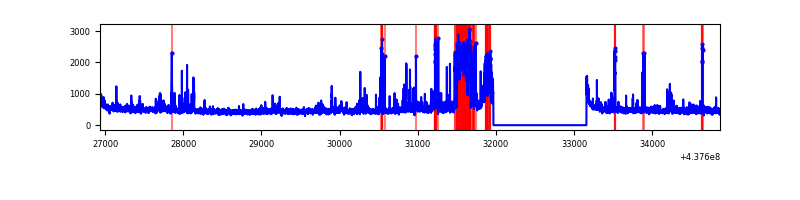 |
| C | 7928 | 6739 | 37 | 37 | 0.47% | 0.55% | 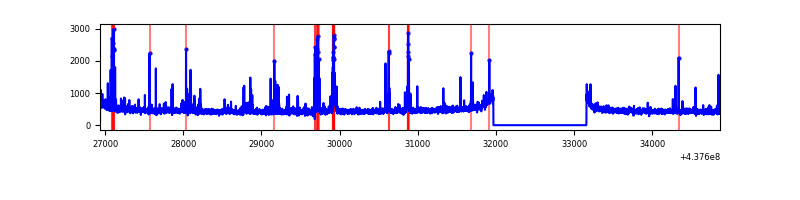 |
| D | 7928 | 6739 | 152 | 152 | 1.92% | 2.26% | 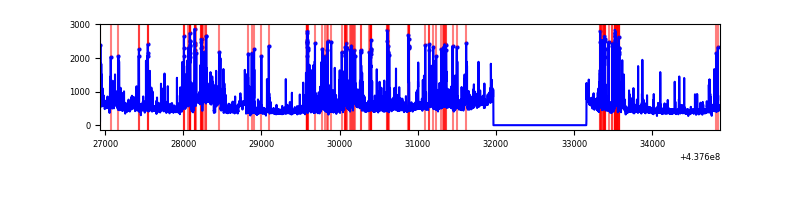 |
Top three noisy pixels from each quadrant. If the there are fewer than three noisy pixels in the level2.evt file, extra rows are filled as -1
| Pixel properties | Quadrant properties | ||||||
|---|---|---|---|---|---|---|---|
| Quadrant | DetID | PixID | Counts | Sigma | Mean | Median | Sigma |
| A | 15 | 222 | 1408348 | 8890.71 | 766 | 751 | 158.3 |
| A | 10 | 83 | 1231962 | 7776.61 | 766 | 751 | 158.3 |
| A | 15 | 223 | 110991 | 696.3 | 766 | 751 | 158.3 |
| B | 5 | 172 | 635344 | 4228.62 | 764 | 741 | 150.1 |
| B | 5 | 235 | 130588 | 865.22 | 764 | 741 | 150.1 |
| B | 4 | 171 | 45526 | 298.42 | 764 | 741 | 150.1 |
| C | 1 | 241 | 160815 | 885.57 | 766 | 772 | 180.7 |
| C | 14 | 254 | 76497 | 419.01 | 766 | 772 | 180.7 |
| C | 3 | 233 | 25836 | 138.69 | 766 | 772 | 180.7 |
| D | 5 | 235 | 498963 | 2552.95 | 753 | 730 | 195.2 |
| D | 1 | 52 | 243194 | 1242.39 | 753 | 730 | 195.2 |
| D | 13 | 249 | 145400 | 741.29 | 753 | 730 | 195.2 |
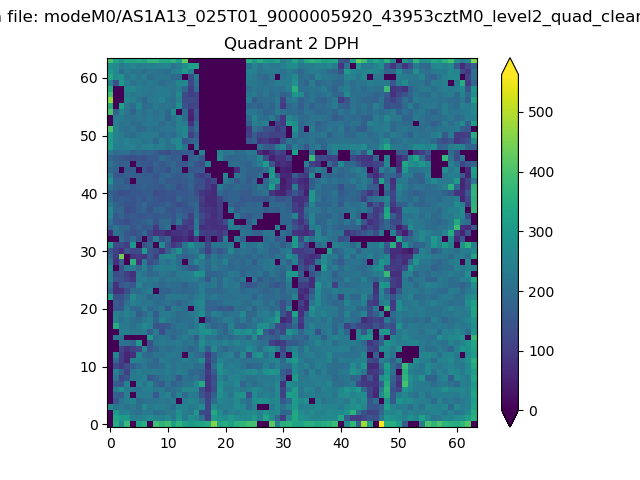
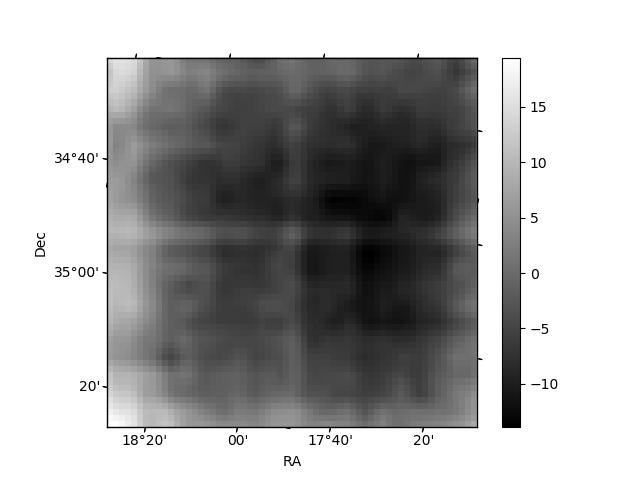
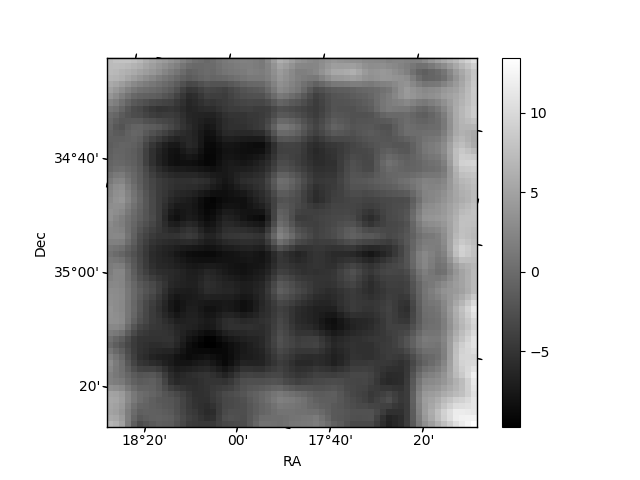
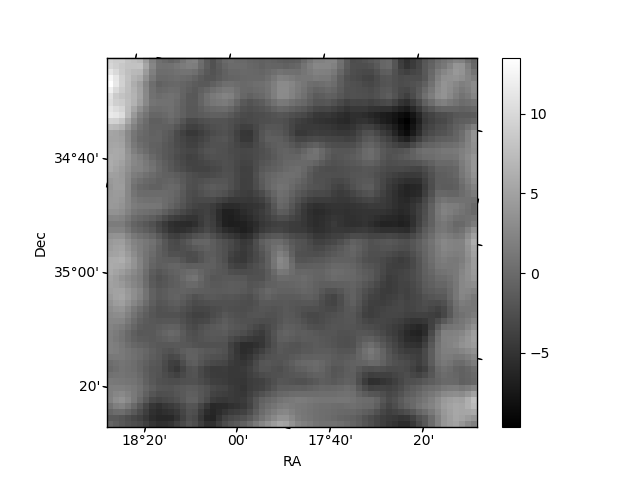
Histogram calculated using DETX and DETY for each event in the final _common_clean file
| Quadrant A | 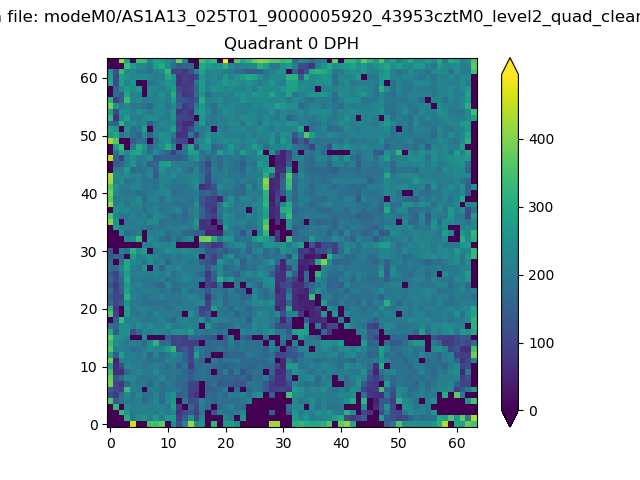 |
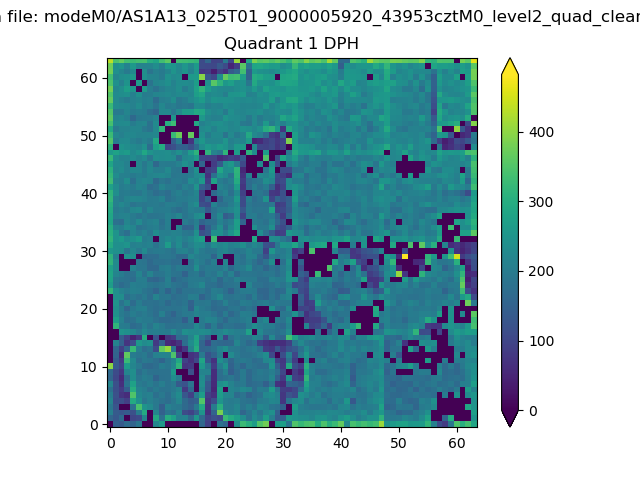 |
Quadrant B |
|---|---|---|---|
| Quadrant D | 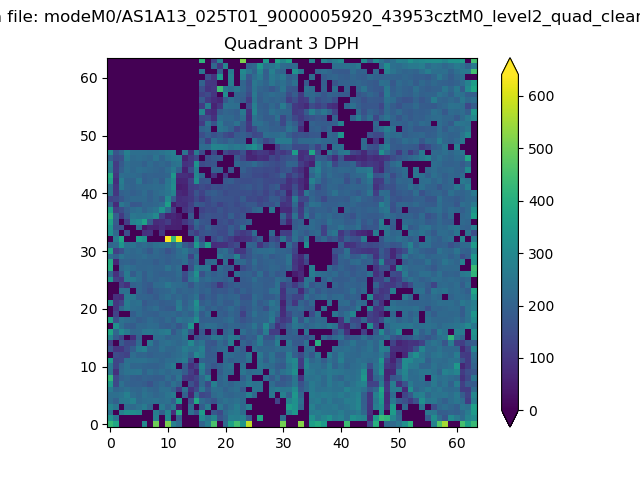 |
 |
Quadrant C |
| Plot type | Count rate plots | Images |
|---|---|---|
| Comparison with Poisson distribution Blue bars denote a histogram of data divided into 1 sec bins. Red curve is a Poisson curve with rate = median count rate of data. |
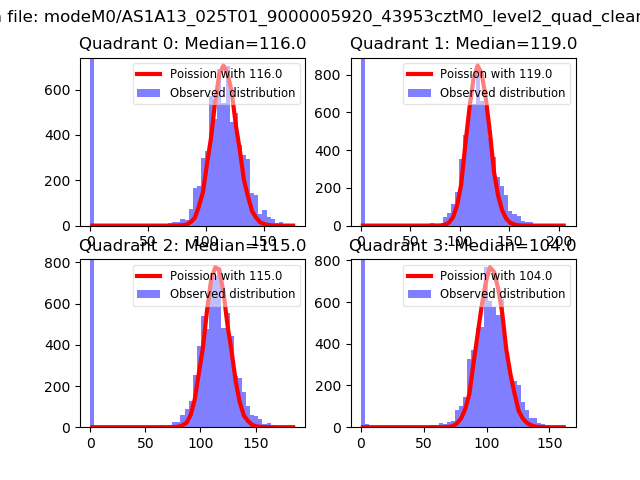 |
 |
| Quadrant-wise count rates Data is divided into 100 sec bins |
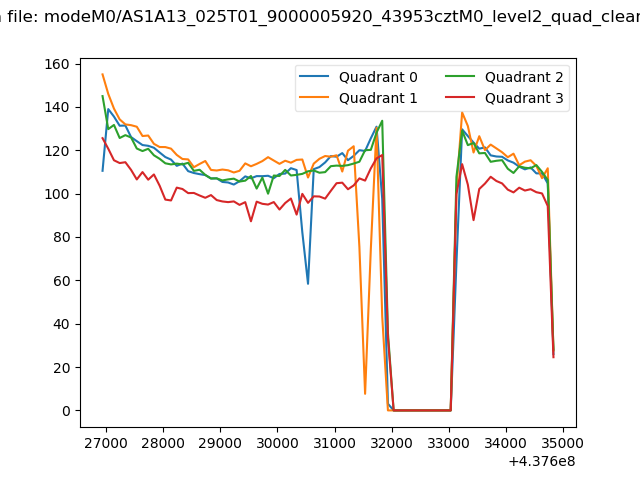 |
|
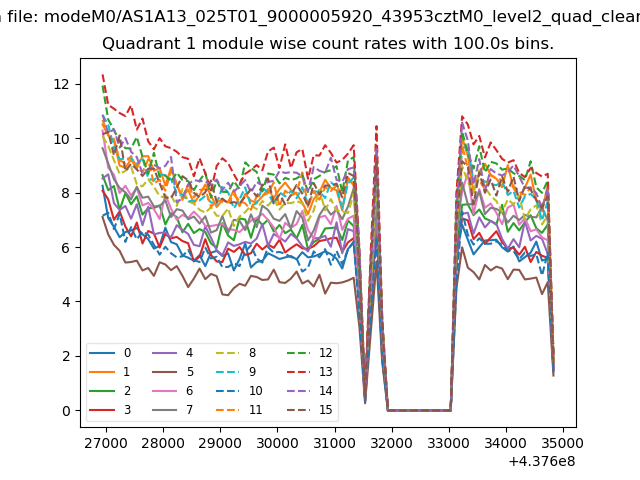
| Module-wise count rates for Quadrant A Data is divided into 100 sec bins |
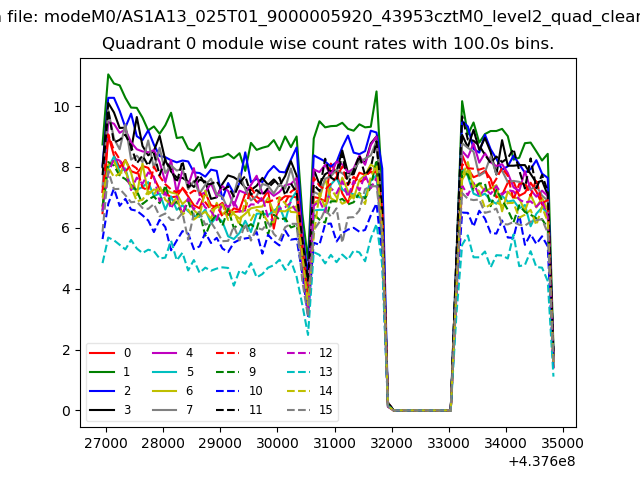 |
 |
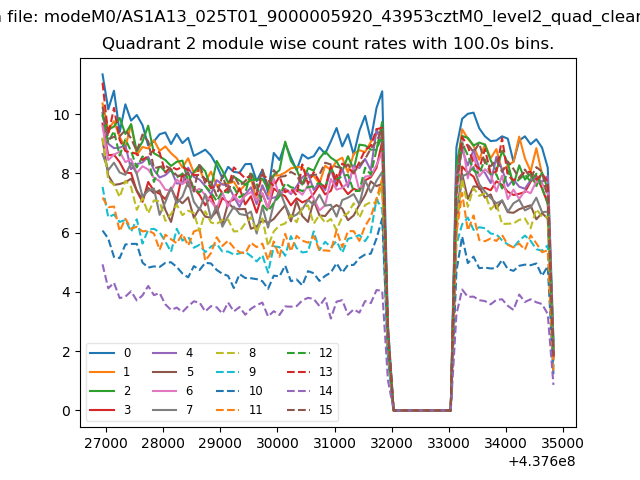
| Module-wise count rates for Quadrant B Data is divided into 100 sec bins |
 |
 |
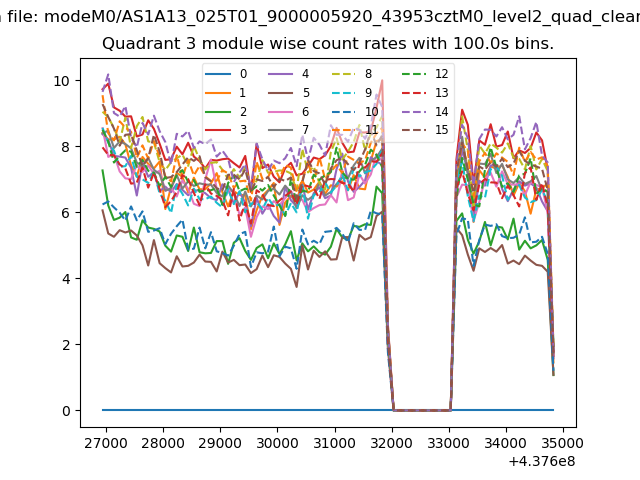
| Module-wise count rates for Quadrant C Data is divided into 100 sec bins |
 |
 |
| Module-wise count rates for Quadrant D Data is divided into 100 sec bins |
 |
 |
| Parameter | Plot |
|---|---|
| CZT HV Monitor | 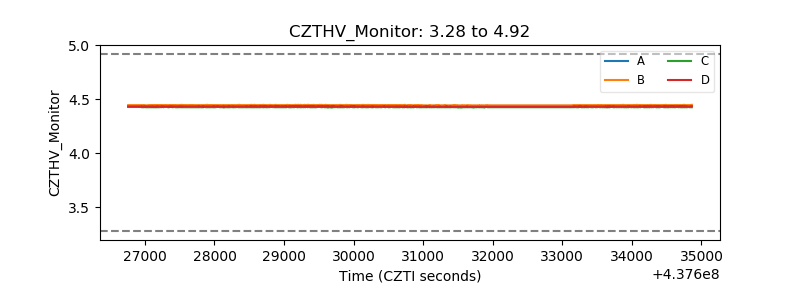 |
| D_VDD | 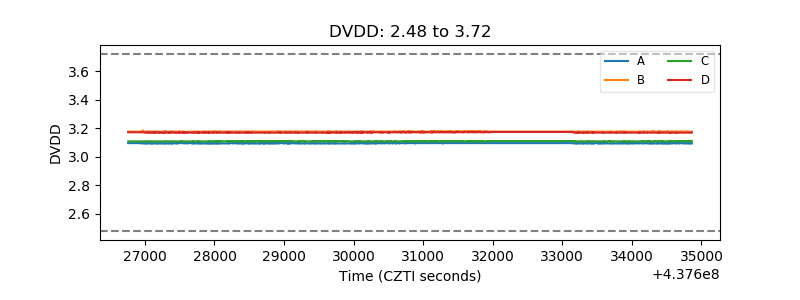 |
| Temperature 1 | 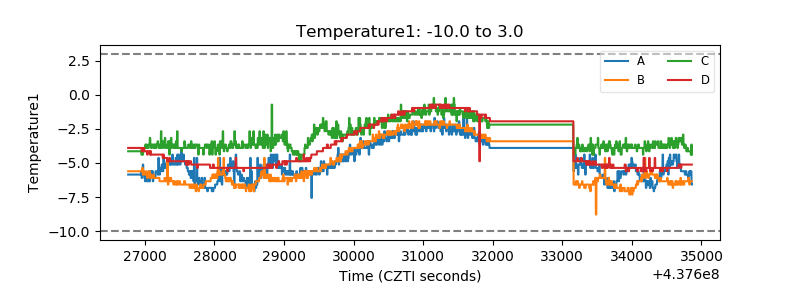 |
| Veto HV Monitor | 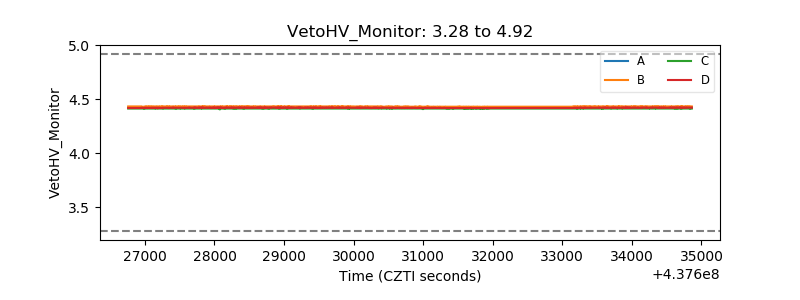 |
| Veto LLD | 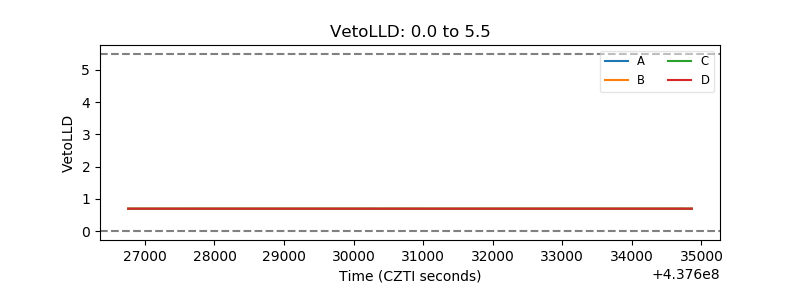 |
| Alpha Counter | 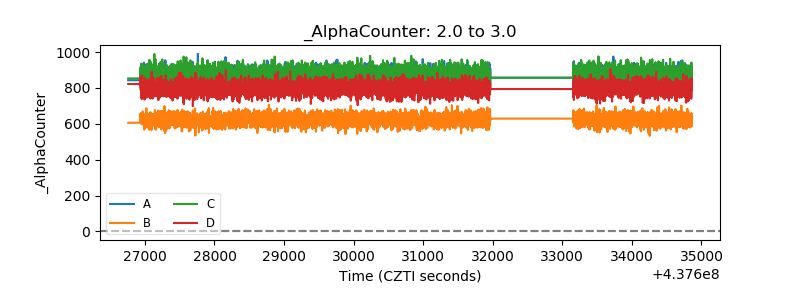 |
| _CPM_Rate | 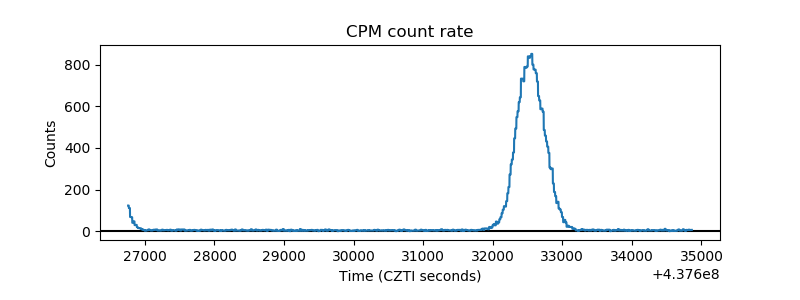 |
| CZT Counter | 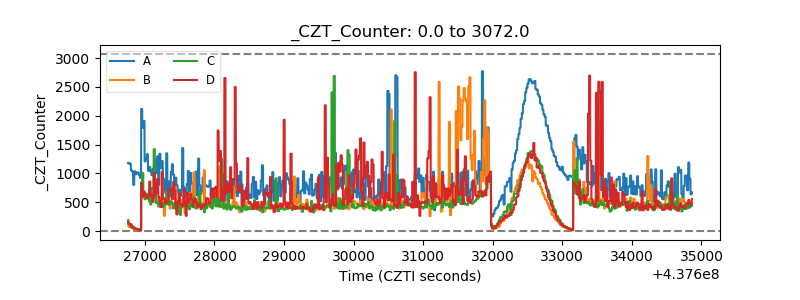 |
| +2.5 Volts monitor | 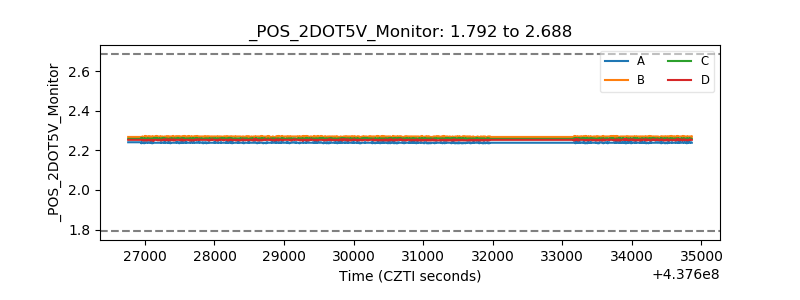 |
| +5 Volts monitor | 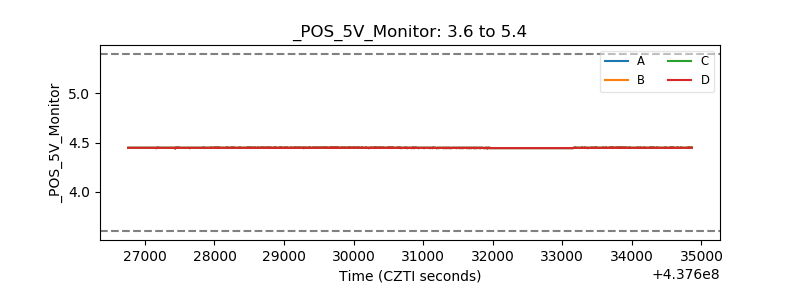 |
| _ROLL_ROT | 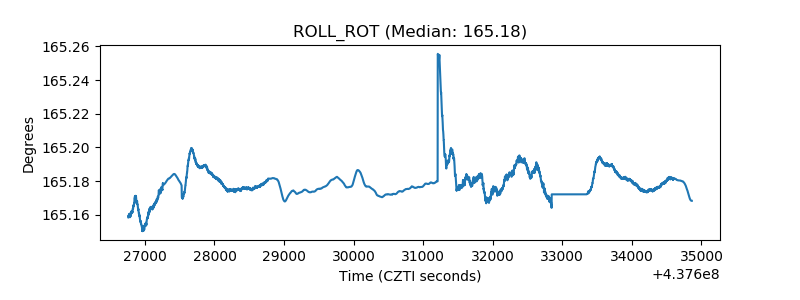 |
| _Roll_DEC | 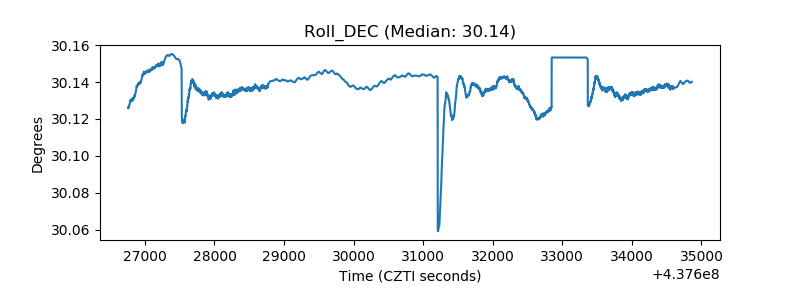 |
| _Roll_RA | 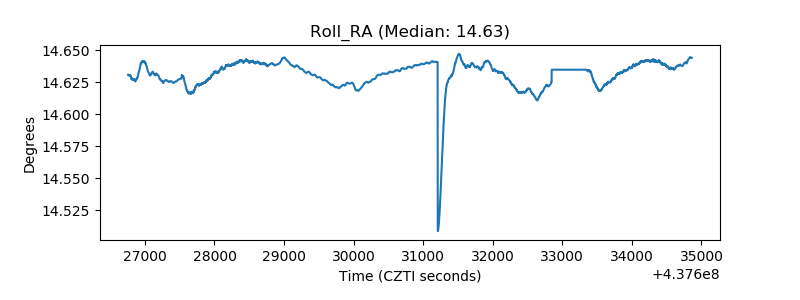 |
| Veto Counter | 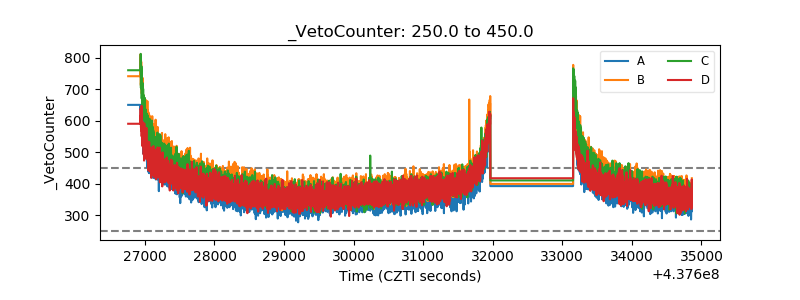 |