| Param | Original file | Final file |
|---|---|---|
| Filename | modeM0/AS1A13_025T01_9000005920_43954cztM0_level2.fits | modeM0/AS1A13_025T01_9000005920_43954cztM0_level2_quad_clean.evt |
| Size (bytes) | 455,765,760 | 108,296,640 |
| Size | 434.7 MB | 103.3 MB |
| Events in quadrant A | 6,065,343 | 704,463 |
| Events in quadrant B | 3,409,007 | 744,102 |
| Events in quadrant C | 3,111,382 | 725,166 |
| Events in quadrant D | 3,779,424 | 651,288 |
| Mode M9 | |||
|---|---|---|---|
| Quadrant | BADHDUFLAG | Total packets | Discarded packets |
| A | 0 | 11 | 0 |
| B | 0 | 11 | 0 |
| C | 0 | 11 | 0 |
| D | 0 | 11 | 0 |
| Mode SS | |||
|---|---|---|---|
| Quadrant | BADHDUFLAG | Total packets | Discarded packets |
| A | 0 | 132 | 0 |
| B | 0 | 132 | 0 |
| C | 0 | 132 | 0 |
| D | 0 | 132 | 0 |
| Mode M0 | |||
|---|---|---|---|
| Quadrant | BADHDUFLAG | Total packets | Discarded packets |
| A | 0 | 22740 | 3 |
| B | 0 | 14439 | 1 |
| C | 0 | 13882 | 1 |
| D | 0 | 15650 | 1 |
| Quadrant | Total seconds | Saturated seconds | Saturation percentage |
|---|---|---|---|
| A | 6512 | 321 | 4.929361% |
| B | 6512 | 141 | 2.165233% |
| C | 6512 | 45 | 0.691032% |
| D | 6512 | 132 | 2.027027% |
Noise dominated data is calculated using 1-second bins in cleaned event files. If a bin has >2000 counts, and if more than 50% of those come from <1% of pixels, then it is considered to be noise-dominated and hence unusable.
| Quadrant | # 1 sec bins | Bins with >0 counts | Bins with >2000 counts | High rate bins dominated by noise | Noise dominated (total time) | Noise dominated (detector-on time) | Marked lightcurve |
|---|---|---|---|---|---|---|---|
| A | 7547 | 6513 | 140 | 140 | 1.86% | 2.15% |  |
| B | 7547 | 6512 | 28 | 28 | 0.37% | 0.43% | 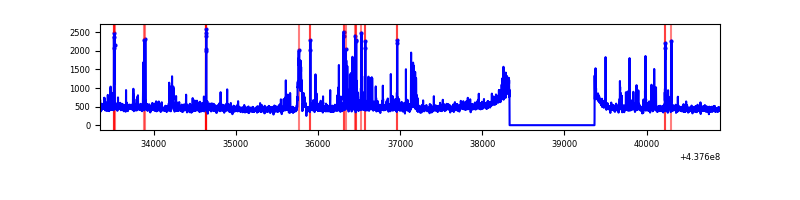 |
| C | 7547 | 6513 | 16 | 16 | 0.21% | 0.25% | 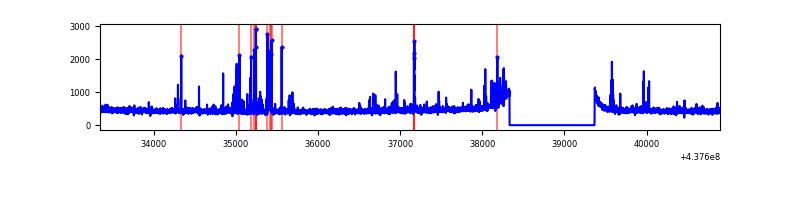 |
| D | 7547 | 6513 | 88 | 88 | 1.17% | 1.35% | 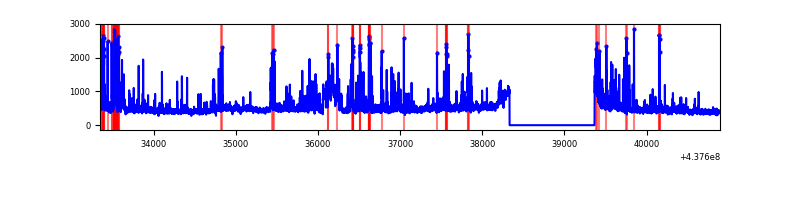 |
Top three noisy pixels from each quadrant. If the there are fewer than three noisy pixels in the level2.evt file, extra rows are filled as -1
| Pixel properties | Quadrant properties | ||||||
|---|---|---|---|---|---|---|---|
| Quadrant | DetID | PixID | Counts | Sigma | Mean | Median | Sigma |
| A | 15 | 222 | 1777424 | 11572.1 | 736 | 719 | 153.5 |
| A | 10 | 83 | 1098963 | 7153.12 | 736 | 719 | 153.5 |
| A | 14 | 238 | 292083 | 1897.72 | 736 | 719 | 153.5 |
| B | 5 | 172 | 218629 | 1485.02 | 744 | 722 | 146.7 |
| B | 5 | 235 | 138857 | 941.38 | 744 | 722 | 146.7 |
| B | 0 | 213 | 29609 | 196.86 | 744 | 722 | 146.7 |
| C | 14 | 254 | 107321 | 615.0 | 731 | 736 | 173.3 |
| C | 1 | 241 | 66419 | 379.0 | 731 | 736 | 173.3 |
| C | 15 | 157 | 56267 | 320.42 | 731 | 736 | 173.3 |
| D | 5 | 235 | 390003 | 2135.82 | 723 | 701 | 182.3 |
| D | 4 | 235 | 184917 | 1010.66 | 723 | 701 | 182.3 |
| D | 2 | 136 | 102438 | 558.16 | 723 | 701 | 182.3 |
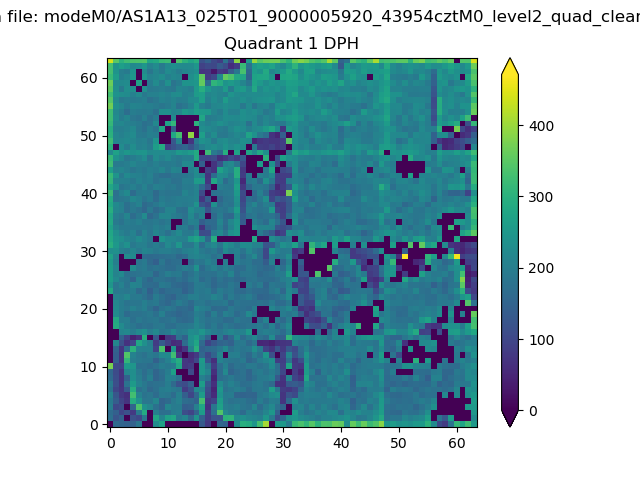
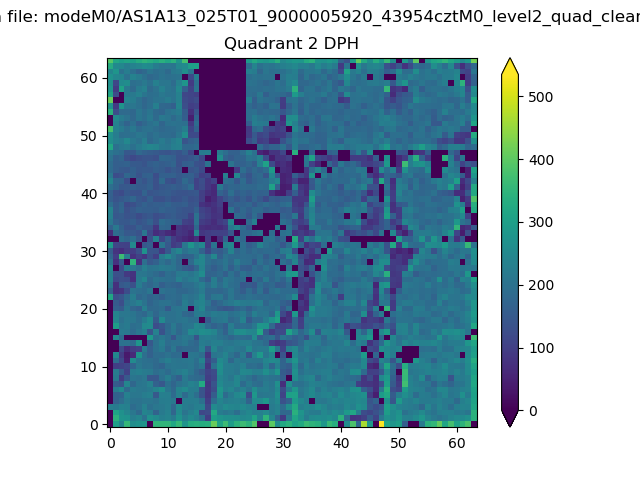
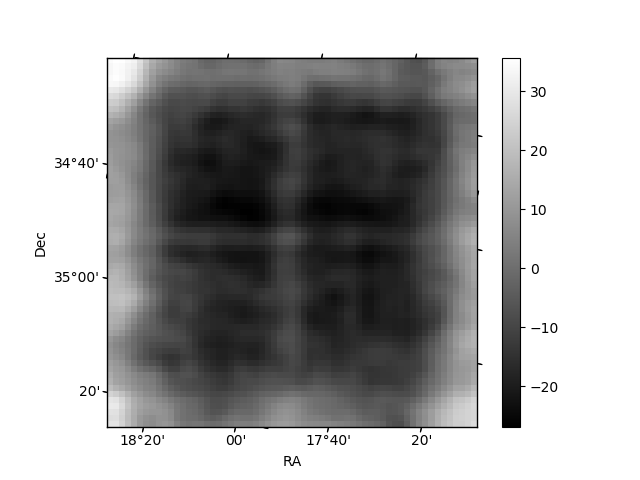
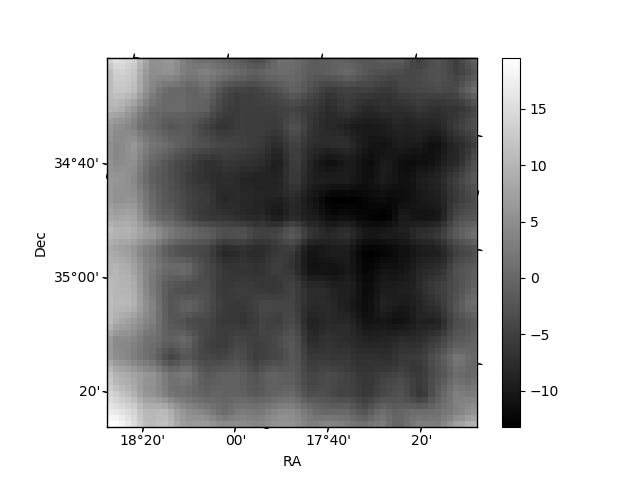
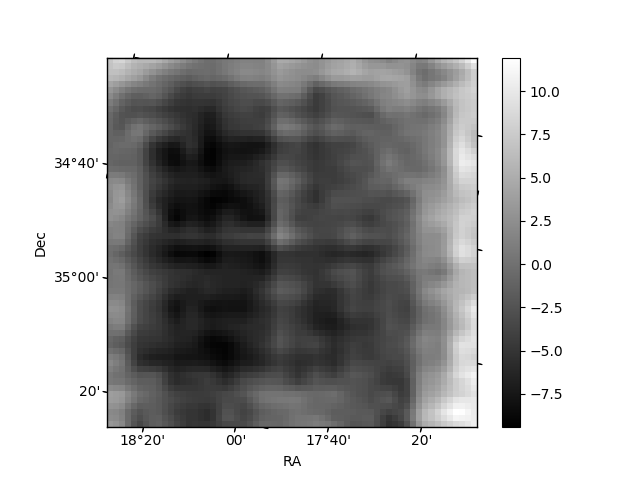
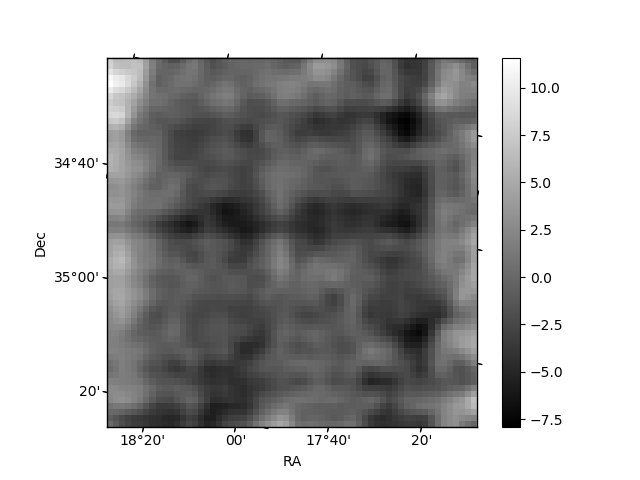
Histogram calculated using DETX and DETY for each event in the final _common_clean file
| Quadrant A | 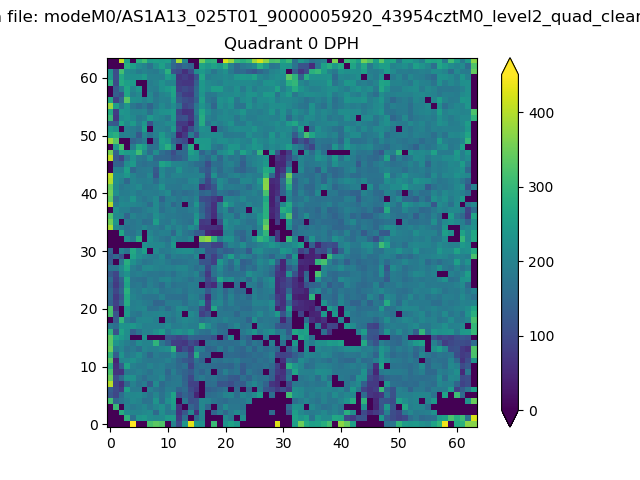 |
 |
Quadrant B |
|---|---|---|---|
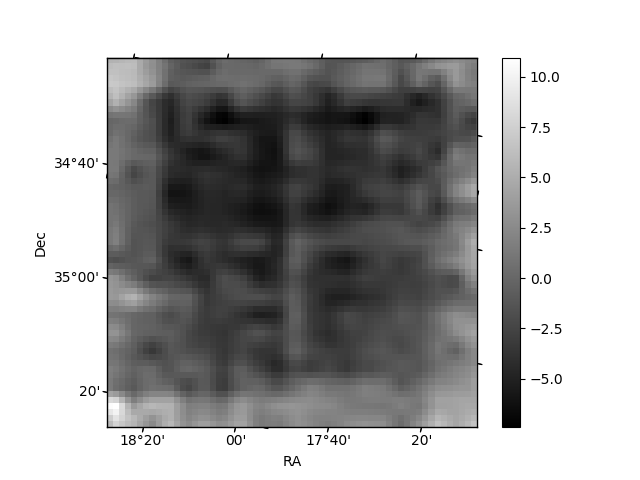
| Quadrant D | 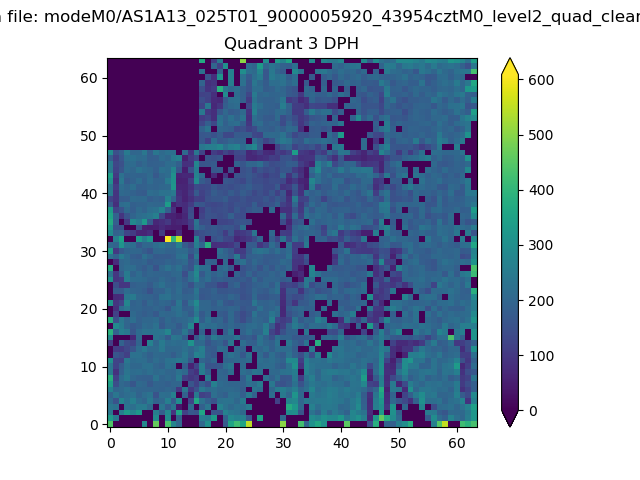 |
 |
Quadrant C |
| Plot type | Count rate plots | Images |
|---|---|---|
| Comparison with Poisson distribution Blue bars denote a histogram of data divided into 1 sec bins. Red curve is a Poisson curve with rate = median count rate of data. |
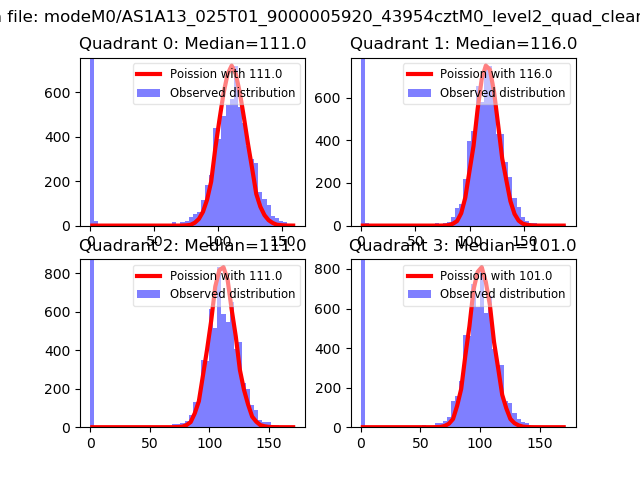 |
 |
| Quadrant-wise count rates Data is divided into 100 sec bins |
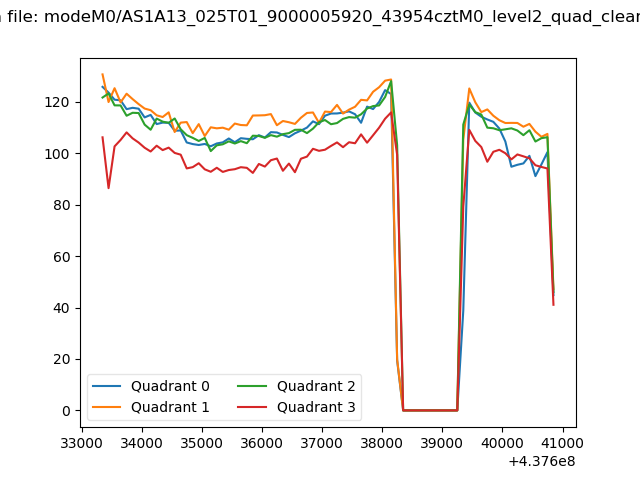 |
|
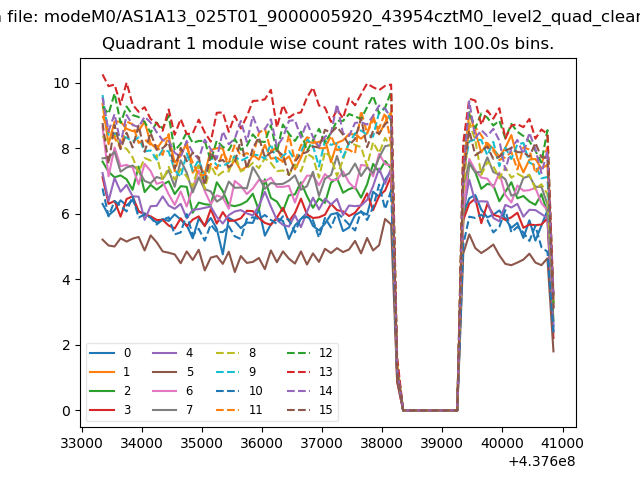
| Module-wise count rates for Quadrant A Data is divided into 100 sec bins |
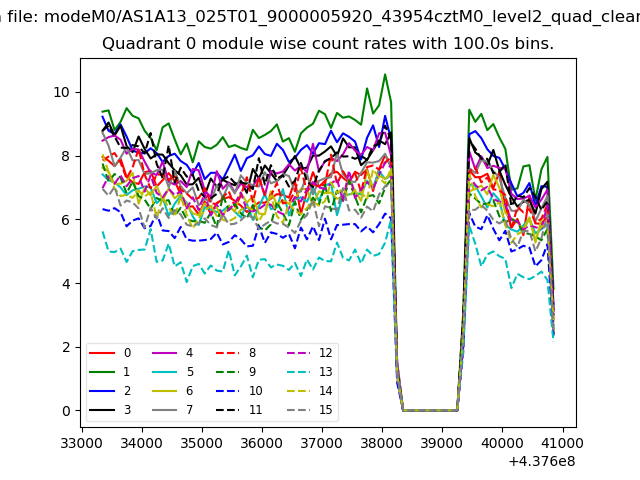 |
 |
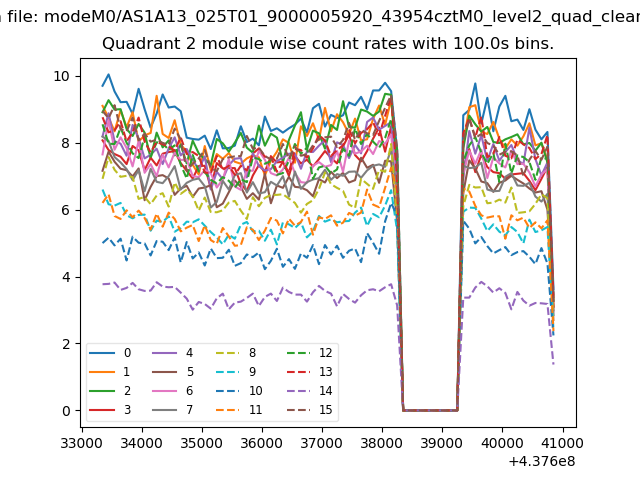
| Module-wise count rates for Quadrant B Data is divided into 100 sec bins |
 |
 |
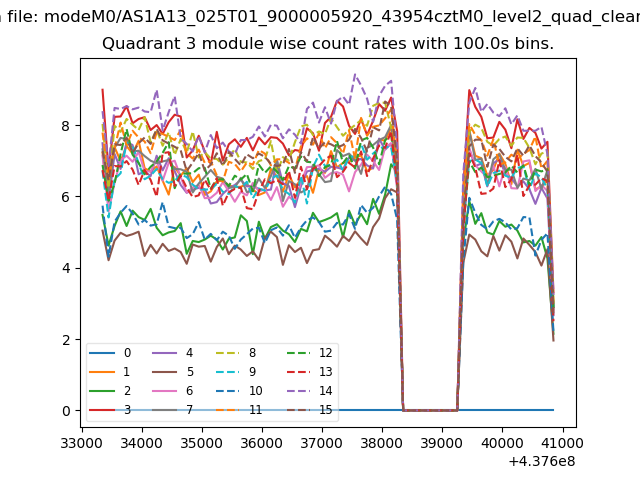
| Module-wise count rates for Quadrant C Data is divided into 100 sec bins |
 |
 |
| Module-wise count rates for Quadrant D Data is divided into 100 sec bins |
 |
 |
| Parameter | Plot |
|---|---|
| CZT HV Monitor | 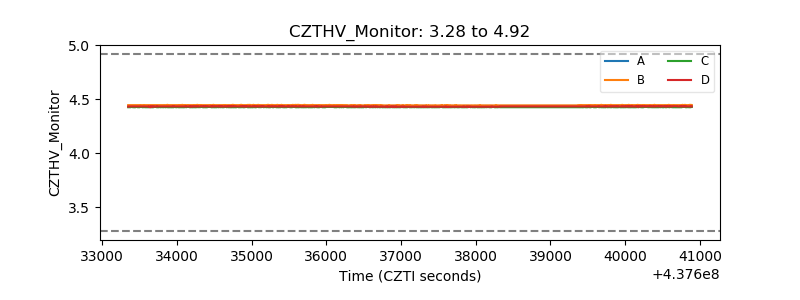 |
| D_VDD | 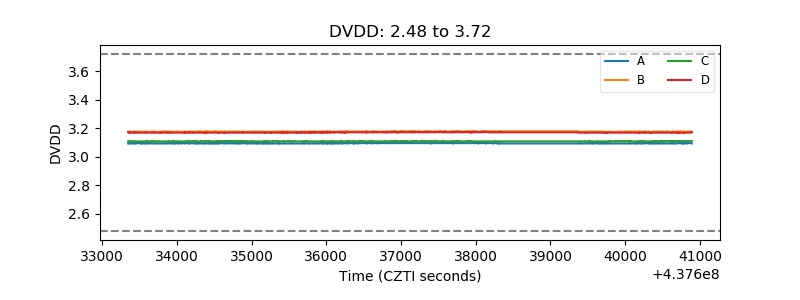 |
| Temperature 1 | 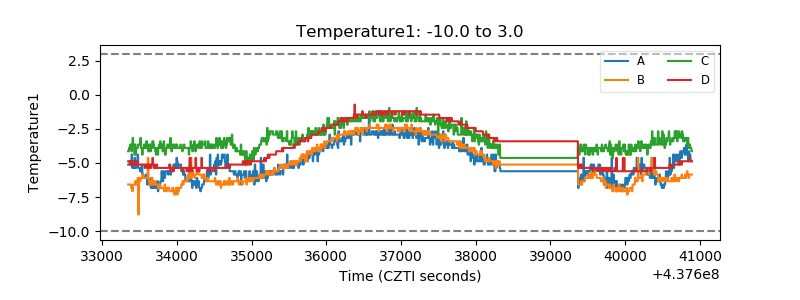 |
| Veto HV Monitor | 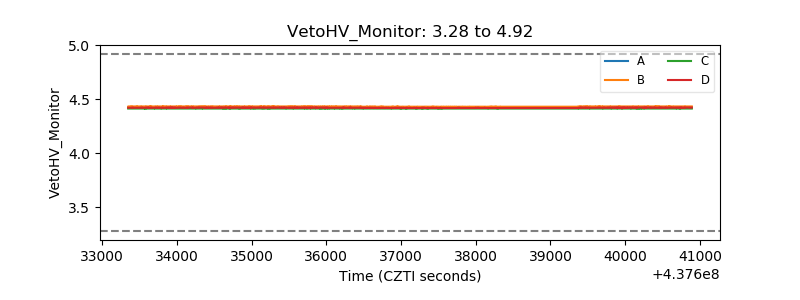 |
| Veto LLD | 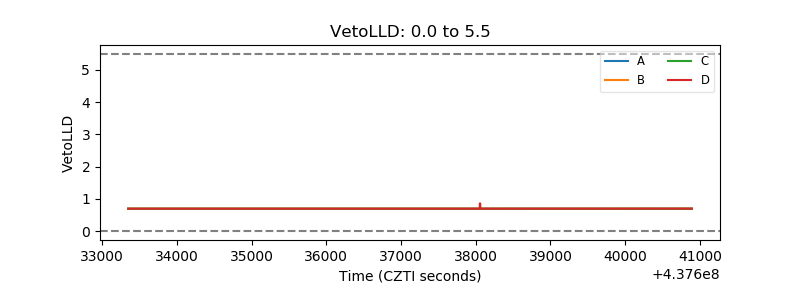 |
| Alpha Counter | 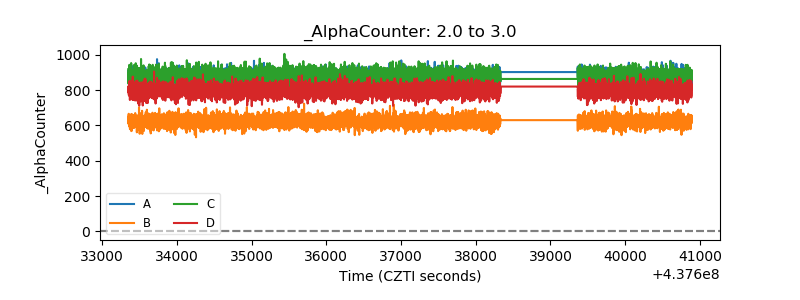 |
| _CPM_Rate | 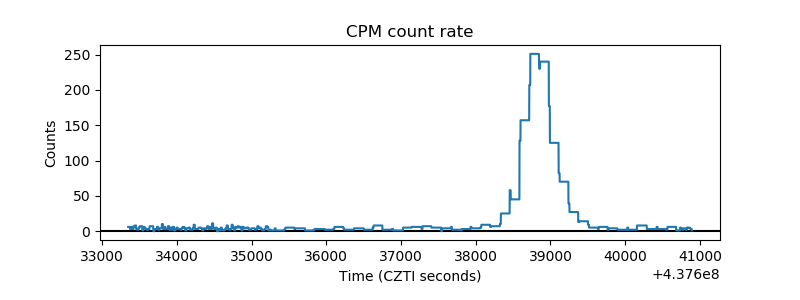 |
| CZT Counter | 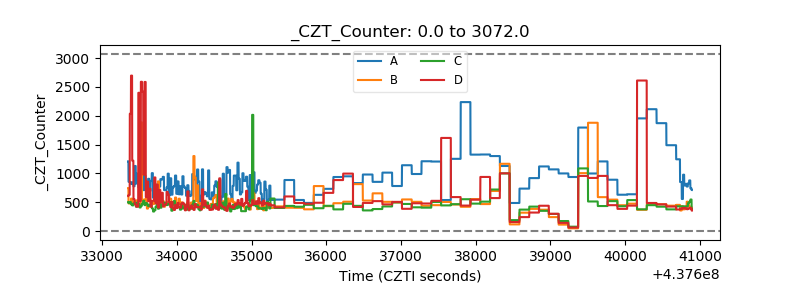 |
| +2.5 Volts monitor | 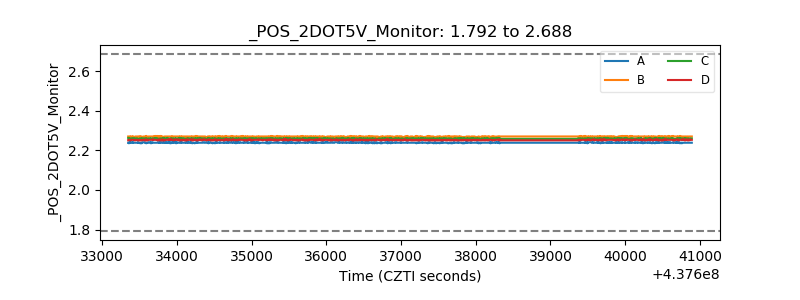 |
| +5 Volts monitor | 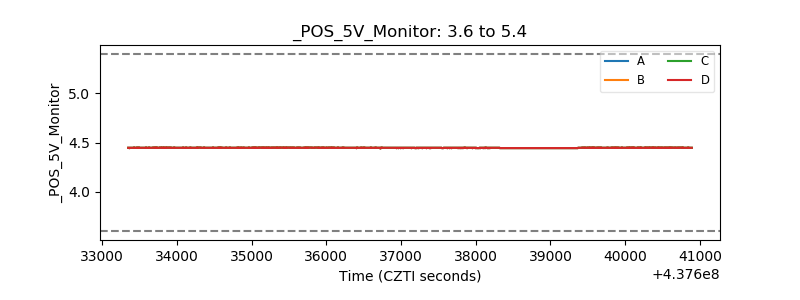 |
| _ROLL_ROT | 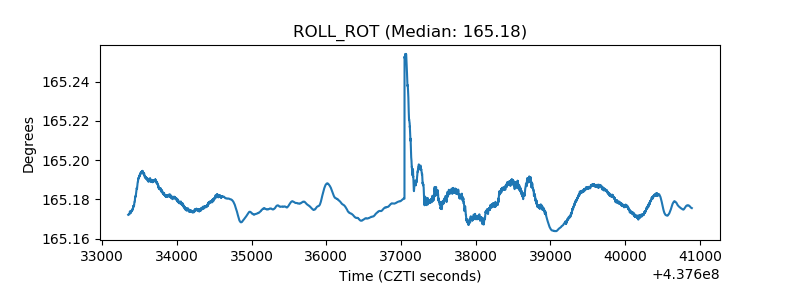 |
| _Roll_DEC | 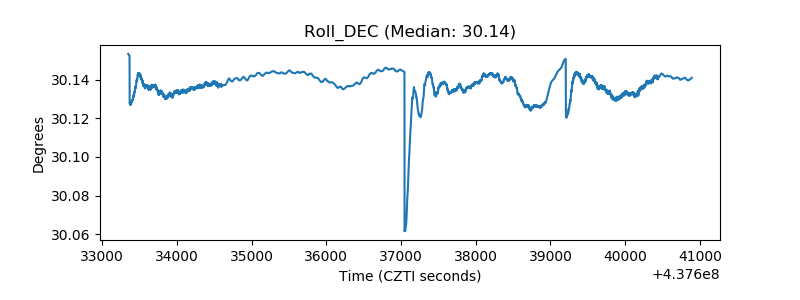 |
| _Roll_RA | 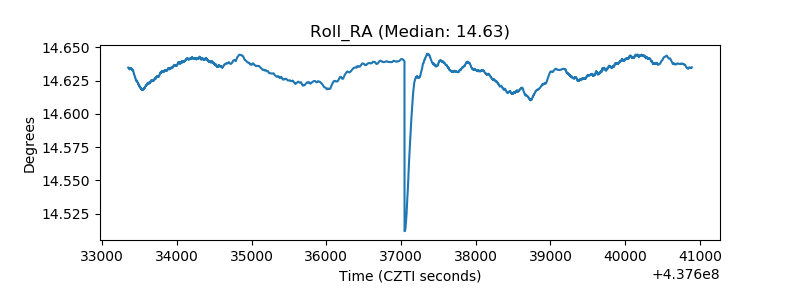 |
| Veto Counter | 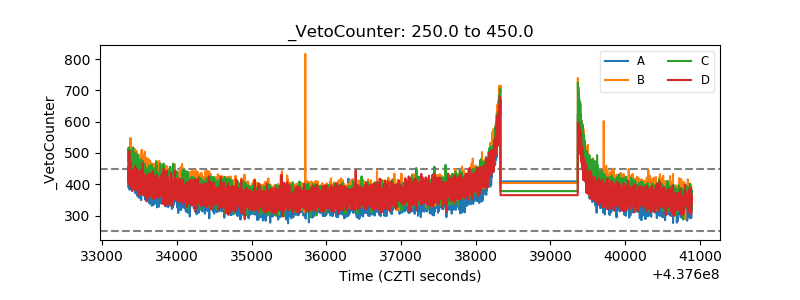 |