| Param | Original file | Final file |
|---|---|---|
| Filename | modeM0/AS1A13_025T01_9000005920_43955cztM0_level2.fits | modeM0/AS1A13_025T01_9000005920_43955cztM0_level2_quad_clean.evt |
| Size (bytes) | 511,136,640 | 112,363,200 |
| Size | 487.5 MB | 107.2 MB |
| Events in quadrant A | 6,908,551 | 713,791 |
| Events in quadrant B | 3,714,076 | 763,832 |
| Events in quadrant C | 3,443,657 | 758,244 |
| Events in quadrant D | 4,307,250 | 676,399 |
| Mode M9 | |||
|---|---|---|---|
| Quadrant | BADHDUFLAG | Total packets | Discarded packets |
| A | 0 | 18 | 0 |
| B | 0 | 18 | 0 |
| C | 0 | 18 | 0 |
| D | 0 | 18 | 0 |
| Mode SS | |||
|---|---|---|---|
| Quadrant | BADHDUFLAG | Total packets | Discarded packets |
| A | 0 | 142 | 0 |
| B | 0 | 142 | 0 |
| C | 0 | 142 | 0 |
| D | 0 | 142 | 0 |
| Mode M0 | |||
|---|---|---|---|
| Quadrant | BADHDUFLAG | Total packets | Discarded packets |
| A | 0 | 25586 | 2 |
| B | 0 | 15836 | 2 |
| C | 0 | 15335 | 2 |
| D | 0 | 17836 | 2 |
| Quadrant | Total seconds | Saturated seconds | Saturation percentage |
|---|---|---|---|
| A | 7043 | 659 | 9.356808% |
| B | 7043 | 307 | 4.358938% |
| C | 7043 | 113 | 1.604430% |
| D | 7044 | 292 | 4.145372% |
Noise dominated data is calculated using 1-second bins in cleaned event files. If a bin has >2000 counts, and if more than 50% of those come from <1% of pixels, then it is considered to be noise-dominated and hence unusable.
| Quadrant | # 1 sec bins | Bins with >0 counts | Bins with >2000 counts | High rate bins dominated by noise | Noise dominated (total time) | Noise dominated (detector-on time) | Marked lightcurve |
|---|---|---|---|---|---|---|---|
| A | 8768 | 7045 | 302 | 302 | 3.44% | 4.29% | 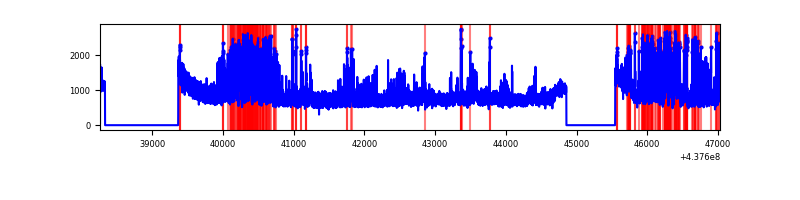 |
| B | 8768 | 7043 | 48 | 48 | 0.55% | 0.68% | 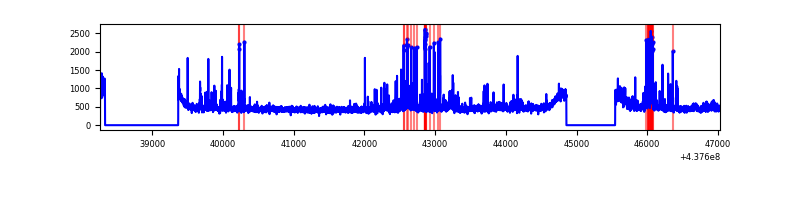 |
| C | 8768 | 7045 | 29 | 29 | 0.33% | 0.41% | 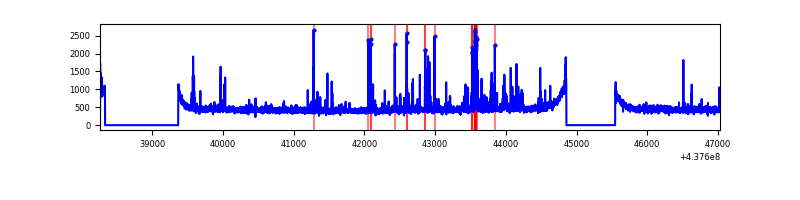 |
| D | 8769 | 7046 | 155 | 155 | 1.77% | 2.20% | 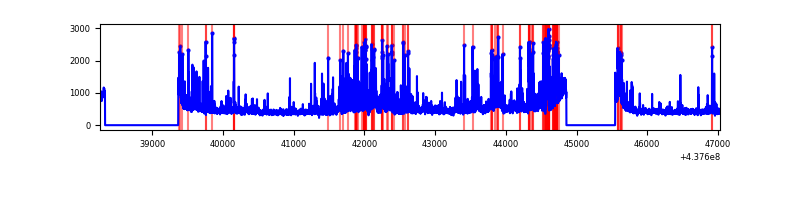 |
Top three noisy pixels from each quadrant. If the there are fewer than three noisy pixels in the level2.evt file, extra rows are filled as -1
| Pixel properties | Quadrant properties | ||||||
|---|---|---|---|---|---|---|---|
| Quadrant | DetID | PixID | Counts | Sigma | Mean | Median | Sigma |
| A | 15 | 222 | 1426517 | 8564.86 | 795 | 775 | 166.5 |
| A | 10 | 83 | 1237632 | 7430.17 | 795 | 775 | 166.5 |
| A | 14 | 238 | 1129332 | 6779.58 | 795 | 775 | 166.5 |
| B | 5 | 172 | 247158 | 1522.98 | 809 | 781 | 161.8 |
| B | 0 | 200 | 87588 | 536.6 | 809 | 781 | 161.8 |
| B | 5 | 235 | 49149 | 298.99 | 809 | 781 | 161.8 |
| C | 1 | 241 | 140535 | 738.66 | 801 | 806 | 189.2 |
| C | 15 | 157 | 94802 | 496.9 | 801 | 806 | 189.2 |
| C | 14 | 254 | 55549 | 289.39 | 801 | 806 | 189.2 |
| D | 5 | 235 | 235991 | 1183.3 | 789 | 765 | 198.8 |
| D | 2 | 120 | 192614 | 965.09 | 789 | 765 | 198.8 |
| D | 12 | 17 | 192602 | 965.03 | 789 | 765 | 198.8 |
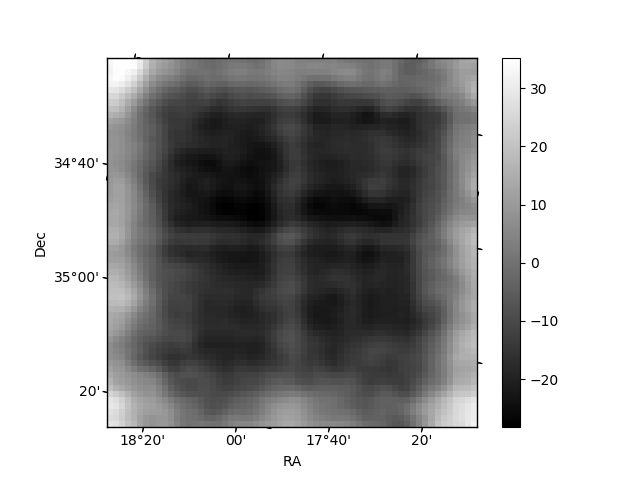
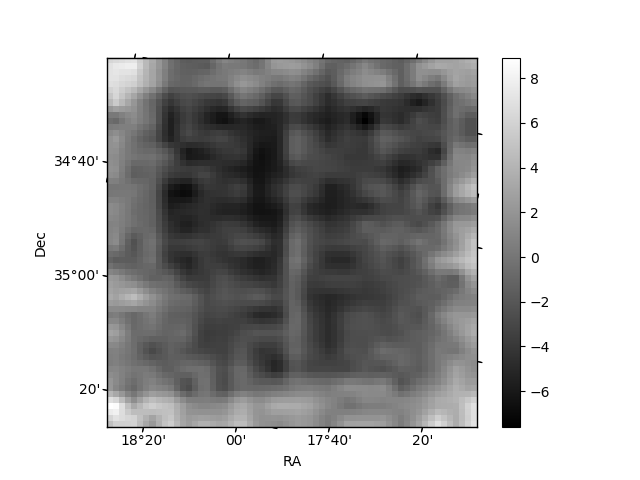
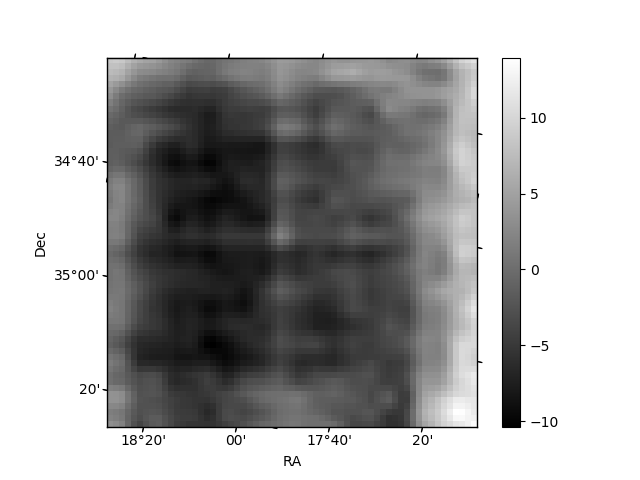
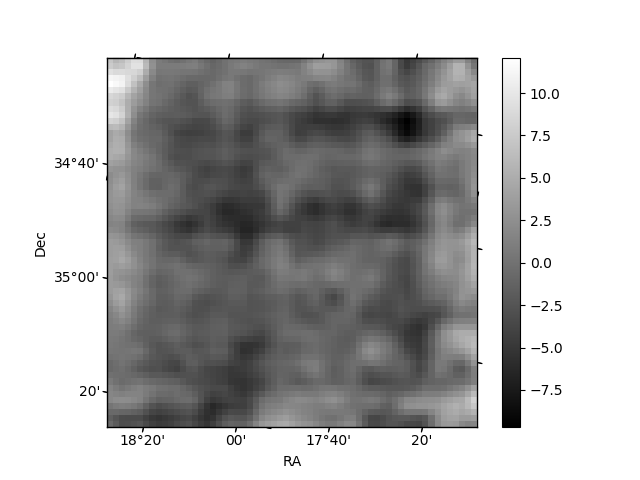
Histogram calculated using DETX and DETY for each event in the final _common_clean file
| Quadrant A | 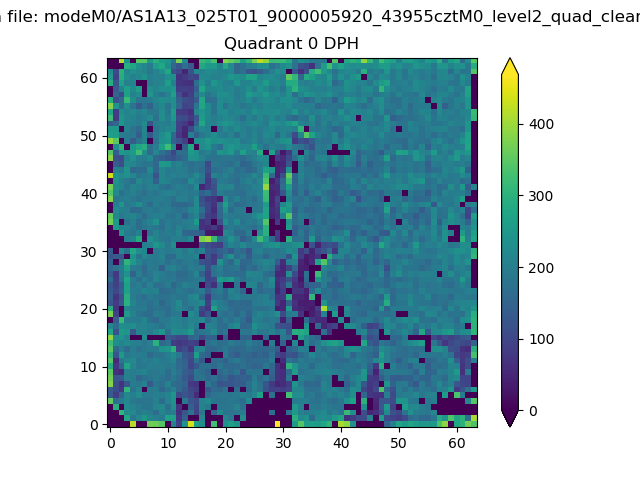 |
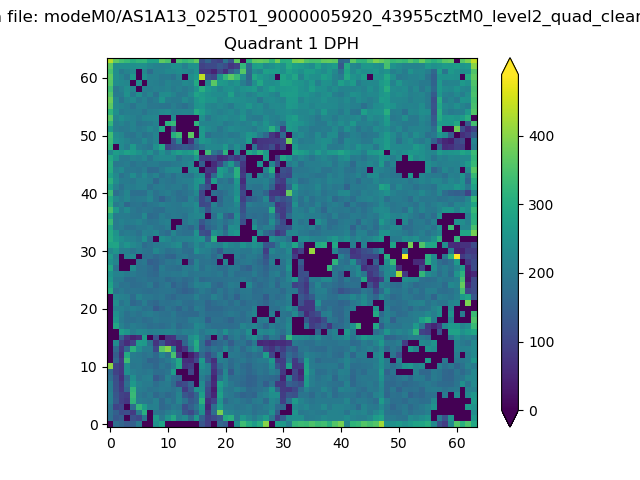 |
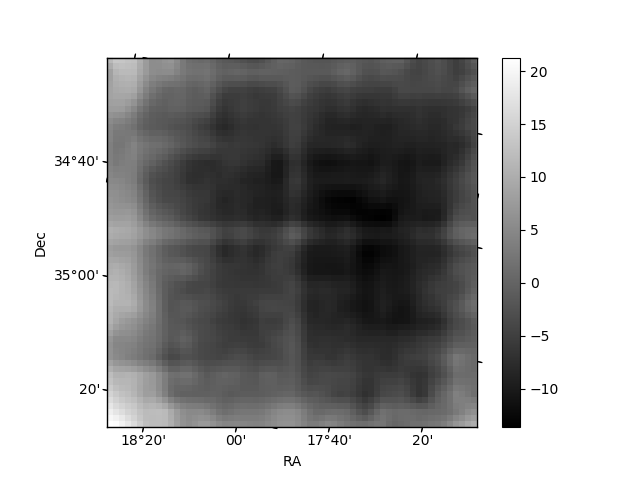
Quadrant B |
|---|---|---|---|
| Quadrant D | 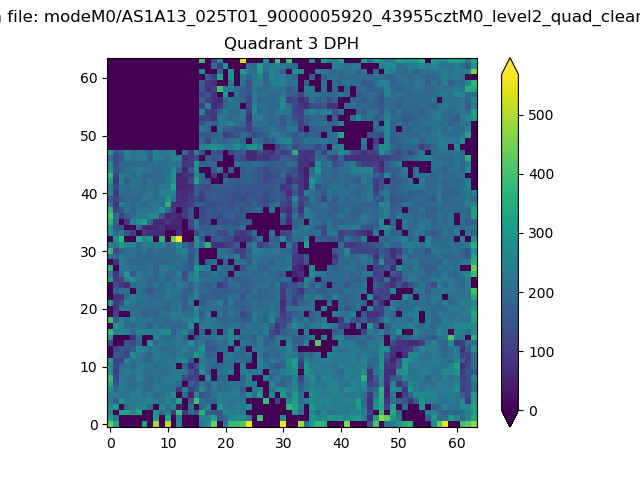 |
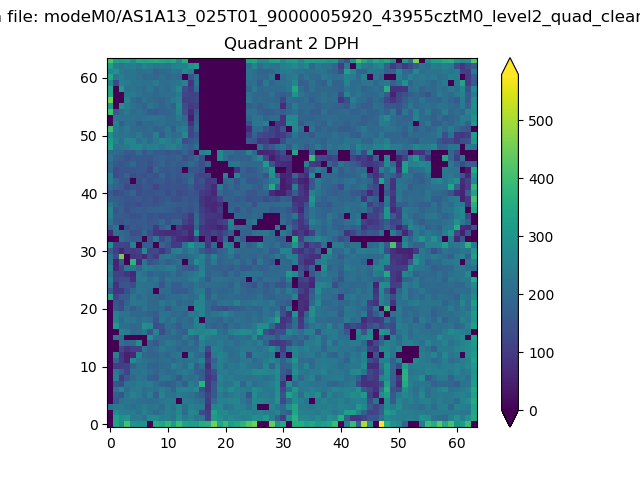 |
Quadrant C |
| Plot type | Count rate plots | Images |
|---|---|---|
| Comparison with Poisson distribution Blue bars denote a histogram of data divided into 1 sec bins. Red curve is a Poisson curve with rate = median count rate of data. |
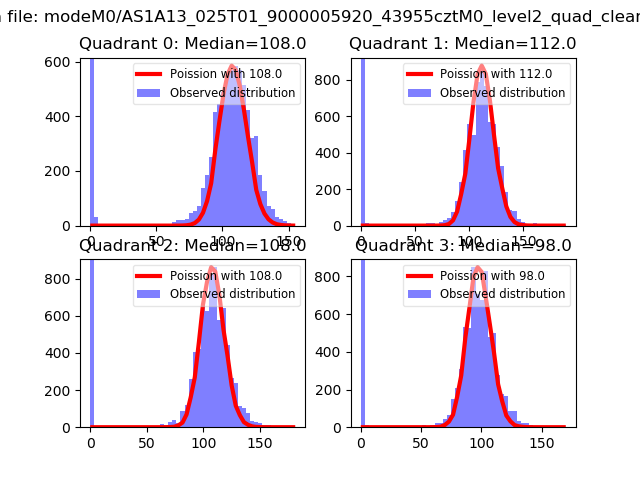 |
 |
| Quadrant-wise count rates Data is divided into 100 sec bins |
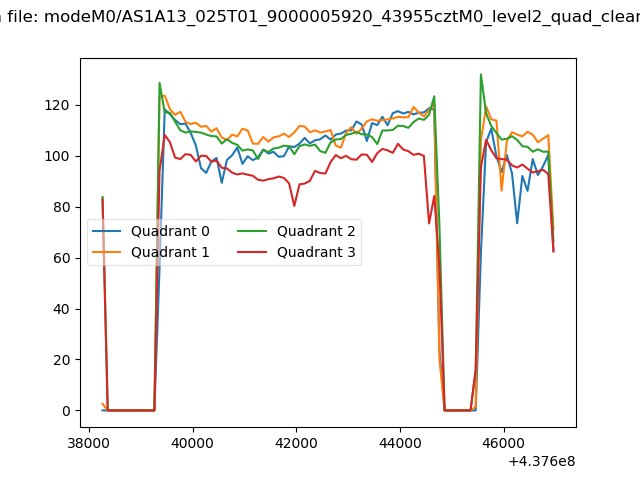 |
|
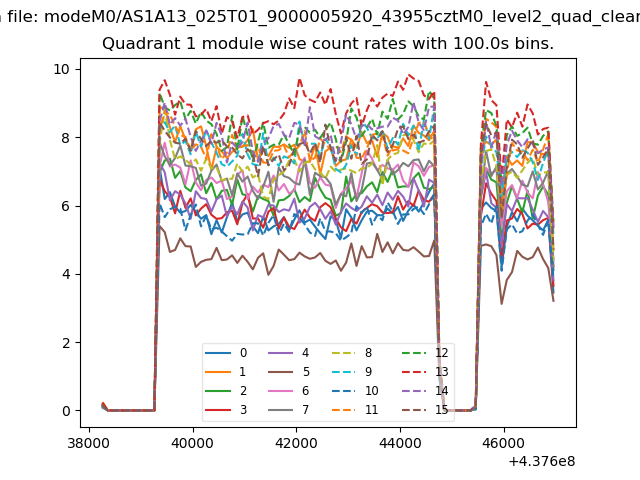
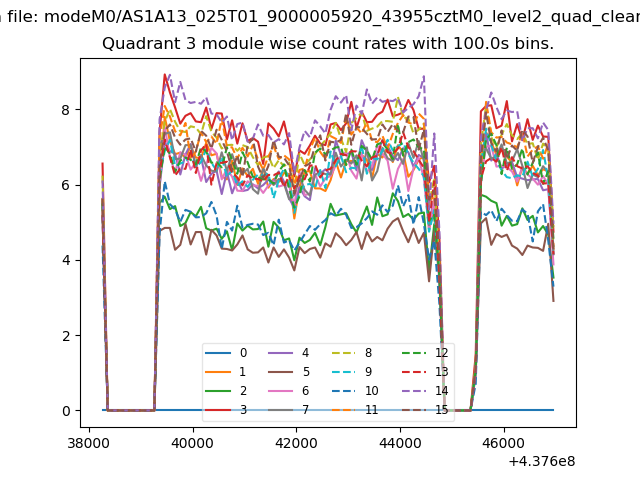
| Module-wise count rates for Quadrant A Data is divided into 100 sec bins |
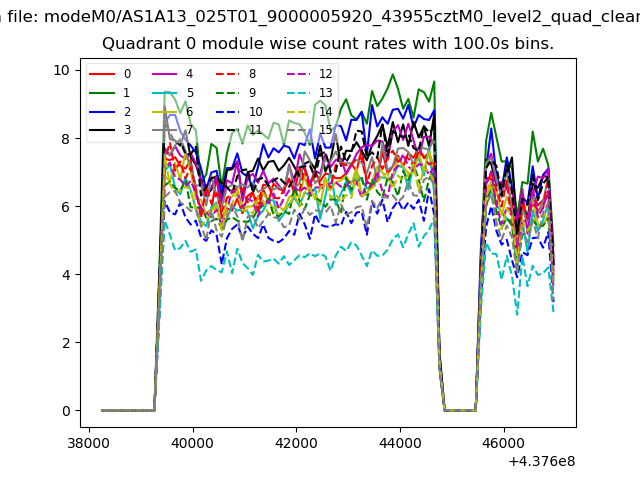 |
 |
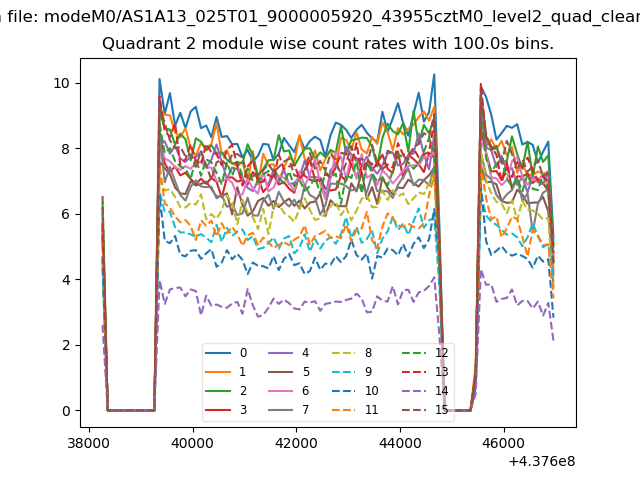
| Module-wise count rates for Quadrant B Data is divided into 100 sec bins |
 |
 |
| Module-wise count rates for Quadrant C Data is divided into 100 sec bins |
 |
 |
| Module-wise count rates for Quadrant D Data is divided into 100 sec bins |
 |
 |
| Parameter | Plot |
|---|---|
| CZT HV Monitor | 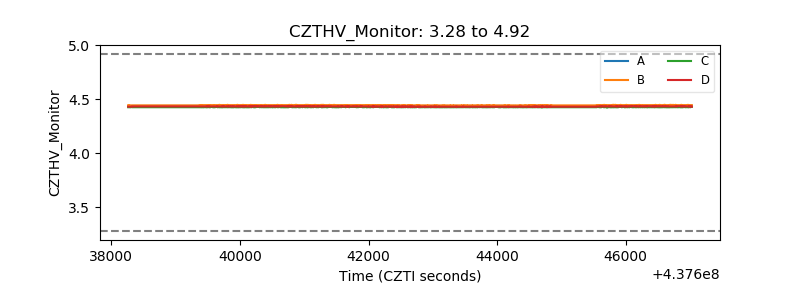 |
| D_VDD | 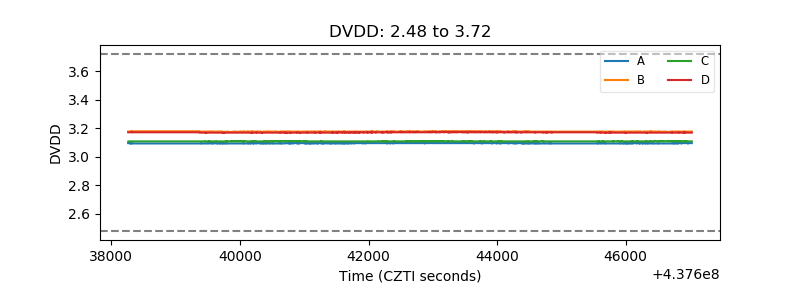 |
| Temperature 1 | 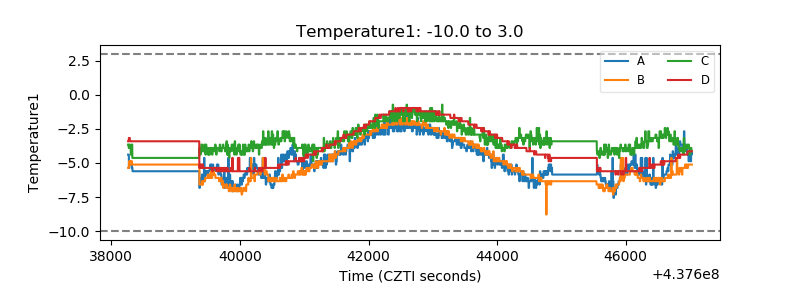 |
| Veto HV Monitor | 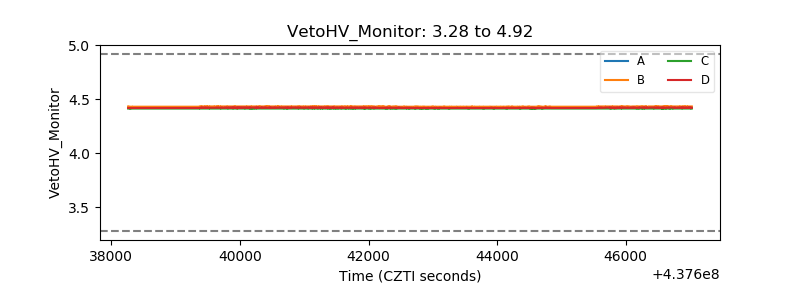 |
| Veto LLD | 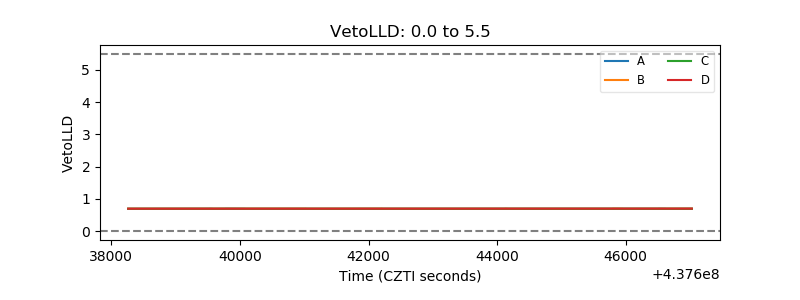 |
| Alpha Counter | 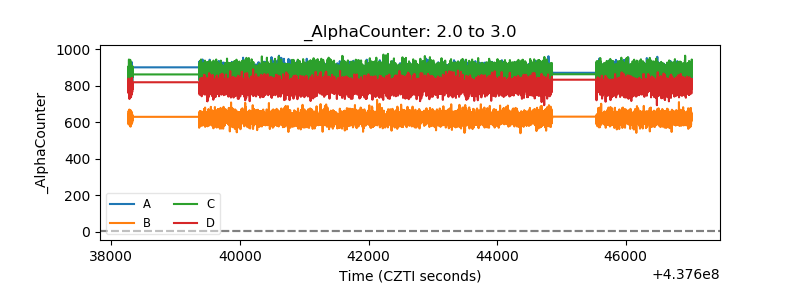 |
| _CPM_Rate | 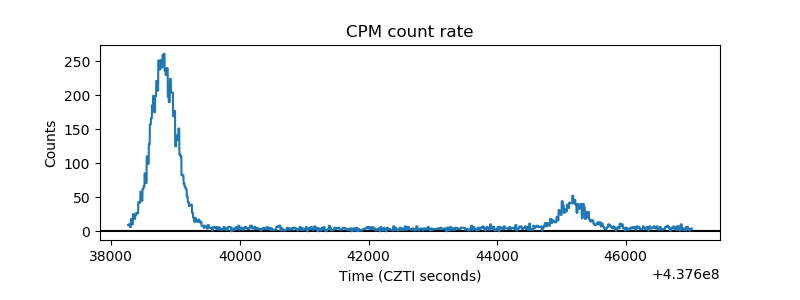 |
| CZT Counter | 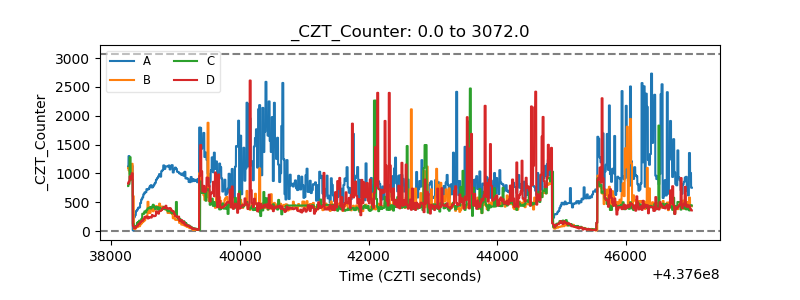 |
| +2.5 Volts monitor | 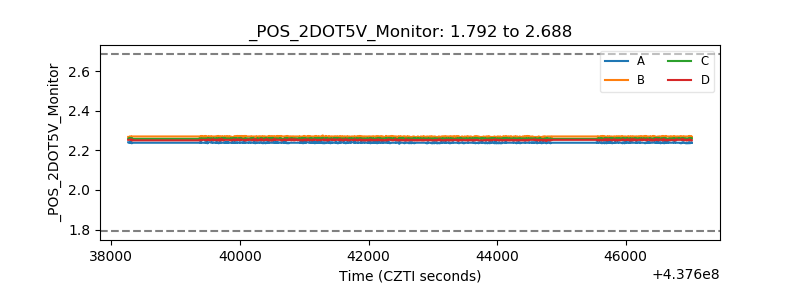 |
| +5 Volts monitor | 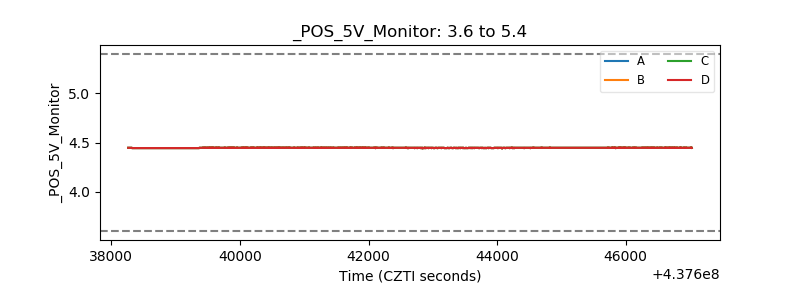 |
| _ROLL_ROT | 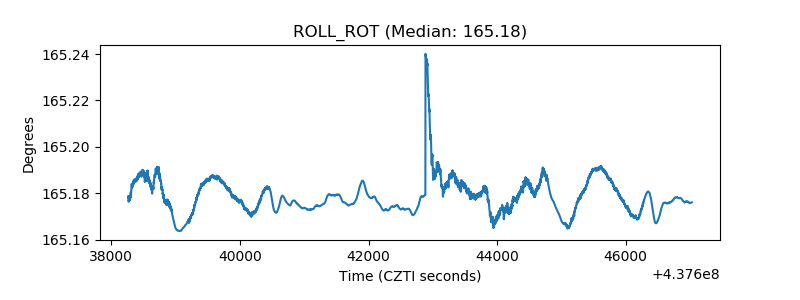 |
| _Roll_DEC | 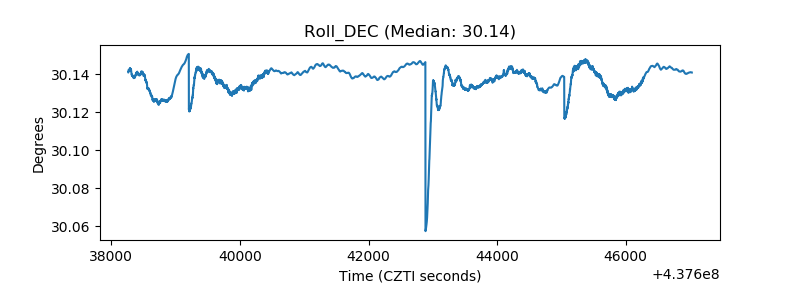 |
| _Roll_RA | 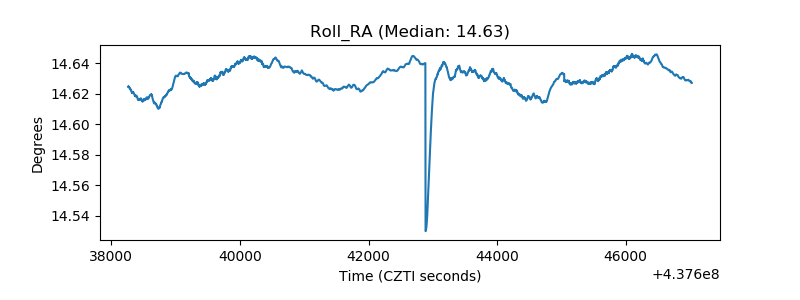 |
| Veto Counter | 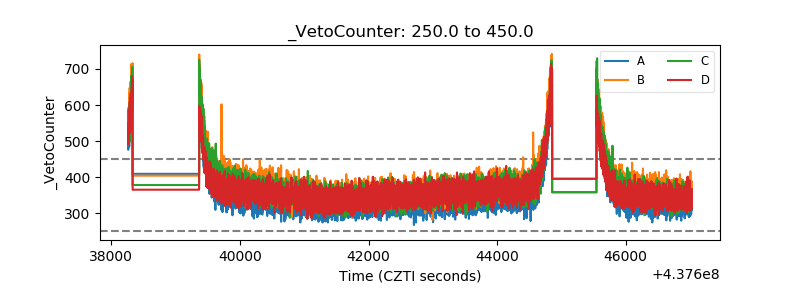 |