| Param | Original file | Final file |
|---|---|---|
| Filename | modeM0/AS1A13_025T01_9000005920_43956cztM0_level2.fits | modeM0/AS1A13_025T01_9000005920_43956cztM0_level2_quad_clean.evt |
| Size (bytes) | 615,147,840 | 121,711,680 |
| Size | 586.7 MB | 116.1 MB |
| Events in quadrant A | 8,227,610 | 745,551 |
| Events in quadrant B | 5,160,572 | 818,266 |
| Events in quadrant C | 4,007,949 | 834,388 |
| Events in quadrant D | 4,763,446 | 739,118 |
| Mode M9 | |||
|---|---|---|---|
| Quadrant | BADHDUFLAG | Total packets | Discarded packets |
| A | 0 | 3 | 0 |
| B | 0 | 3 | 0 |
| C | 0 | 3 | 0 |
| D | 0 | 4 | 0 |
| Mode SS | |||
|---|---|---|---|
| Quadrant | BADHDUFLAG | Total packets | Discarded packets |
| A | 0 | 158 | 0 |
| B | 0 | 158 | 0 |
| C | 0 | 158 | 0 |
| D | 0 | 158 | 0 |
| Mode M0 | |||
|---|---|---|---|
| Quadrant | BADHDUFLAG | Total packets | Discarded packets |
| A | 0 | 30055 | 1 |
| B | 0 | 20717 | 1 |
| C | 0 | 17587 | 1 |
| D | 0 | 19650 | 1 |
| Quadrant | Total seconds | Saturated seconds | Saturation percentage |
|---|---|---|---|
| A | 7879 | 1144 | 14.519609% |
| B | 7879 | 608 | 7.716715% |
| C | 7879 | 201 | 2.551085% |
| D | 7879 | 410 | 5.203706% |
Noise dominated data is calculated using 1-second bins in cleaned event files. If a bin has >2000 counts, and if more than 50% of those come from <1% of pixels, then it is considered to be noise-dominated and hence unusable.
| Quadrant | # 1 sec bins | Bins with >0 counts | Bins with >2000 counts | High rate bins dominated by noise | Noise dominated (total time) | Noise dominated (detector-on time) | Marked lightcurve |
|---|---|---|---|---|---|---|---|
| A | 7879 | 7879 | 515 | 515 | 6.54% | 6.54% | 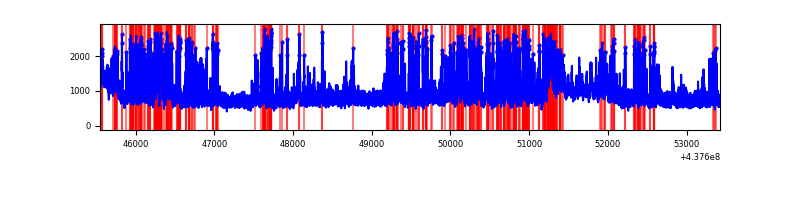 |
| B | 7878 | 7878 | 125 | 125 | 1.59% | 1.59% | 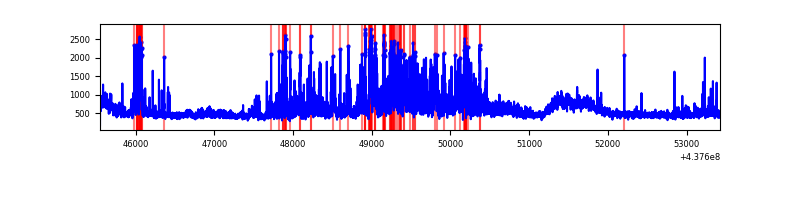 |
| C | 7879 | 7879 | 38 | 38 | 0.48% | 0.48% | 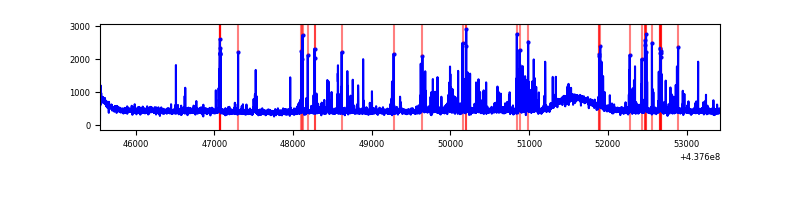 |
| D | 7879 | 7879 | 176 | 176 | 2.23% | 2.23% | 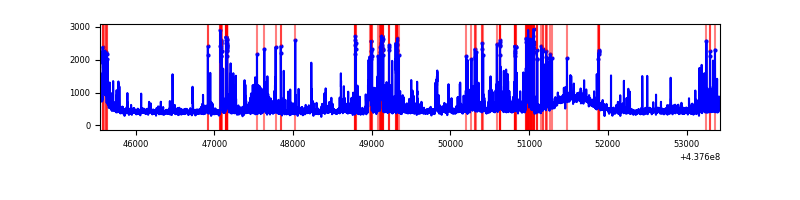 |
Top three noisy pixels from each quadrant. If the there are fewer than three noisy pixels in the level2.evt file, extra rows are filled as -1
| Pixel properties | Quadrant properties | ||||||
|---|---|---|---|---|---|---|---|
| Quadrant | DetID | PixID | Counts | Sigma | Mean | Median | Sigma |
| A | 14 | 238 | 2197786 | 11967.84 | 877 | 855 | 183.6 |
| A | 10 | 83 | 1237797 | 6738.28 | 877 | 855 | 183.6 |
| A | 15 | 222 | 1131641 | 6159.99 | 877 | 855 | 183.6 |
| B | 0 | 200 | 989122 | 5458.24 | 905 | 873 | 181.1 |
| B | 5 | 172 | 325816 | 1794.71 | 905 | 873 | 181.1 |
| B | 4 | 171 | 118525 | 649.81 | 905 | 873 | 181.1 |
| C | 14 | 254 | 258707 | 1213.18 | 902 | 904 | 212.5 |
| C | 15 | 157 | 155763 | 728.74 | 902 | 904 | 212.5 |
| C | 3 | 233 | 52759 | 244.02 | 902 | 904 | 212.5 |
| D | 12 | 17 | 272701 | 1207.32 | 894 | 863 | 225.2 |
| D | 13 | 171 | 262090 | 1160.19 | 894 | 863 | 225.2 |
| D | 5 | 235 | 248822 | 1101.26 | 894 | 863 | 225.2 |
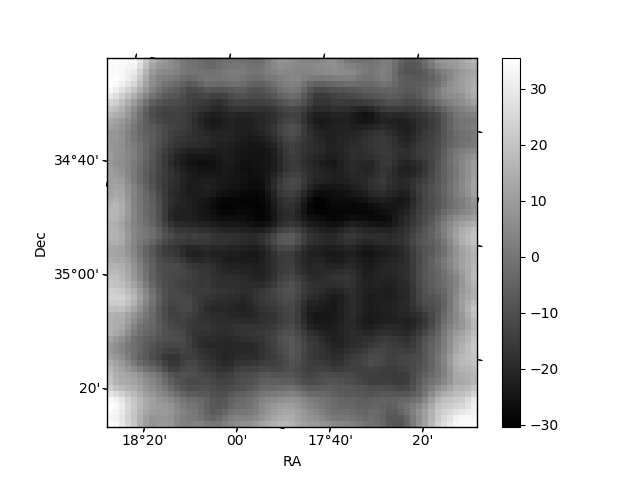
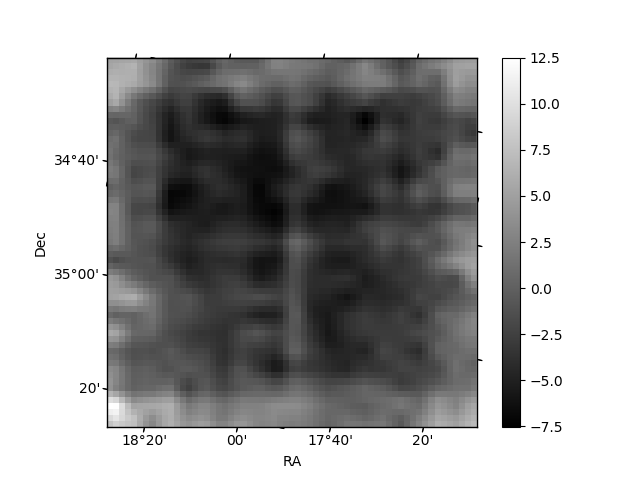
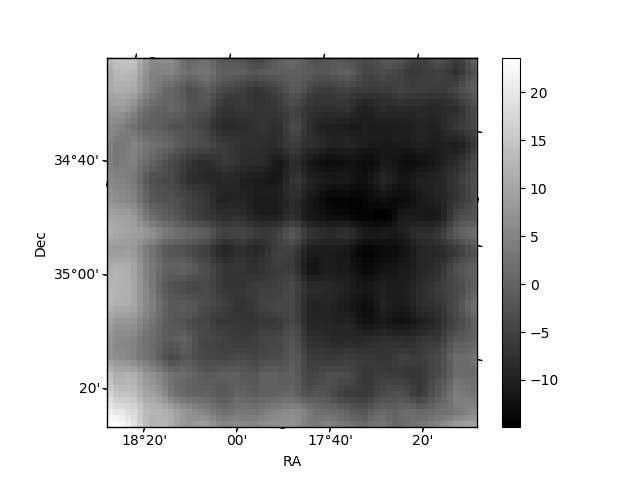
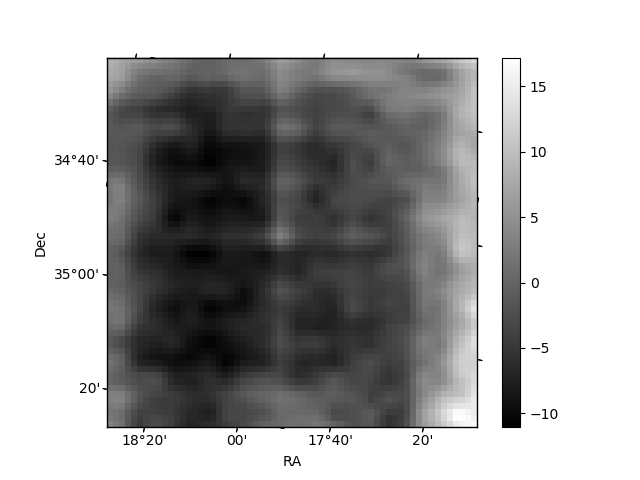
Histogram calculated using DETX and DETY for each event in the final _common_clean file
| Quadrant A | 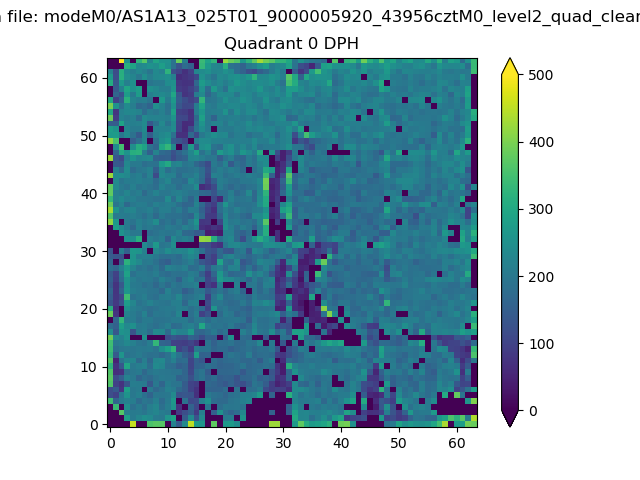 |
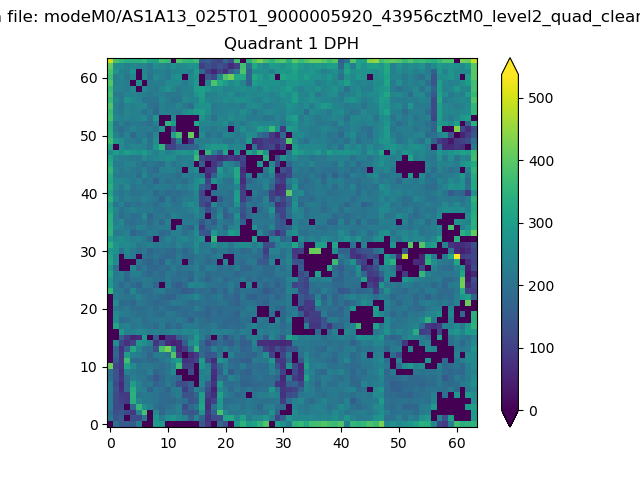 |
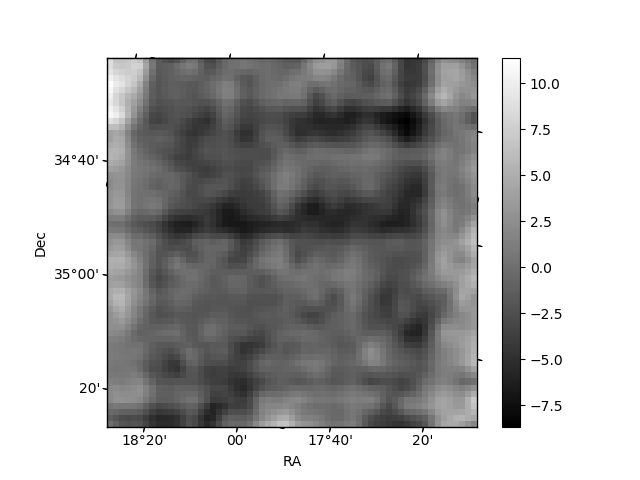
Quadrant B |
|---|---|---|---|
| Quadrant D | 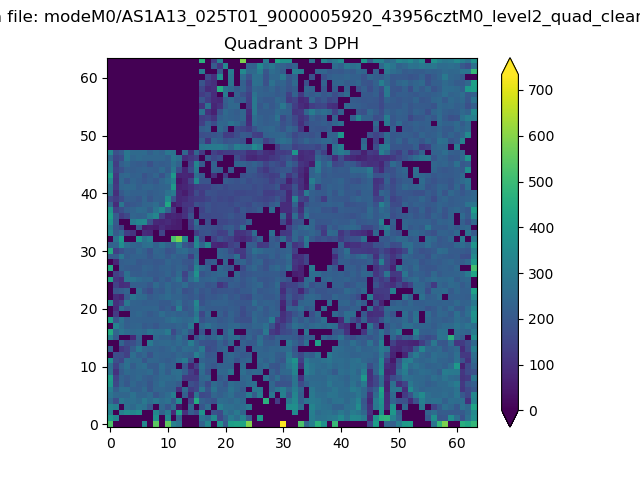 |
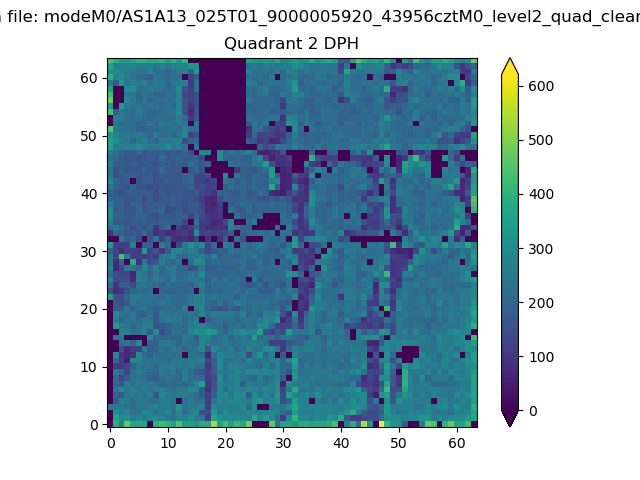 |
Quadrant C |
| Plot type | Count rate plots | Images |
|---|---|---|
| Comparison with Poisson distribution Blue bars denote a histogram of data divided into 1 sec bins. Red curve is a Poisson curve with rate = median count rate of data. |
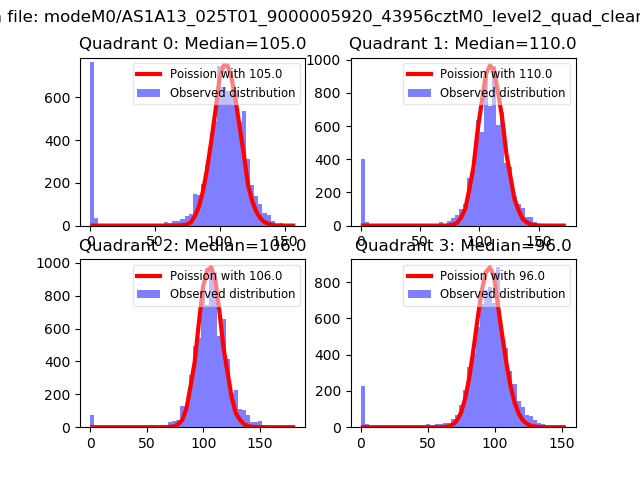 |
 |
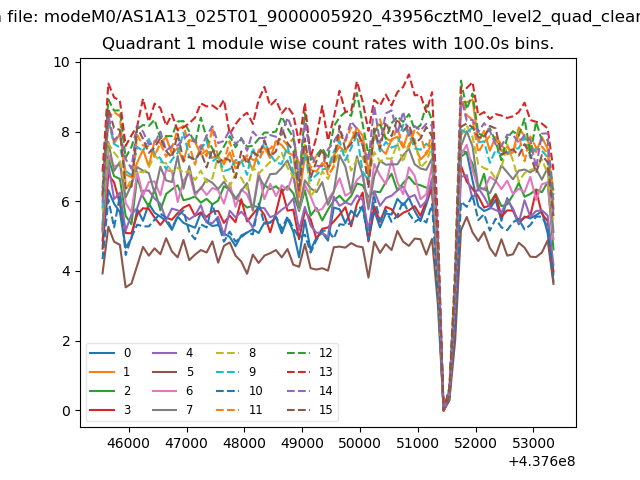
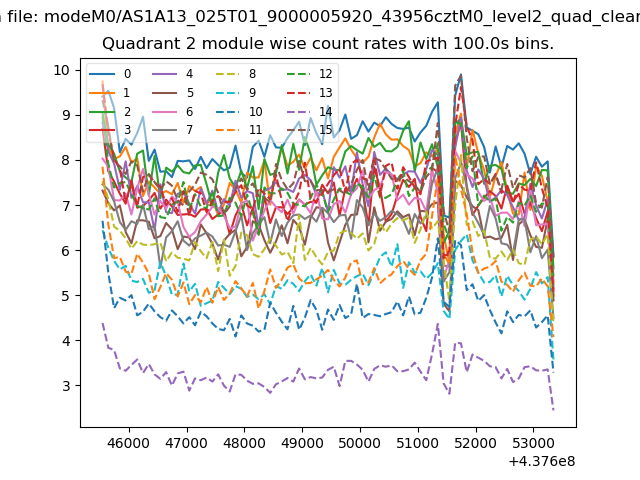
| Quadrant-wise count rates Data is divided into 100 sec bins |
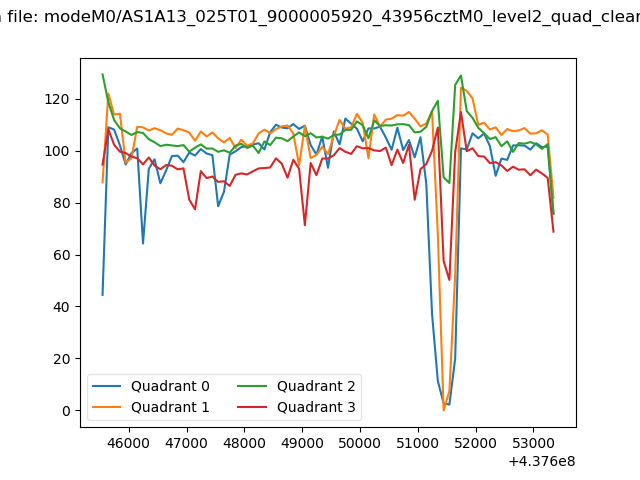 |
|
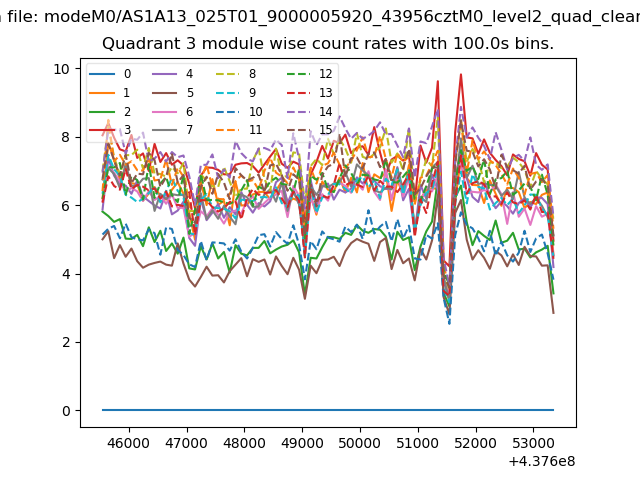
| Module-wise count rates for Quadrant A Data is divided into 100 sec bins |
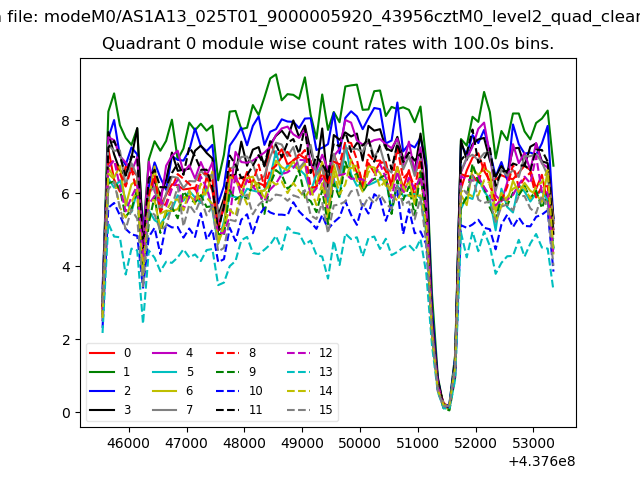 |
 |
| Module-wise count rates for Quadrant B Data is divided into 100 sec bins |
 |
 |
| Module-wise count rates for Quadrant C Data is divided into 100 sec bins |
 |
 |
| Module-wise count rates for Quadrant D Data is divided into 100 sec bins |
 |
 |
| Parameter | Plot |
|---|---|
| CZT HV Monitor | 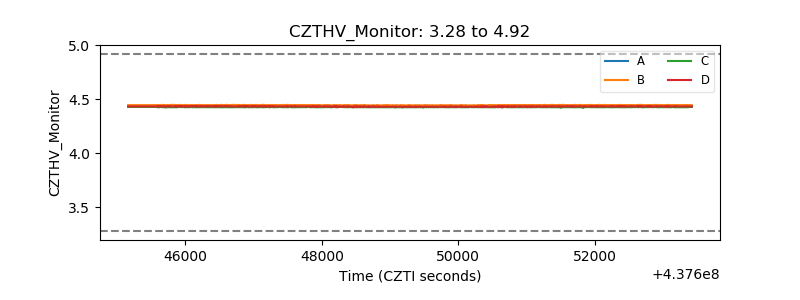 |
| D_VDD | 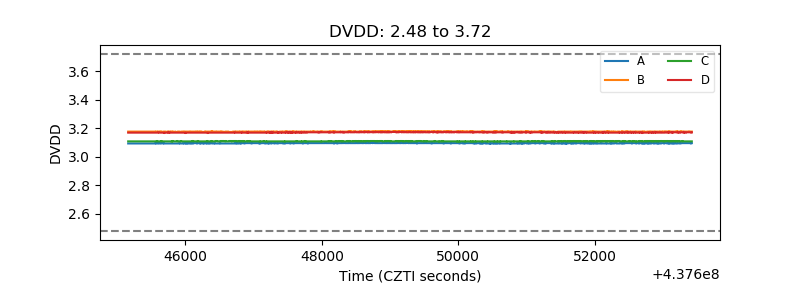 |
| Temperature 1 | 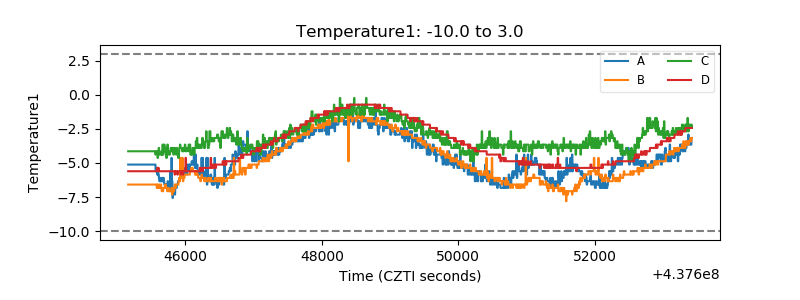 |
| Veto HV Monitor | 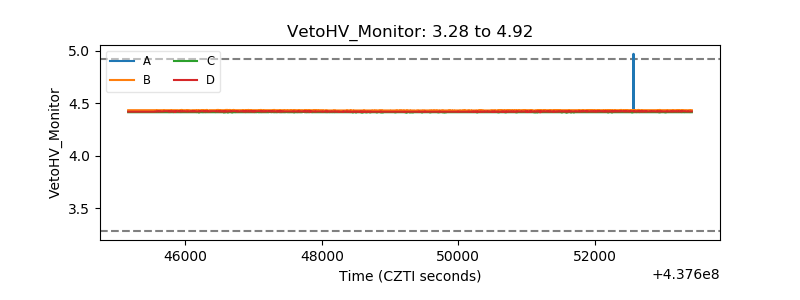 |
| Veto LLD | 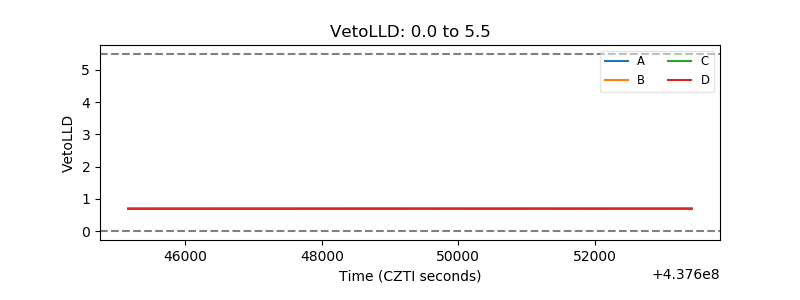 |
| Alpha Counter | 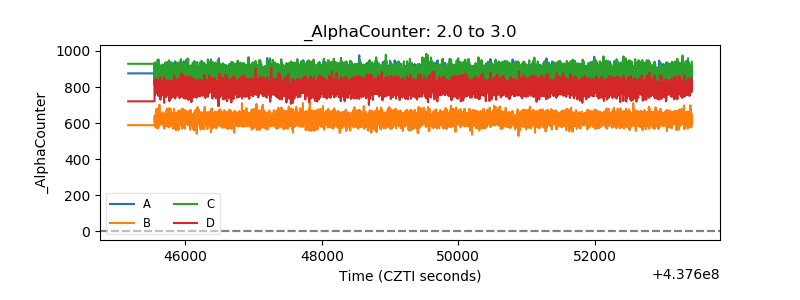 |
| _CPM_Rate | 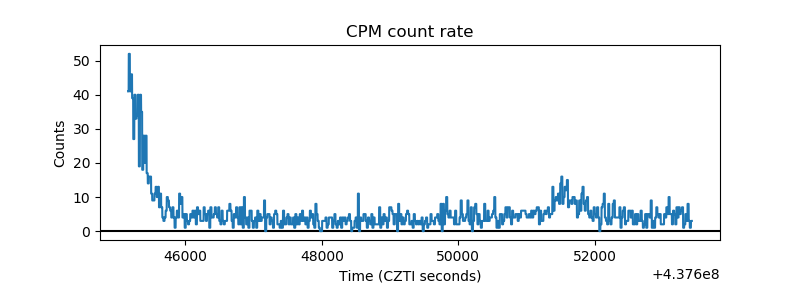 |
| CZT Counter | 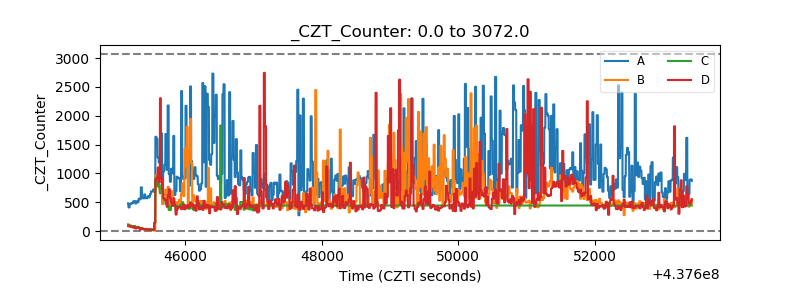 |
| +2.5 Volts monitor | 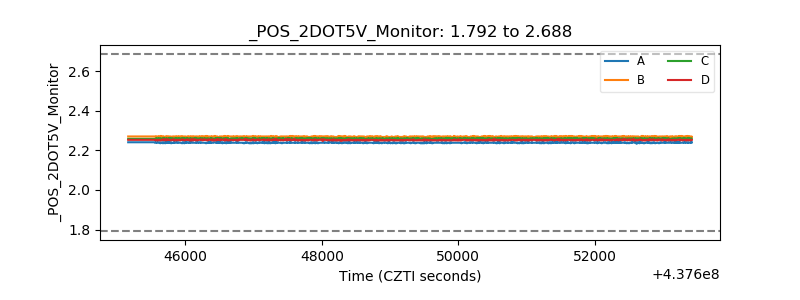 |
| +5 Volts monitor | 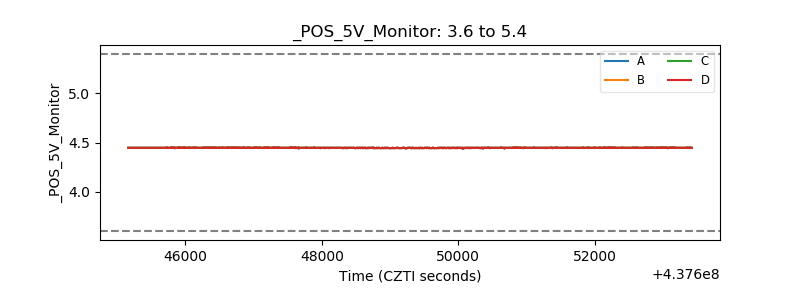 |
| _ROLL_ROT | 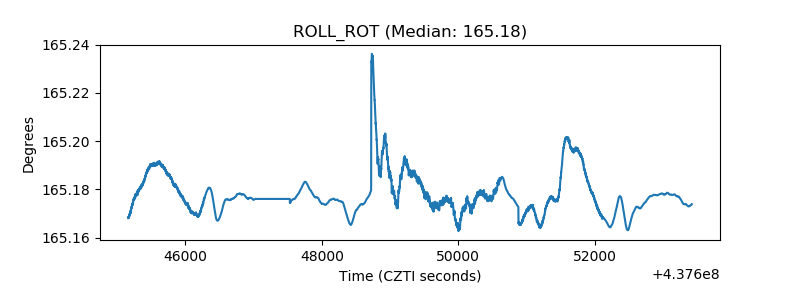 |
| _Roll_DEC | 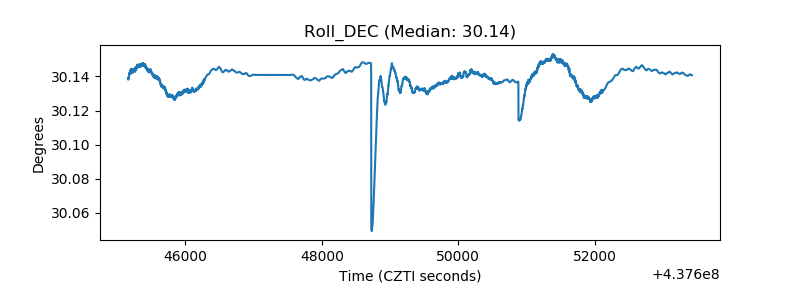 |
| _Roll_RA | 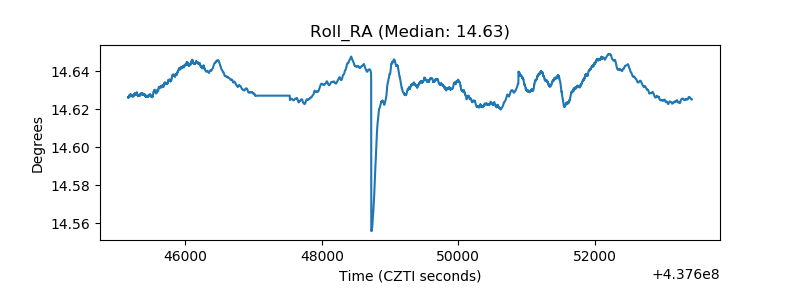 |
| Veto Counter | 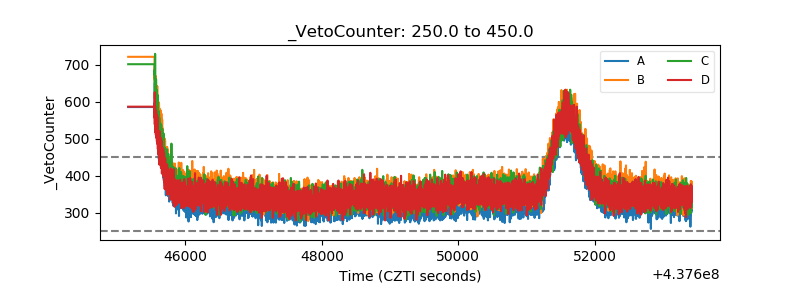 |