| Param | Original file | Final file |
|---|---|---|
| Filename | modeM0/AS1A13_025T01_9000005920_43957cztM0_level2.fits | modeM0/AS1A13_025T01_9000005920_43957cztM0_level2_quad_clean.evt |
| Size (bytes) | 1,029,669,120 | 205,816,320 |
| Size | 982.0 MB | 196.3 MB |
| Events in quadrant A | 12,953,551 | 1,303,372 |
| Events in quadrant B | 7,953,846 | 1,408,871 |
| Events in quadrant C | 6,984,915 | 1,388,954 |
| Events in quadrant D | 9,195,953 | 1,212,772 |
| Mode SS | |||
|---|---|---|---|
| Quadrant | BADHDUFLAG | Total packets | Discarded packets |
| A | 0 | 266 | 0 |
| B | 0 | 266 | 0 |
| C | 0 | 266 | 0 |
| D | 0 | 266 | 0 |
| Mode M0 | |||
|---|---|---|---|
| Quadrant | BADHDUFLAG | Total packets | Discarded packets |
| A | 0 | 47985 | 0 |
| B | 0 | 32622 | 0 |
| C | 0 | 30363 | 0 |
| D | 0 | 36466 | 0 |
| Quadrant | Total seconds | Saturated seconds | Saturation percentage |
|---|---|---|---|
| A | 13273 | 1349 | 10.163490% |
| B | 13273 | 583 | 4.392375% |
| C | 13274 | 328 | 2.470996% |
| D | 13274 | 821 | 6.185023% |
Noise dominated data is calculated using 1-second bins in cleaned event files. If a bin has >2000 counts, and if more than 50% of those come from <1% of pixels, then it is considered to be noise-dominated and hence unusable.
| Quadrant | # 1 sec bins | Bins with >0 counts | Bins with >2000 counts | High rate bins dominated by noise | Noise dominated (total time) | Noise dominated (detector-on time) | Marked lightcurve |
|---|---|---|---|---|---|---|---|
| A | 13273 | 13273 | 615 | 615 | 4.63% | 4.63% | 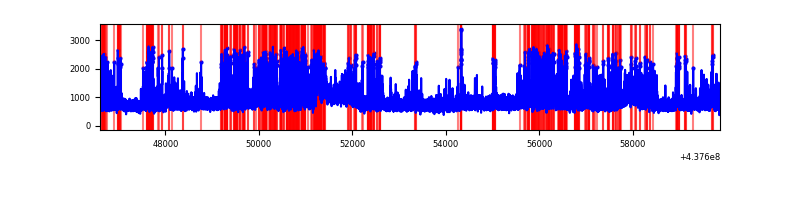 |
| B | 13273 | 13273 | 113 | 113 | 0.85% | 0.85% | 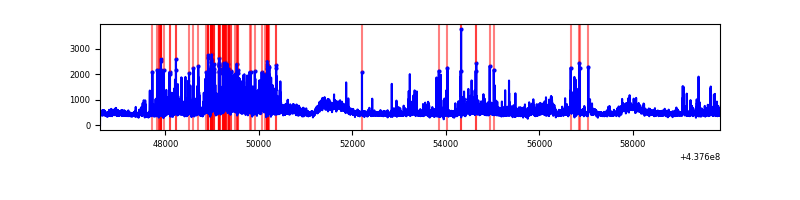 |
| C | 13274 | 13274 | 161 | 161 | 1.21% | 1.21% | 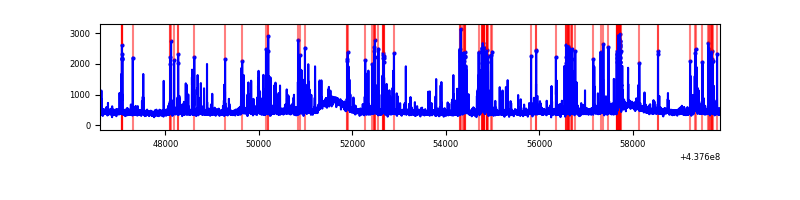 |
| D | 13274 | 13274 | 590 | 590 | 4.44% | 4.44% | 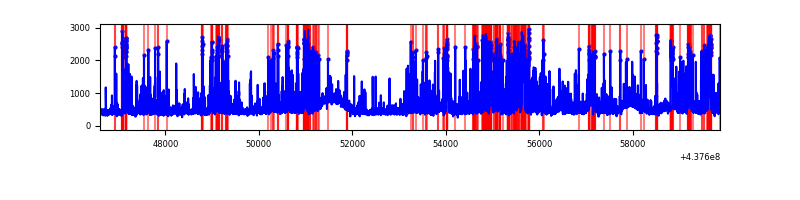 |
Top three noisy pixels from each quadrant. If the there are fewer than three noisy pixels in the level2.evt file, extra rows are filled as -1
| Pixel properties | Quadrant properties | ||||||
|---|---|---|---|---|---|---|---|
| Quadrant | DetID | PixID | Counts | Sigma | Mean | Median | Sigma |
| A | 14 | 238 | 2827980 | 9196.72 | 1467 | 1430 | 307.3 |
| A | 15 | 222 | 2024430 | 6582.22 | 1467 | 1430 | 307.3 |
| A | 10 | 83 | 2003044 | 6512.63 | 1467 | 1430 | 307.3 |
| B | 0 | 200 | 1020805 | 3449.64 | 1495 | 1445 | 295.5 |
| B | 5 | 172 | 320885 | 1081.02 | 1495 | 1445 | 295.5 |
| B | 0 | 213 | 282119 | 949.84 | 1495 | 1445 | 295.5 |
| C | 1 | 241 | 328886 | 945.79 | 1478 | 1484 | 346.2 |
| C | 14 | 254 | 320783 | 922.39 | 1478 | 1484 | 346.2 |
| C | 15 | 157 | 295295 | 848.76 | 1478 | 1484 | 346.2 |
| D | 7 | 204 | 752898 | 2047.59 | 1464 | 1417 | 367.0 |
| D | 12 | 17 | 544774 | 1480.51 | 1464 | 1417 | 367.0 |
| D | 5 | 235 | 480815 | 1306.24 | 1464 | 1417 | 367.0 |
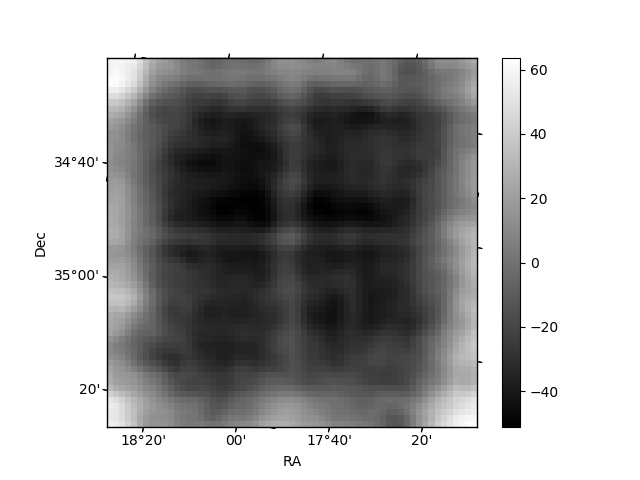
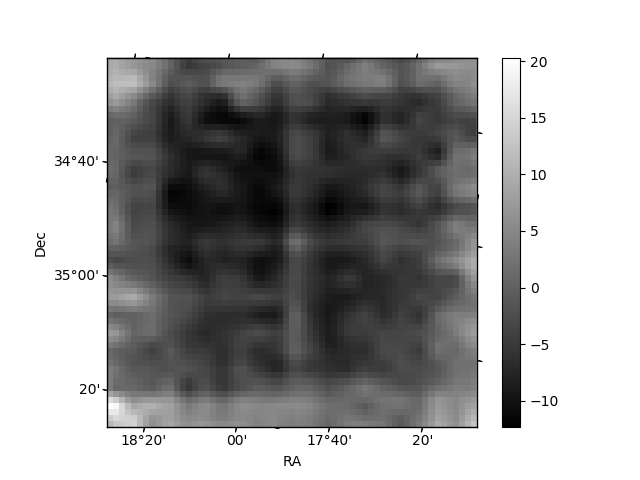
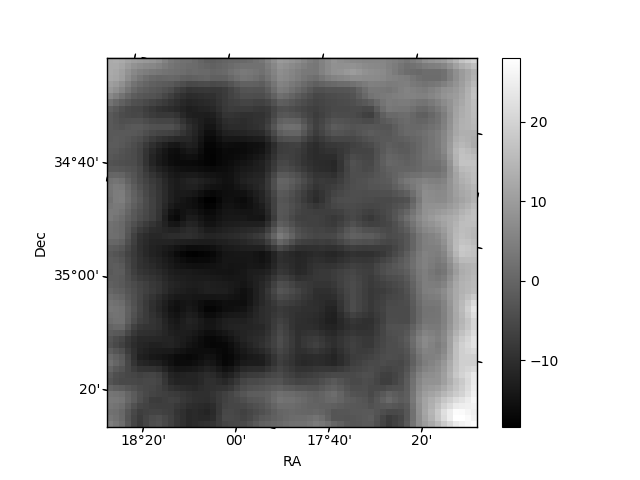
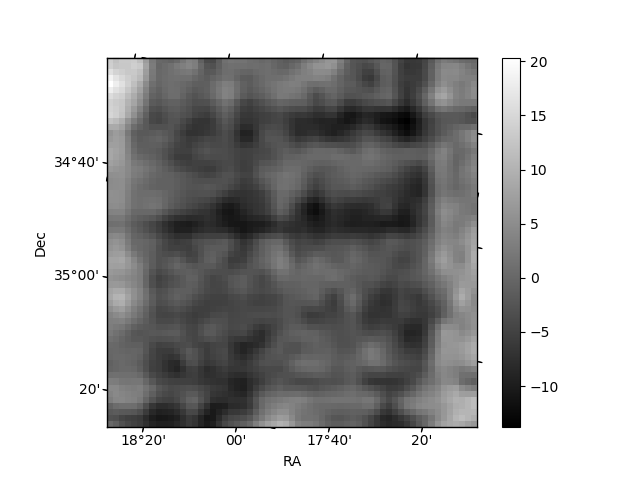
Histogram calculated using DETX and DETY for each event in the final _common_clean file
| Quadrant A | 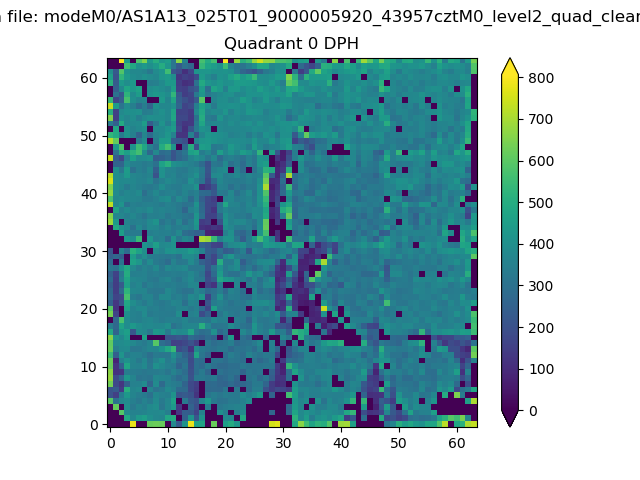 |
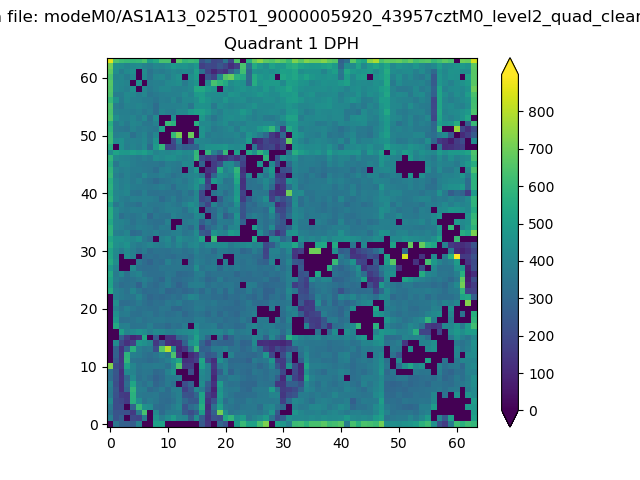 |
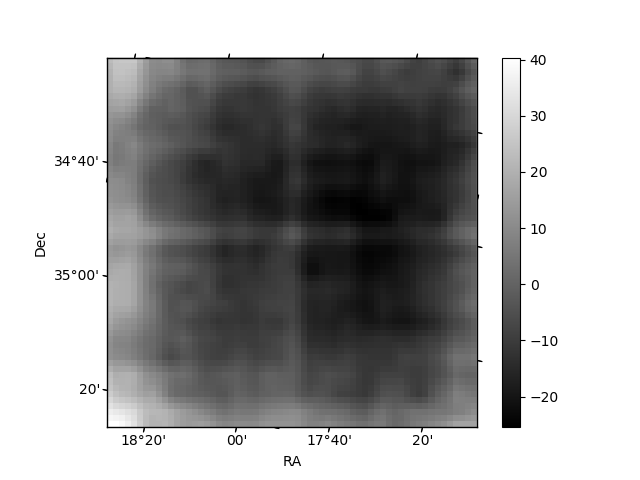
Quadrant B |
|---|---|---|---|
| Quadrant D | 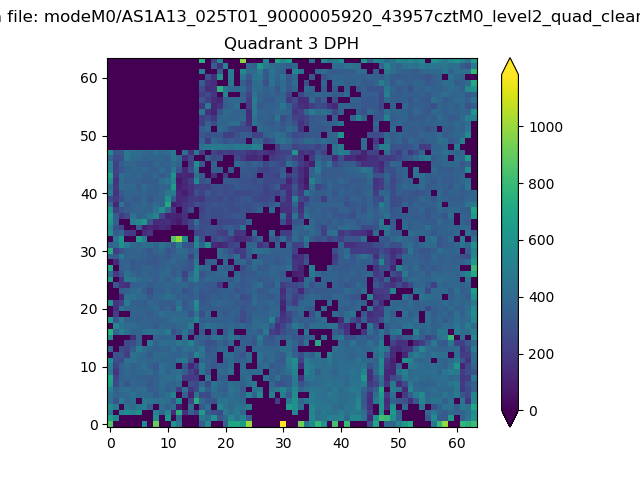 |
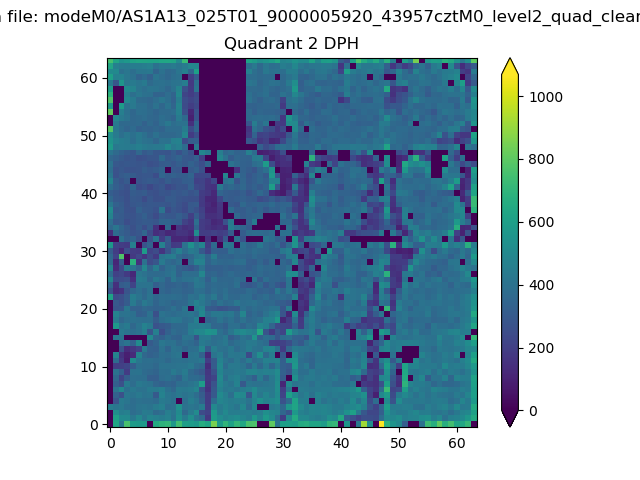 |
Quadrant C |
| Plot type | Count rate plots | Images |
|---|---|---|
| Comparison with Poisson distribution Blue bars denote a histogram of data divided into 1 sec bins. Red curve is a Poisson curve with rate = median count rate of data. |
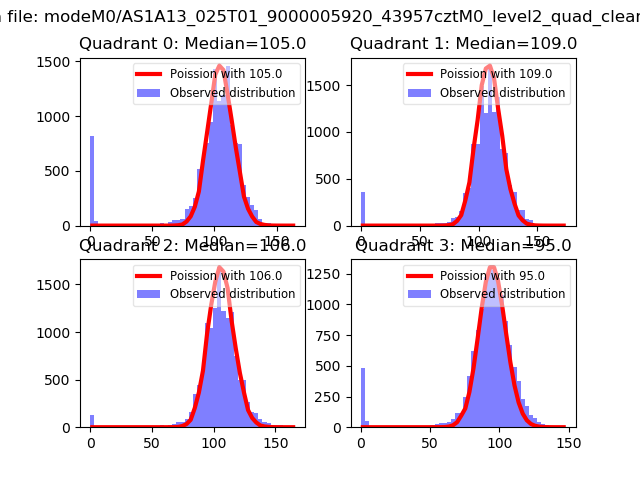 |
 |
| Quadrant-wise count rates Data is divided into 100 sec bins |
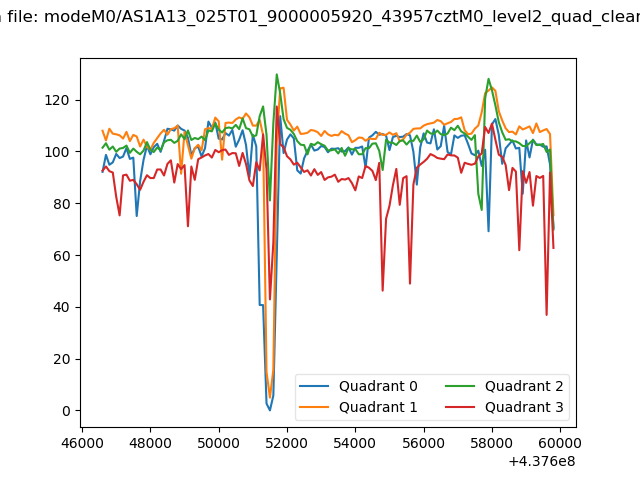 |
|
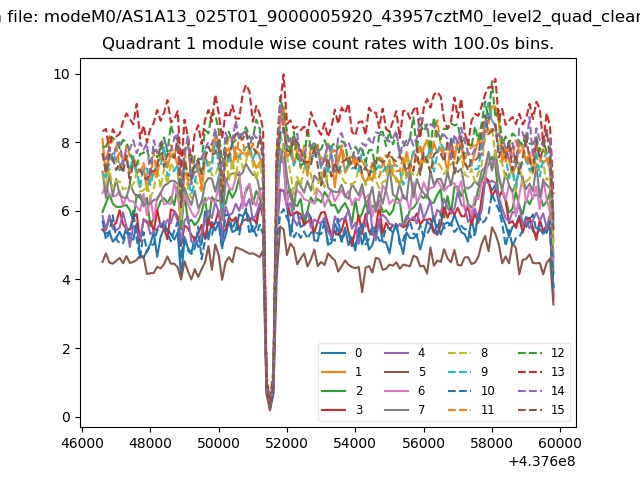
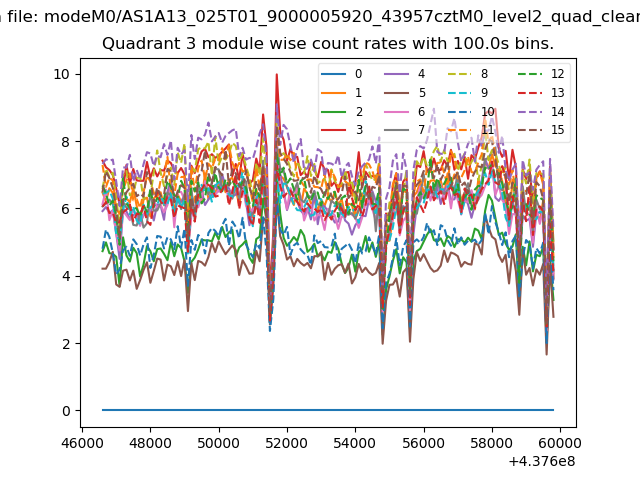
| Module-wise count rates for Quadrant A Data is divided into 100 sec bins |
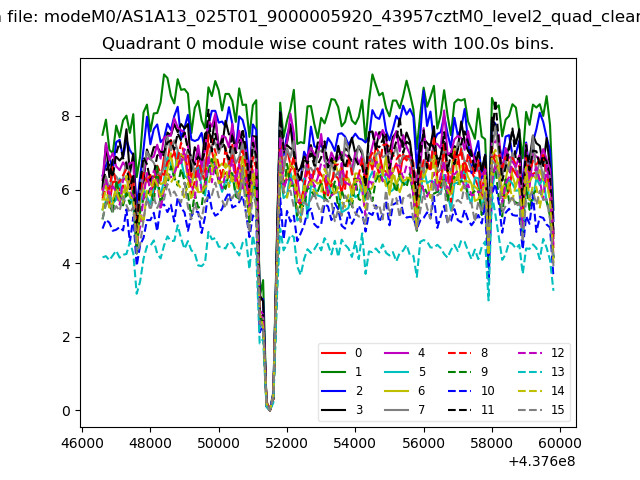 |
 |
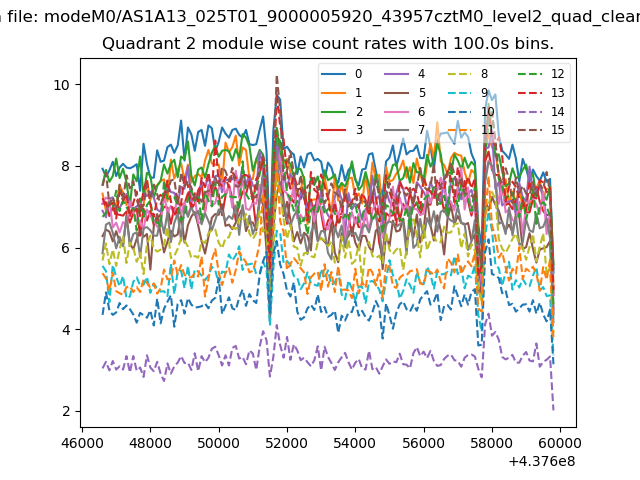
| Module-wise count rates for Quadrant B Data is divided into 100 sec bins |
 |
 |
| Module-wise count rates for Quadrant C Data is divided into 100 sec bins |
 |
 |
| Module-wise count rates for Quadrant D Data is divided into 100 sec bins |
 |
 |
| Parameter | Plot |
|---|---|
| CZT HV Monitor | 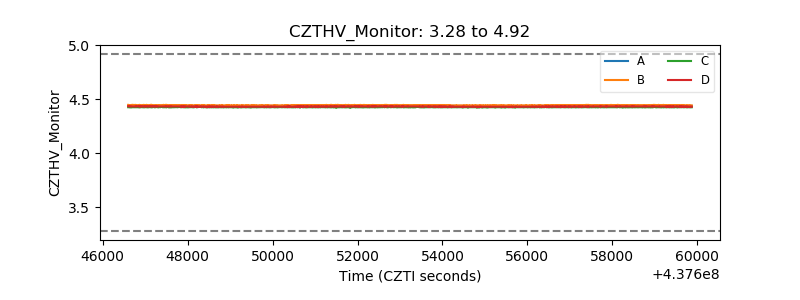 |
| D_VDD | 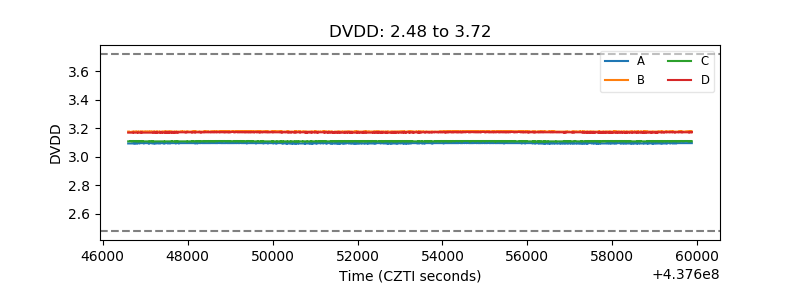 |
| Temperature 1 | 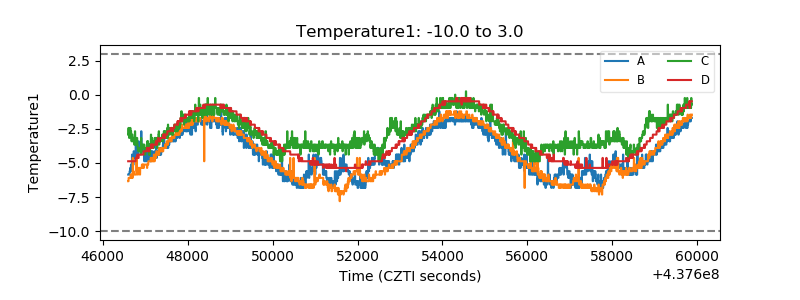 |
| Veto HV Monitor | 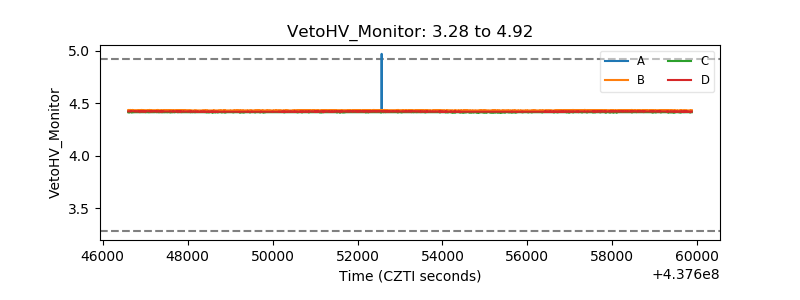 |
| Veto LLD | 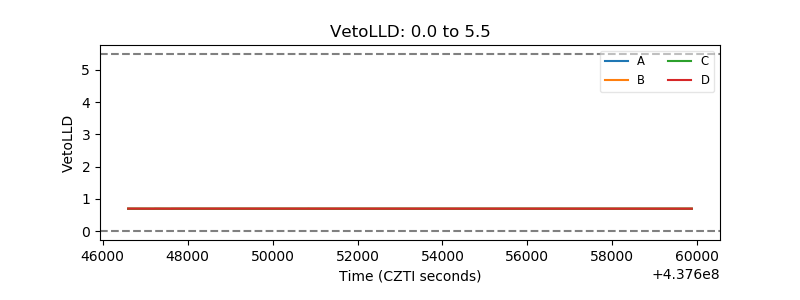 |
| Alpha Counter | 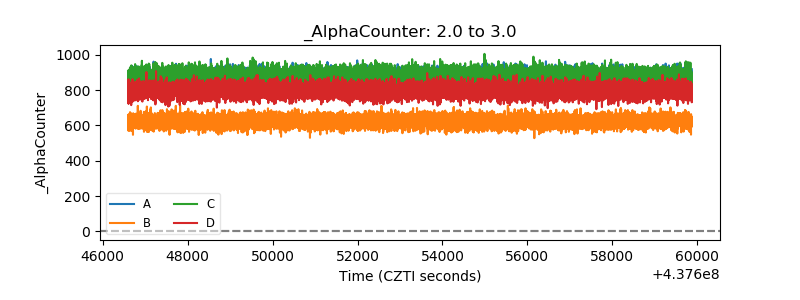 |
| _CPM_Rate | 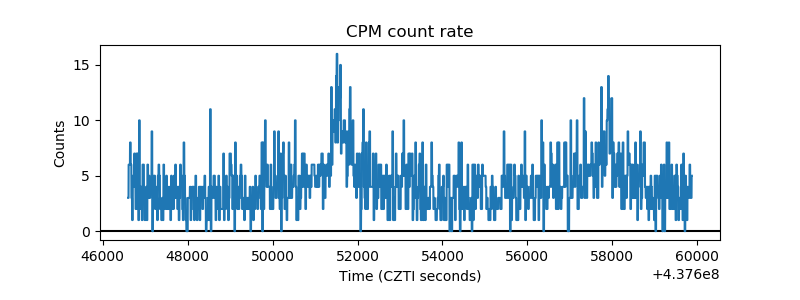 |
| CZT Counter | 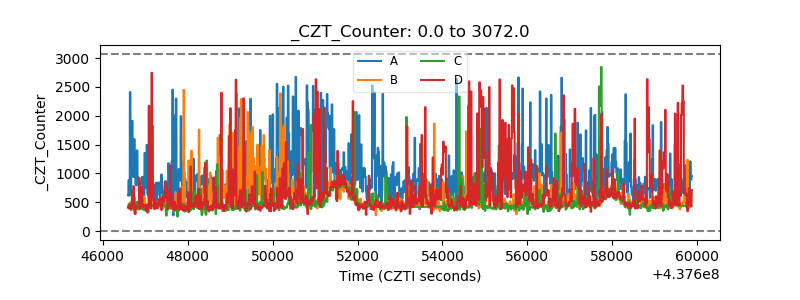 |
| +2.5 Volts monitor | 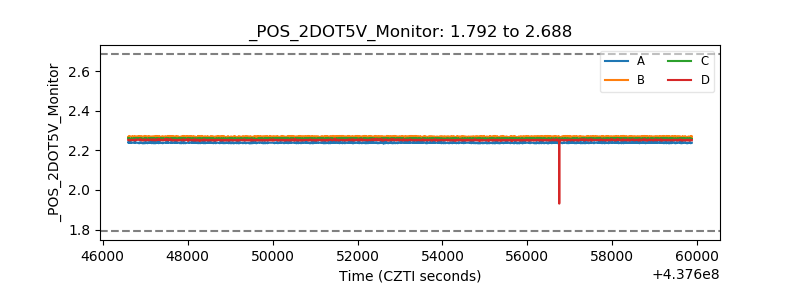 |
| +5 Volts monitor | 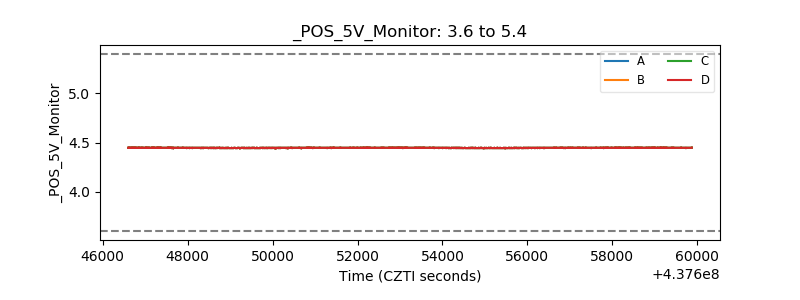 |
| _ROLL_ROT | 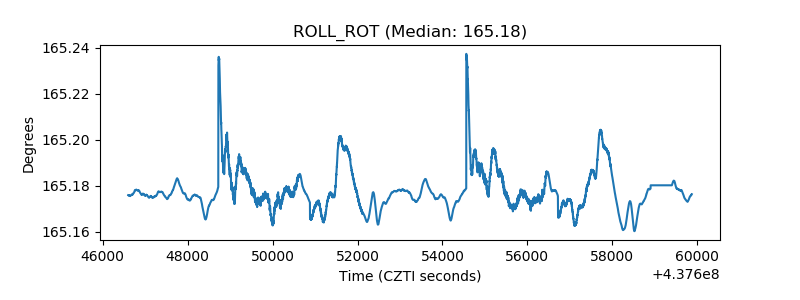 |
| _Roll_DEC | 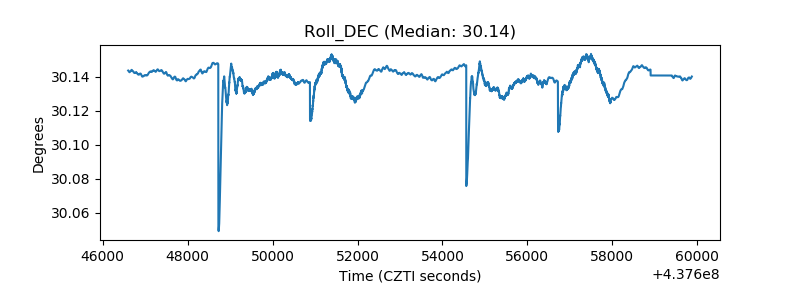 |
| _Roll_RA | 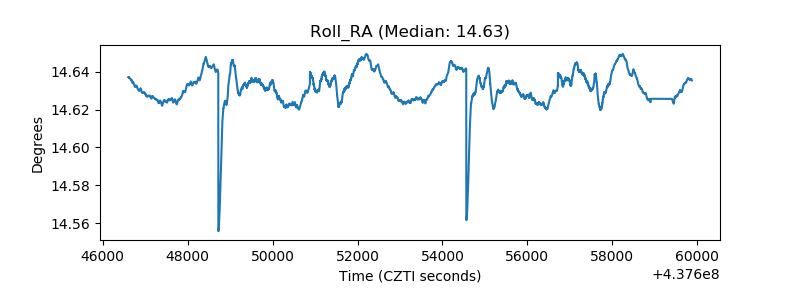 |
| Veto Counter | 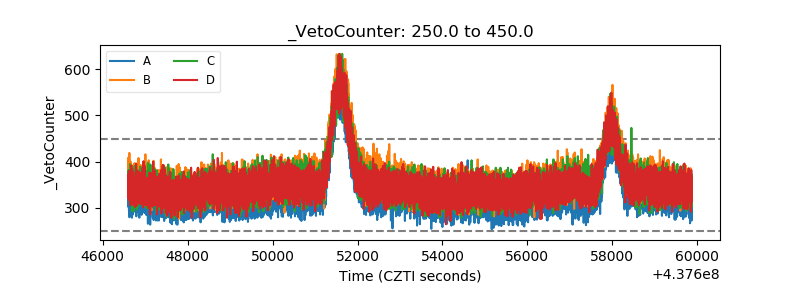 |