| Param | Original file | Final file |
|---|---|---|
| Filename | modeM0/AS1A13_065T06_9000005924_43962cztM0_level2.fits | modeM0/AS1A13_065T06_9000005924_43962cztM0_level2_quad_clean.evt |
| Size (bytes) | 285,347,520 | 59,820,480 |
| Size | 272.1 MB | 57.0 MB |
| Events in quadrant A | 3,470,674 | 390,538 |
| Events in quadrant B | 1,905,110 | 418,094 |
| Events in quadrant C | 1,742,500 | 403,678 |
| Events in quadrant D | 3,156,458 | 338,524 |
| Mode SS | |||
|---|---|---|---|
| Quadrant | BADHDUFLAG | Total packets | Discarded packets |
| A | 0 | 74 | 0 |
| B | 0 | 74 | 0 |
| C | 0 | 74 | 0 |
| D | 0 | 74 | 0 |
| Mode M9 | |||
|---|---|---|---|
| Quadrant | BADHDUFLAG | Total packets | Discarded packets |
| A | 0 | 10 | 0 |
| B | 0 | 10 | 0 |
| C | 0 | 10 | 0 |
| D | 0 | 10 | 0 |
| Mode M0 | |||
|---|---|---|---|
| Quadrant | BADHDUFLAG | Total packets | Discarded packets |
| A | 0 | 13170 | 3 |
| B | 0 | 8129 | 1 |
| C | 0 | 7640 | 1 |
| D | 0 | 11893 | 1 |
| Quadrant | Total seconds | Saturated seconds | Saturation percentage |
|---|---|---|---|
| A | 3688 | 318 | 8.622560% |
| B | 3688 | 71 | 1.925163% |
| C | 3688 | 22 | 0.596529% |
| D | 3688 | 390 | 10.574837% |
Noise dominated data is calculated using 1-second bins in cleaned event files. If a bin has >2000 counts, and if more than 50% of those come from <1% of pixels, then it is considered to be noise-dominated and hence unusable.
| Quadrant | # 1 sec bins | Bins with >0 counts | Bins with >2000 counts | High rate bins dominated by noise | Noise dominated (total time) | Noise dominated (detector-on time) | Marked lightcurve |
|---|---|---|---|---|---|---|---|
| A | 4653 | 3689 | 202 | 202 | 4.34% | 5.48% | 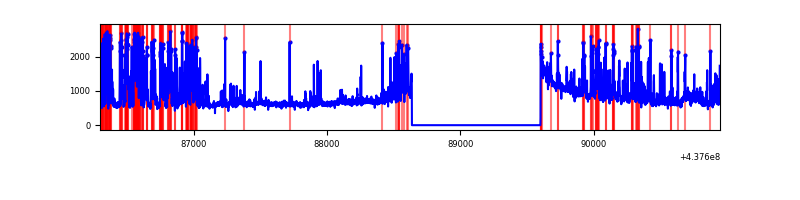 |
| B | 4653 | 3688 | 28 | 28 | 0.60% | 0.76% | 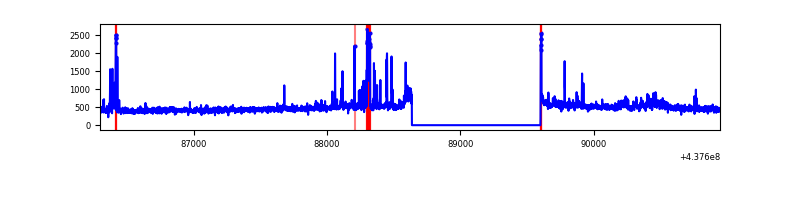 |
| C | 4653 | 3688 | 1 | 1 | 0.02% | 0.03% | 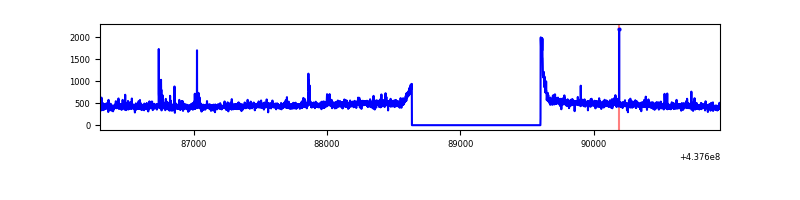 |
| D | 4653 | 3688 | 337 | 337 | 7.24% | 9.14% | 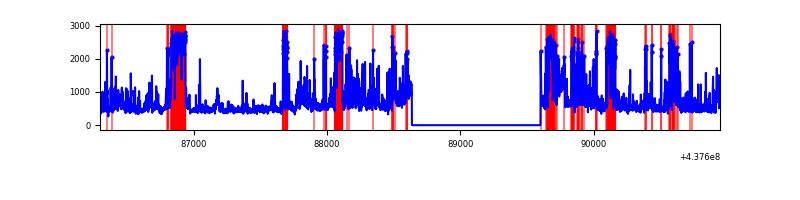 |
Top three noisy pixels from each quadrant. If the there are fewer than three noisy pixels in the level2.evt file, extra rows are filled as -1
| Pixel properties | Quadrant properties | ||||||
|---|---|---|---|---|---|---|---|
| Quadrant | DetID | PixID | Counts | Sigma | Mean | Median | Sigma |
| A | 14 | 238 | 846884 | 9525.32 | 420 | 411 | 88.9 |
| A | 10 | 83 | 671212 | 7548.49 | 420 | 411 | 88.9 |
| A | 15 | 223 | 222005 | 2493.59 | 420 | 411 | 88.9 |
| B | 4 | 170 | 70387 | 813.76 | 424 | 412 | 86.0 |
| B | 0 | 183 | 49239 | 567.82 | 424 | 412 | 86.0 |
| B | 4 | 158 | 38668 | 444.89 | 424 | 412 | 86.0 |
| C | 3 | 233 | 70846 | 704.09 | 419 | 422 | 100.0 |
| C | 14 | 254 | 28634 | 282.06 | 419 | 422 | 100.0 |
| C | 15 | 157 | 6514 | 60.91 | 419 | 422 | 100.0 |
| D | 13 | 171 | 464503 | 4484.96 | 402 | 388 | 103.5 |
| D | 9 | 85 | 328377 | 3169.51 | 402 | 388 | 103.5 |
| D | 1 | 52 | 255157 | 2461.95 | 402 | 388 | 103.5 |
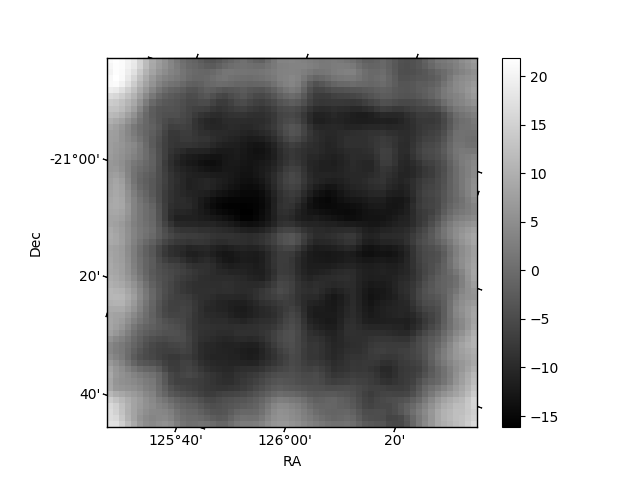
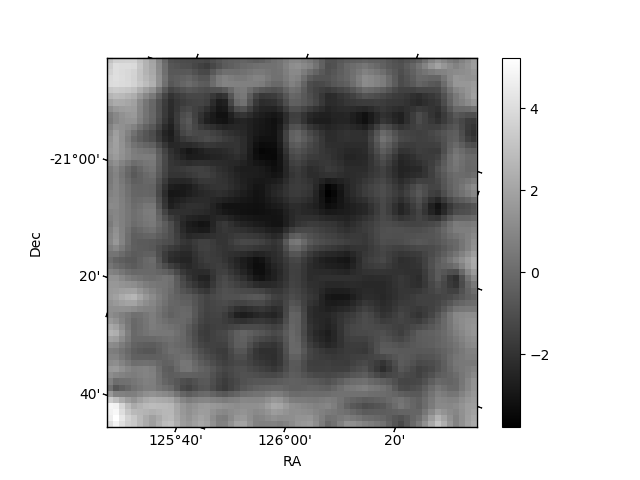
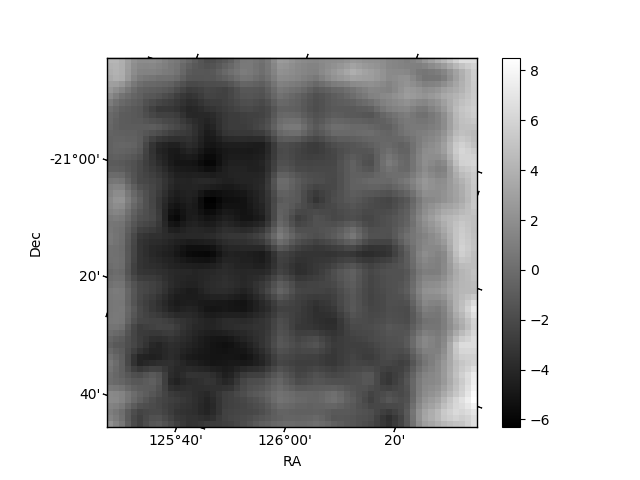
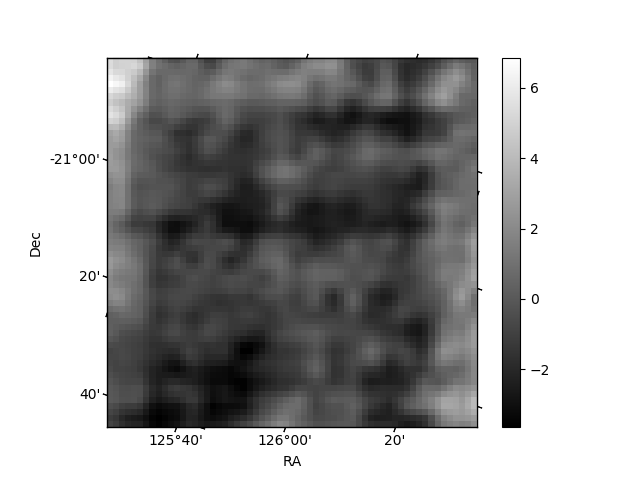
Histogram calculated using DETX and DETY for each event in the final _common_clean file
| Quadrant A | 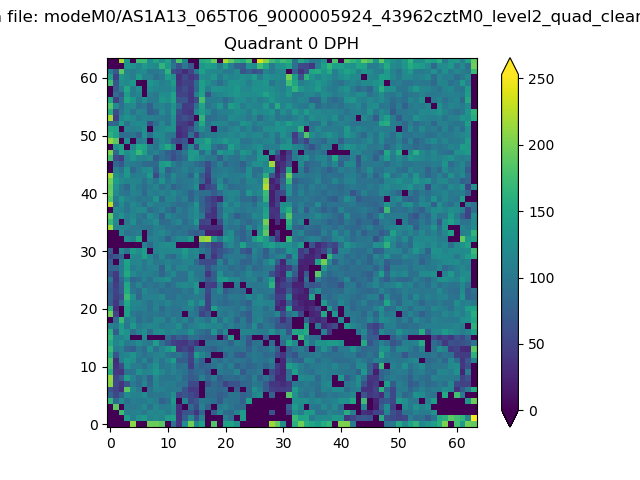 |
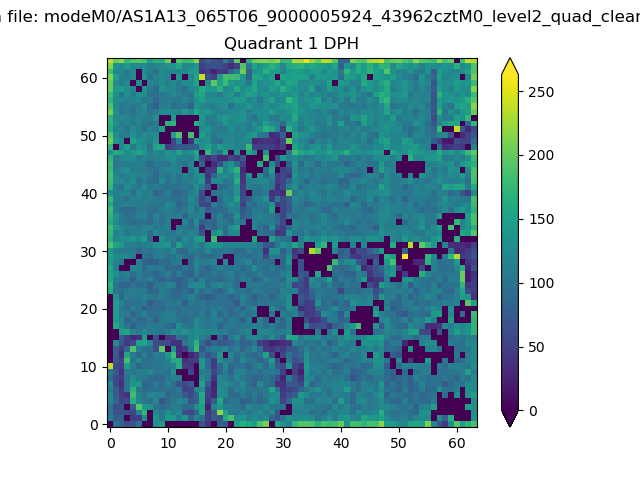 |
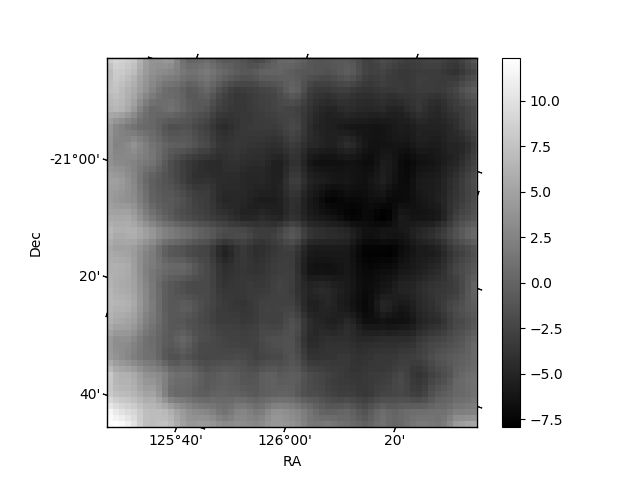
Quadrant B |
|---|---|---|---|
| Quadrant D | 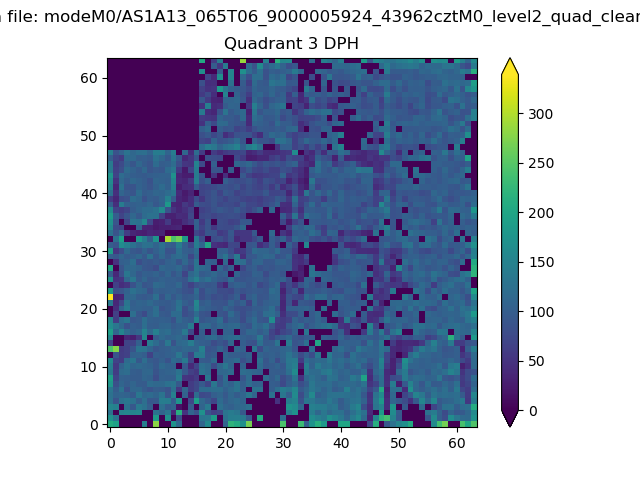 |
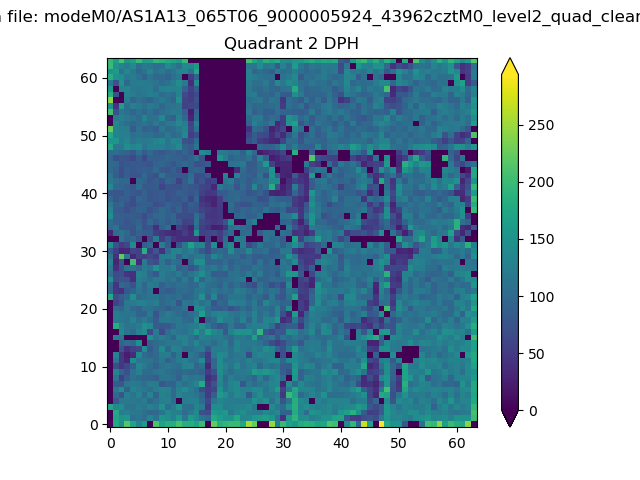 |
Quadrant C |
| Plot type | Count rate plots | Images |
|---|---|---|
| Comparison with Poisson distribution Blue bars denote a histogram of data divided into 1 sec bins. Red curve is a Poisson curve with rate = median count rate of data. |
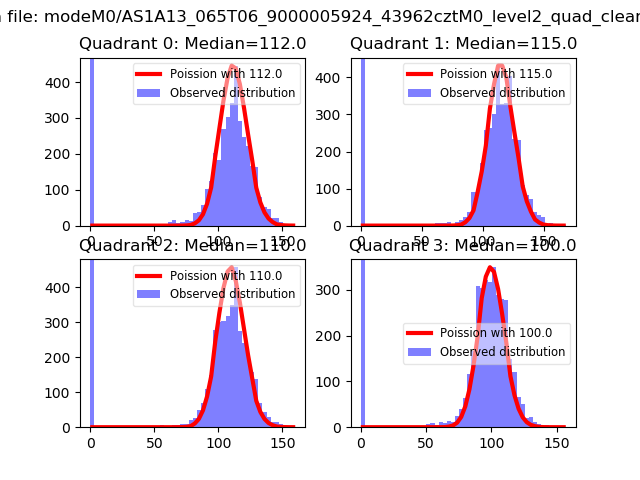 |
 |
| Quadrant-wise count rates Data is divided into 100 sec bins |
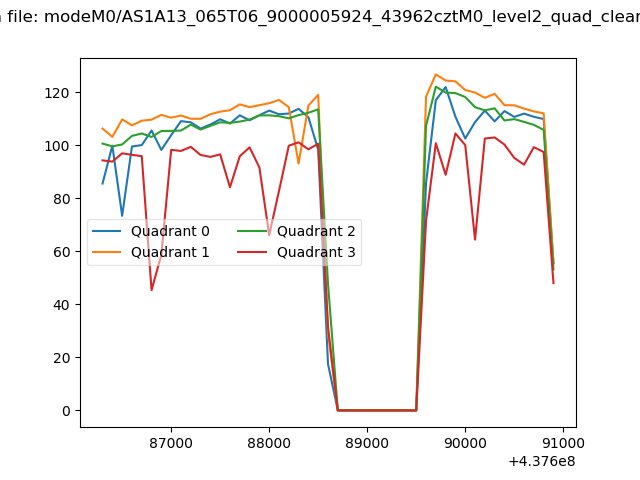 |
|
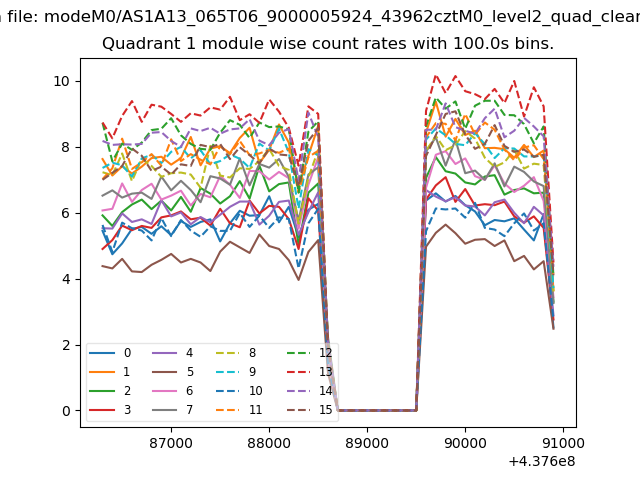
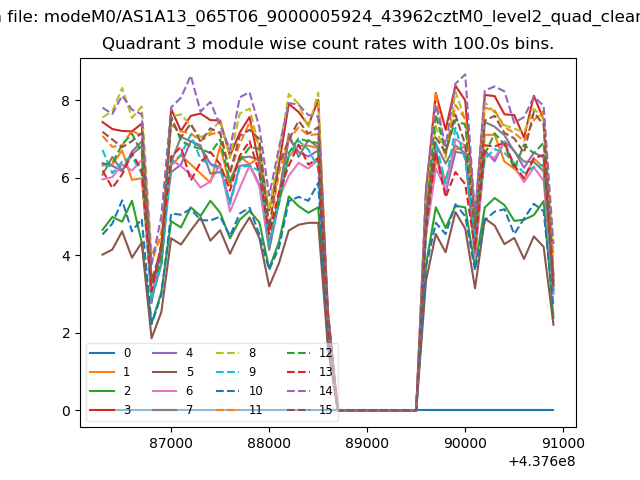
| Module-wise count rates for Quadrant A Data is divided into 100 sec bins |
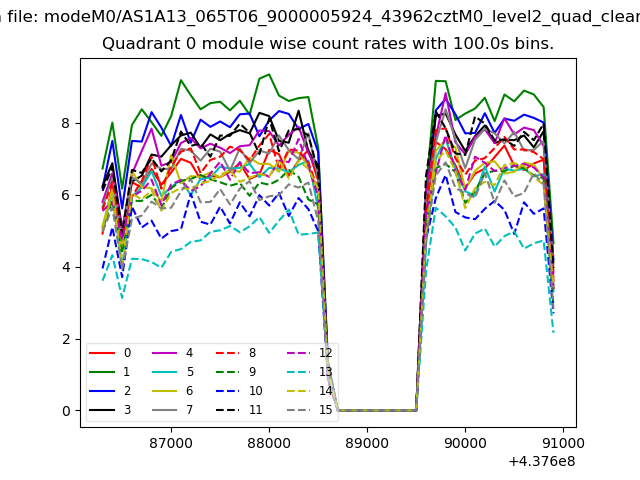 |
 |
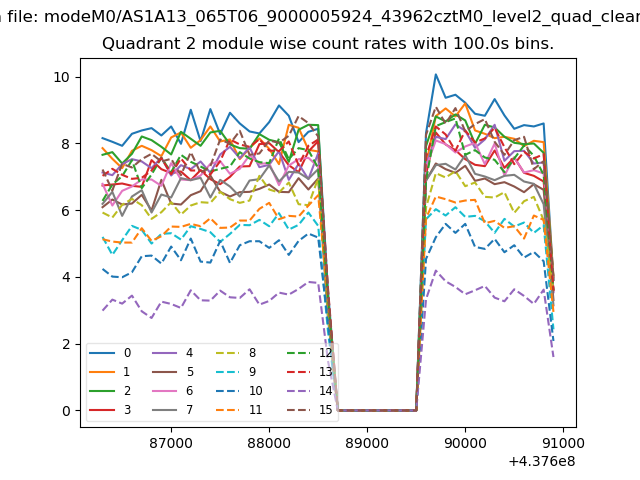
| Module-wise count rates for Quadrant B Data is divided into 100 sec bins |
 |
 |
| Module-wise count rates for Quadrant C Data is divided into 100 sec bins |
 |
 |
| Module-wise count rates for Quadrant D Data is divided into 100 sec bins |
 |
 |
| Parameter | Plot |
|---|---|
| CZT HV Monitor | 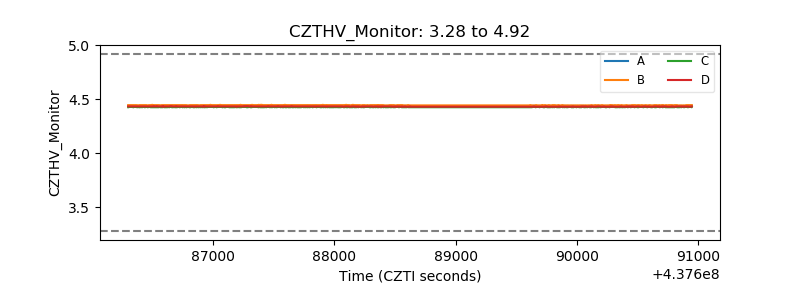 |
| D_VDD | 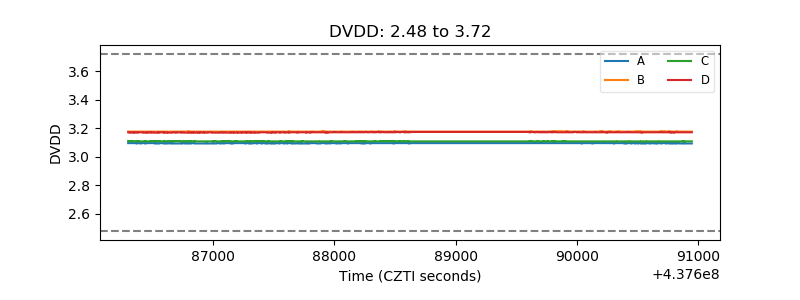 |
| Temperature 1 | 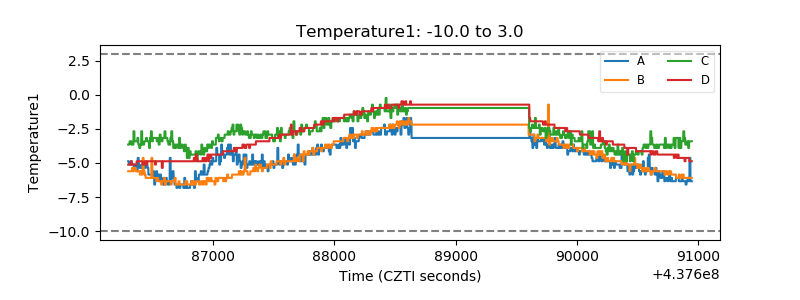 |
| Veto HV Monitor | 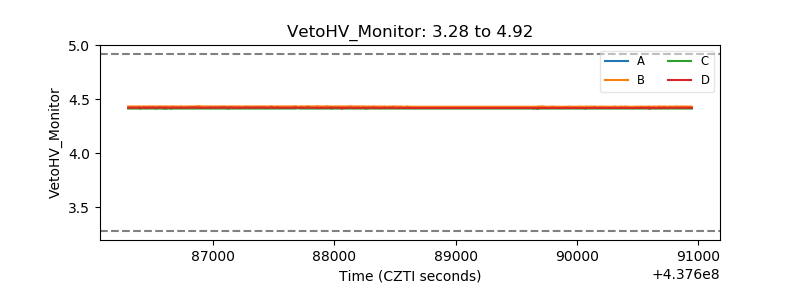 |
| Veto LLD | 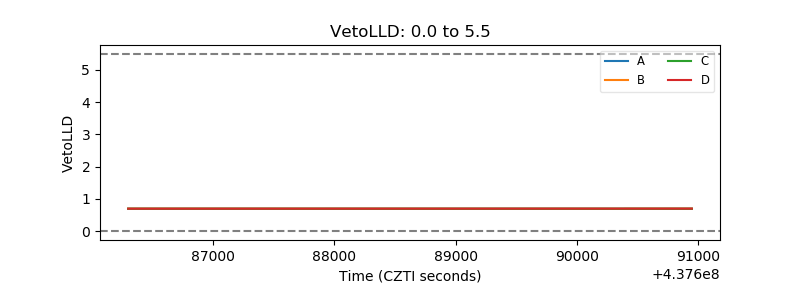 |
| Alpha Counter | 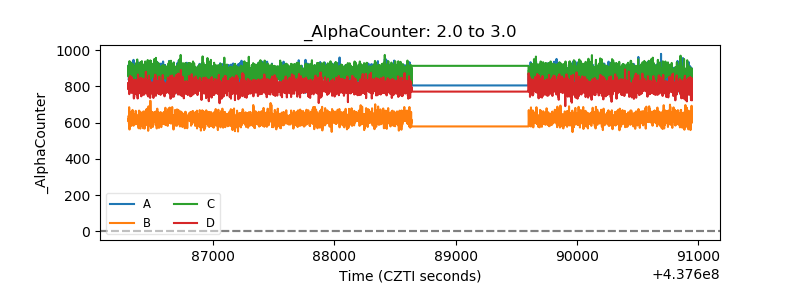 |
| _CPM_Rate | 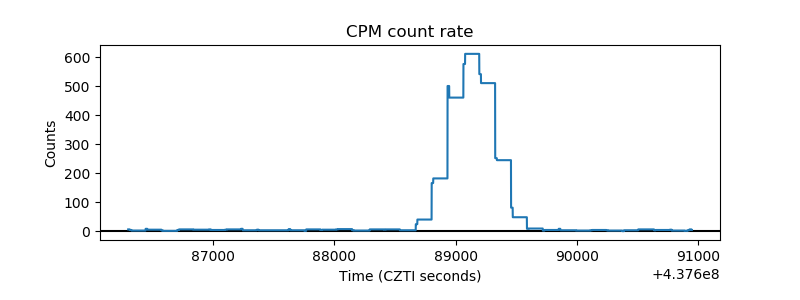 |
| CZT Counter | 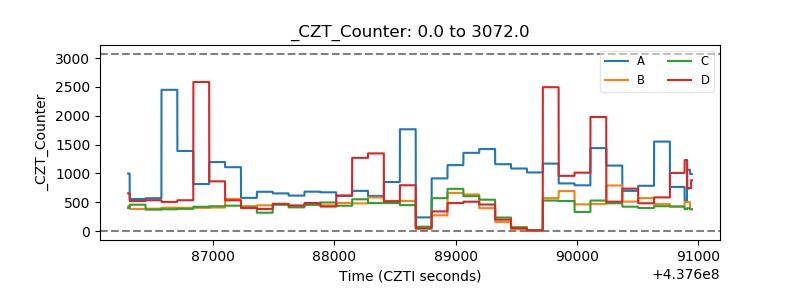 |
| +2.5 Volts monitor | 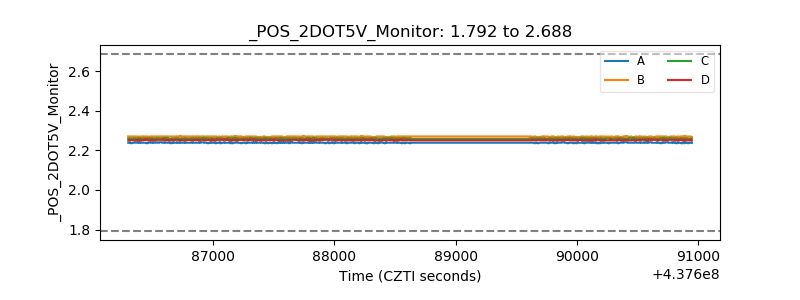 |
| +5 Volts monitor | 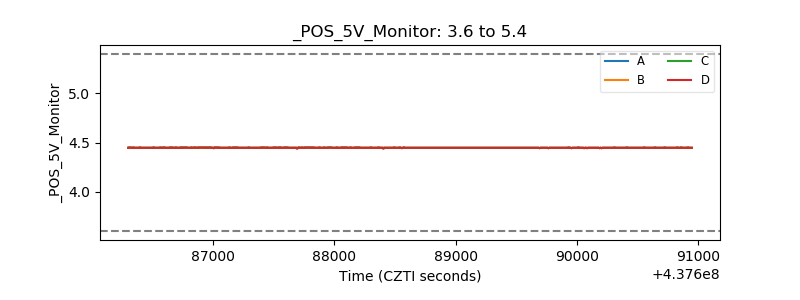 |
| _ROLL_ROT | 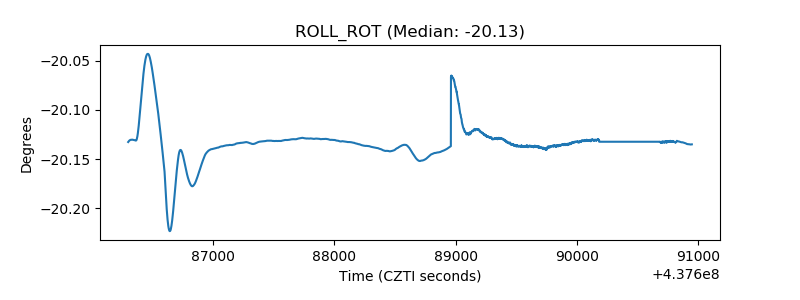 |
| _Roll_DEC | 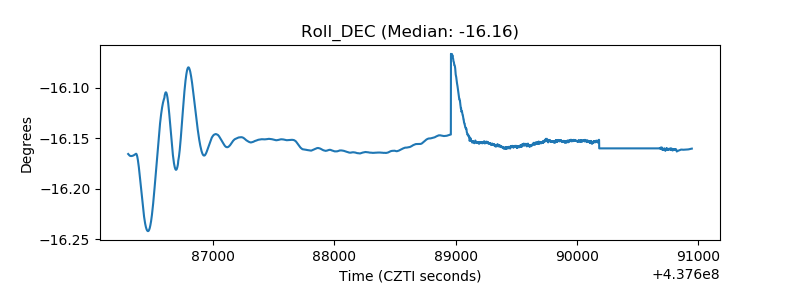 |
| _Roll_RA | 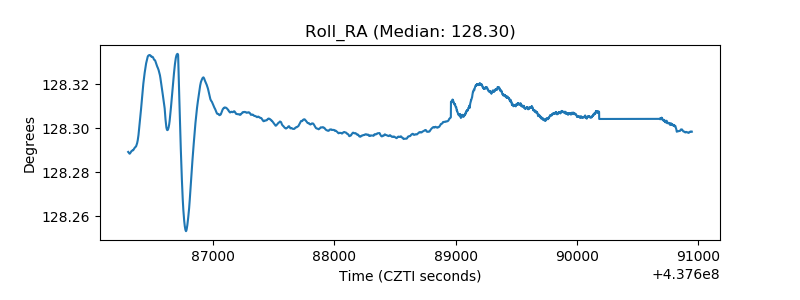 |
| Veto Counter | 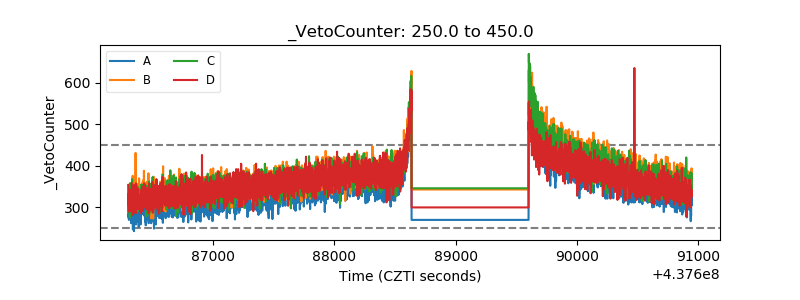 |