| Param | Original file | Final file |
|---|---|---|
| Filename | modeM0/AS1A13_065T06_9000005924_43964cztM0_level2.fits | modeM0/AS1A13_065T06_9000005924_43964cztM0_level2_quad_clean.evt |
| Size (bytes) | 495,688,320 | 107,665,920 |
| Size | 472.7 MB | 102.7 MB |
| Events in quadrant A | 7,212,675 | 679,591 |
| Events in quadrant B | 3,145,167 | 756,260 |
| Events in quadrant C | 3,116,298 | 720,198 |
| Events in quadrant D | 4,364,974 | 645,869 |
| Mode SS | |||
|---|---|---|---|
| Quadrant | BADHDUFLAG | Total packets | Discarded packets |
| A | 0 | 134 | 0 |
| B | 0 | 134 | 0 |
| C | 0 | 134 | 0 |
| D | 0 | 134 | 0 |
| Mode M9 | |||
|---|---|---|---|
| Quadrant | BADHDUFLAG | Total packets | Discarded packets |
| A | 0 | 10 | 0 |
| B | 0 | 10 | 0 |
| C | 0 | 10 | 0 |
| D | 0 | 10 | 0 |
| Mode M0 | |||
|---|---|---|---|
| Quadrant | BADHDUFLAG | Total packets | Discarded packets |
| A | 0 | 26149 | 4 |
| B | 0 | 13913 | 1 |
| C | 0 | 13918 | 1 |
| D | 0 | 17438 | 1 |
| Quadrant | Total seconds | Saturated seconds | Saturation percentage |
|---|---|---|---|
| A | 6566 | 813 | 12.381968% |
| B | 6567 | 62 | 0.944115% |
| C | 6567 | 30 | 0.456830% |
| D | 6567 | 229 | 3.487133% |
Noise dominated data is calculated using 1-second bins in cleaned event files. If a bin has >2000 counts, and if more than 50% of those come from <1% of pixels, then it is considered to be noise-dominated and hence unusable.
| Quadrant | # 1 sec bins | Bins with >0 counts | Bins with >2000 counts | High rate bins dominated by noise | Noise dominated (total time) | Noise dominated (detector-on time) | Marked lightcurve |
|---|---|---|---|---|---|---|---|
| A | 7621 | 6566 | 614 | 614 | 8.06% | 9.35% | 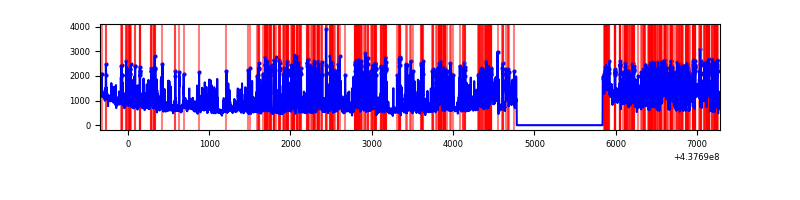 |
| B | 7622 | 6566 | 17 | 17 | 0.22% | 0.26% | 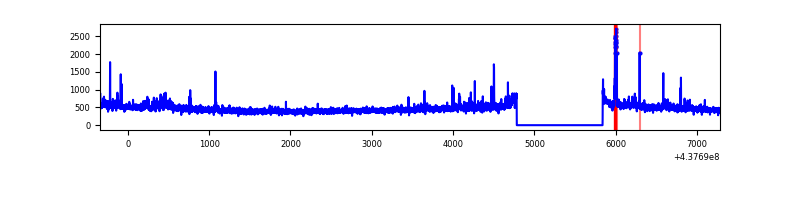 |
| C | 7622 | 6566 | 21 | 21 | 0.28% | 0.32% | 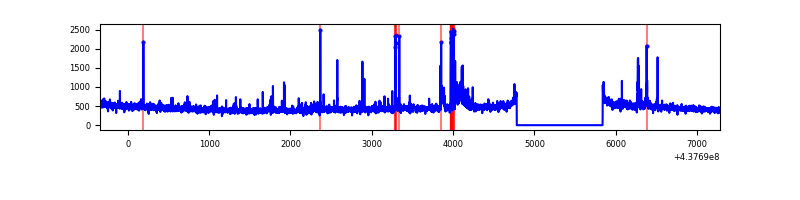 |
| D | 7622 | 6566 | 199 | 199 | 2.61% | 3.03% | 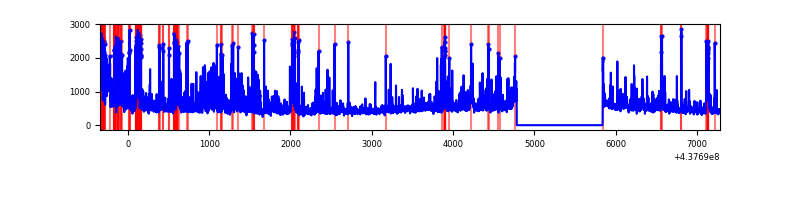 |
Top three noisy pixels from each quadrant. If the there are fewer than three noisy pixels in the level2.evt file, extra rows are filled as -1
| Pixel properties | Quadrant properties | ||||||
|---|---|---|---|---|---|---|---|
| Quadrant | DetID | PixID | Counts | Sigma | Mean | Median | Sigma |
| A | 14 | 238 | 1711950 | 11432.54 | 719 | 707 | 149.7 |
| A | 15 | 223 | 1437018 | 9595.77 | 719 | 707 | 149.7 |
| A | 10 | 83 | 1128655 | 7535.64 | 719 | 707 | 149.7 |
| B | 0 | 183 | 106016 | 709.67 | 749 | 726 | 148.4 |
| B | 12 | 111 | 18347 | 118.77 | 749 | 726 | 148.4 |
| B | 11 | 111 | 16915 | 109.12 | 749 | 726 | 148.4 |
| C | 14 | 254 | 198756 | 1142.11 | 732 | 738 | 173.4 |
| C | 3 | 233 | 34511 | 194.79 | 732 | 738 | 173.4 |
| C | 15 | 157 | 20244 | 112.51 | 732 | 738 | 173.4 |
| D | 1 | 52 | 584213 | 3139.97 | 719 | 697 | 185.8 |
| D | 13 | 171 | 327894 | 1760.68 | 719 | 697 | 185.8 |
| D | 13 | 249 | 171546 | 919.36 | 719 | 697 | 185.8 |
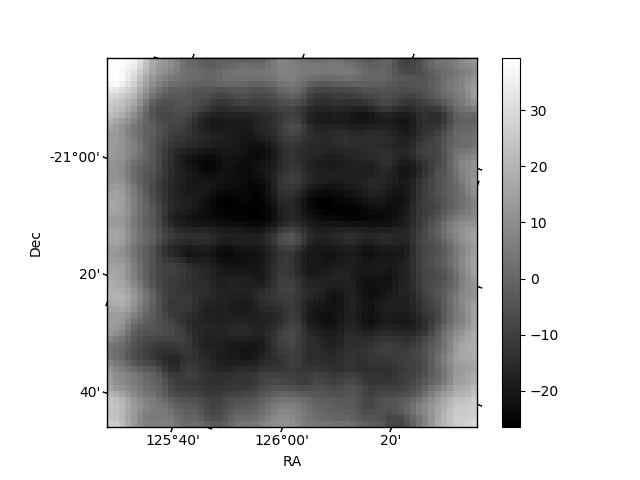
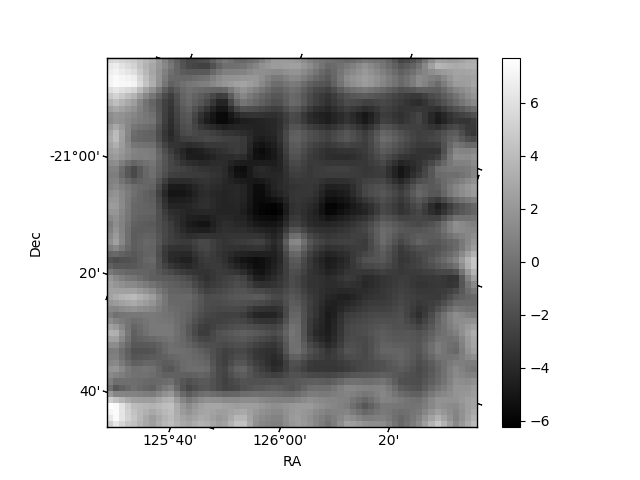
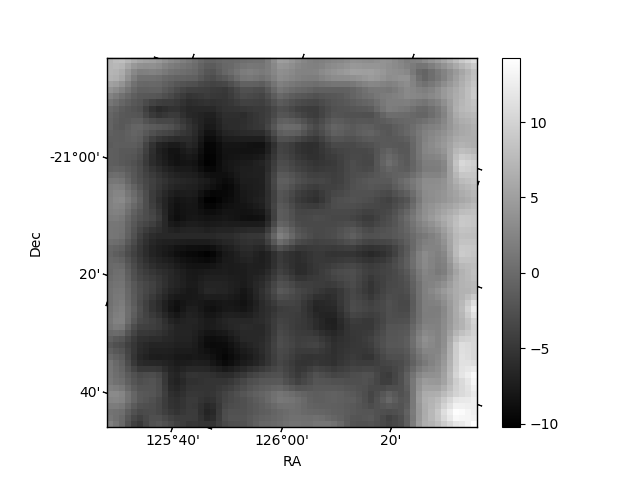
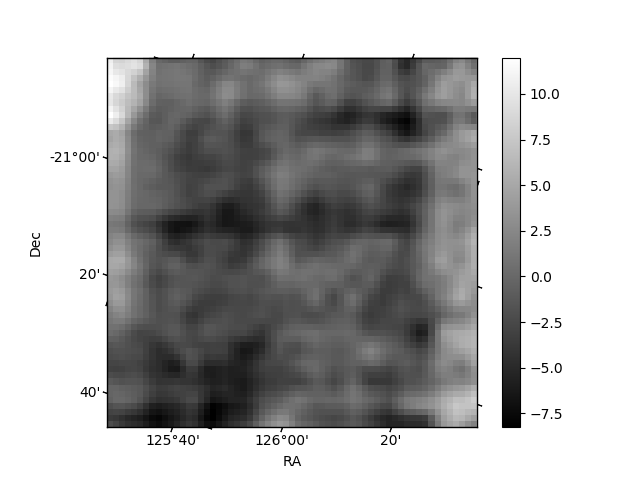
Histogram calculated using DETX and DETY for each event in the final _common_clean file
| Quadrant A | 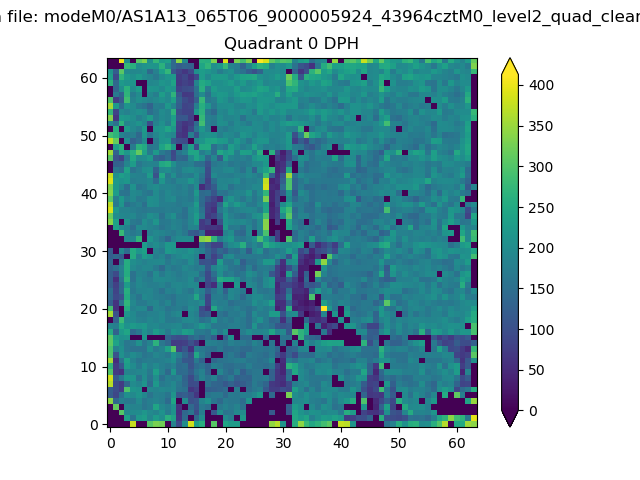 |
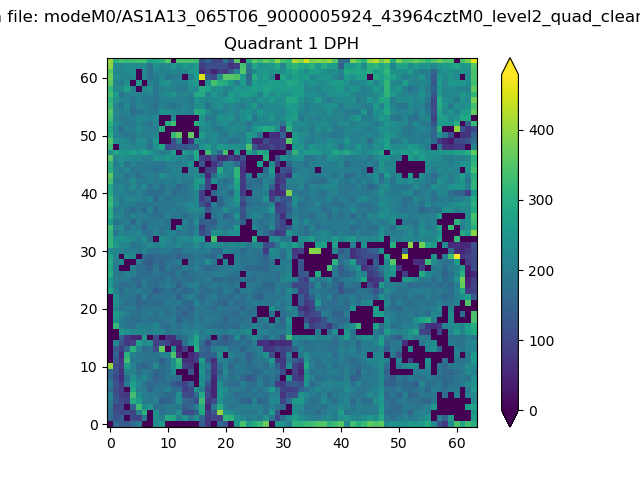 |
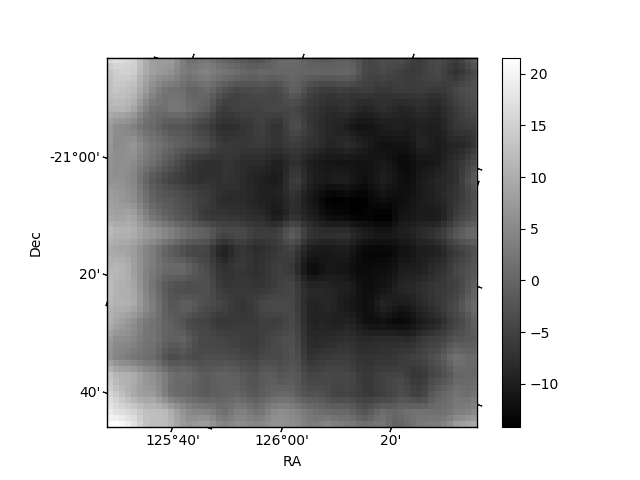
Quadrant B |
|---|---|---|---|
| Quadrant D | 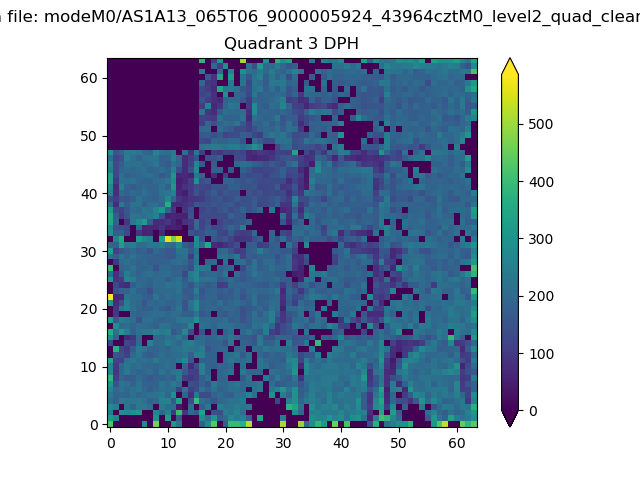 |
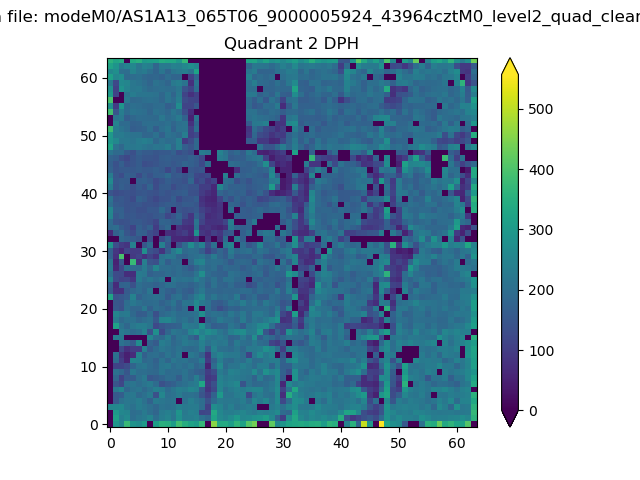 |
Quadrant C |
| Plot type | Count rate plots | Images |
|---|---|---|
| Comparison with Poisson distribution Blue bars denote a histogram of data divided into 1 sec bins. Red curve is a Poisson curve with rate = median count rate of data. |
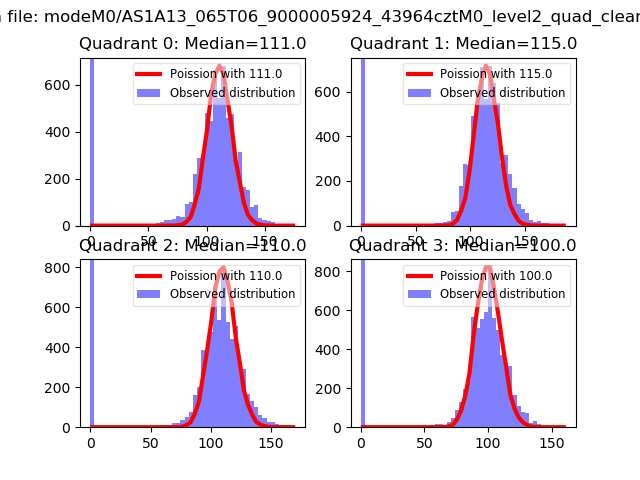 |
 |
| Quadrant-wise count rates Data is divided into 100 sec bins |
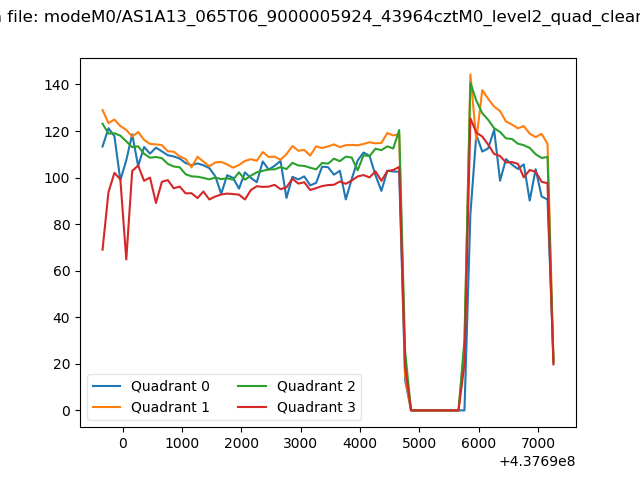 |
|
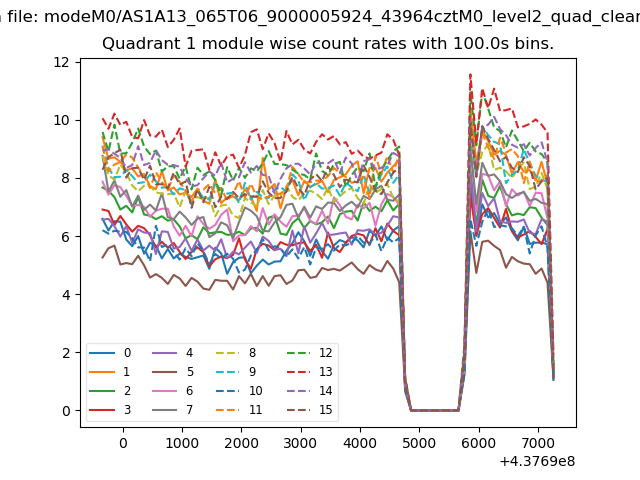
| Module-wise count rates for Quadrant A Data is divided into 100 sec bins |
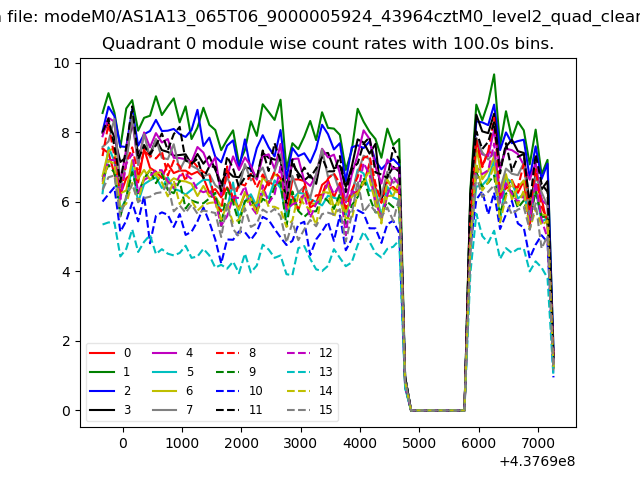 |
 |
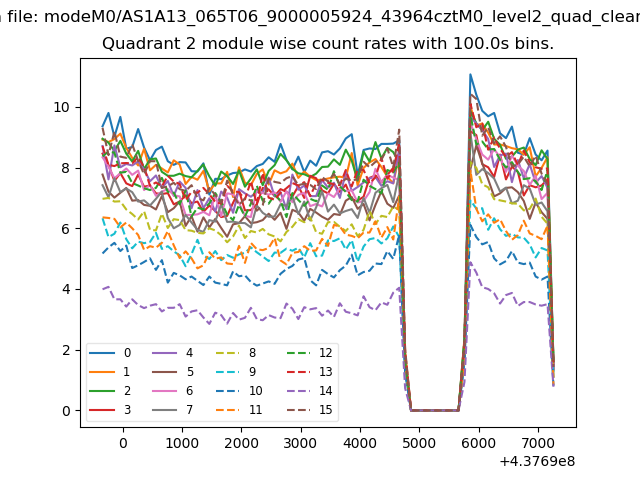
| Module-wise count rates for Quadrant B Data is divided into 100 sec bins |
 |
 |
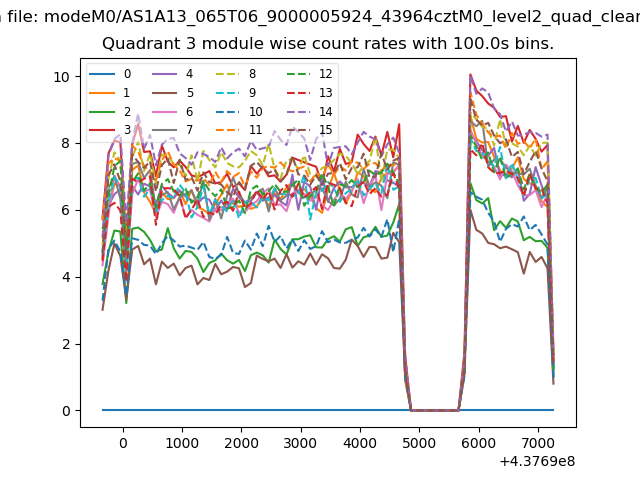
| Module-wise count rates for Quadrant C Data is divided into 100 sec bins |
 |
 |
| Module-wise count rates for Quadrant D Data is divided into 100 sec bins |
 |
 |
| Parameter | Plot |
|---|---|
| CZT HV Monitor | 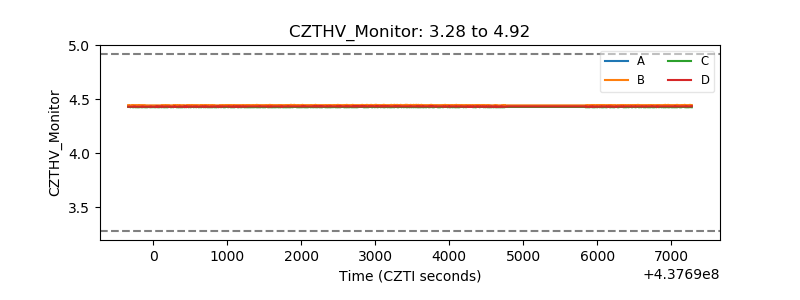 |
| D_VDD | 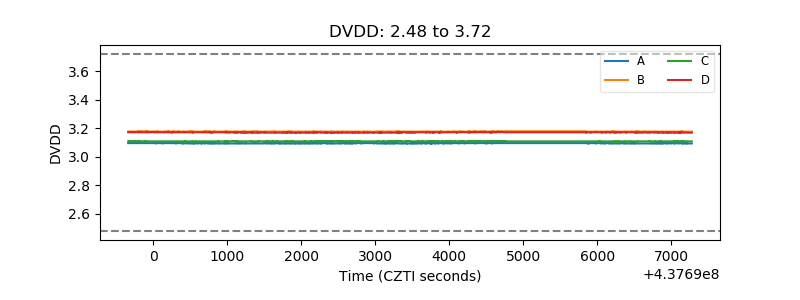 |
| Temperature 1 | 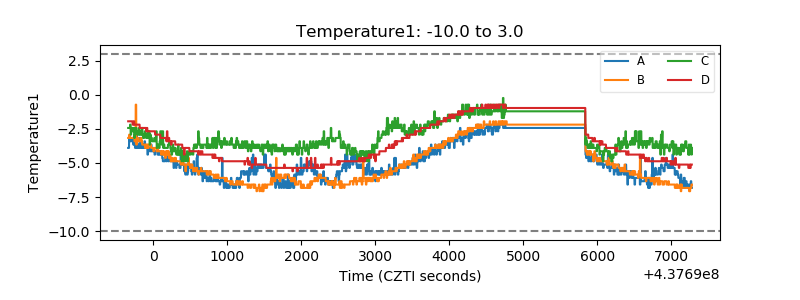 |
| Veto HV Monitor | 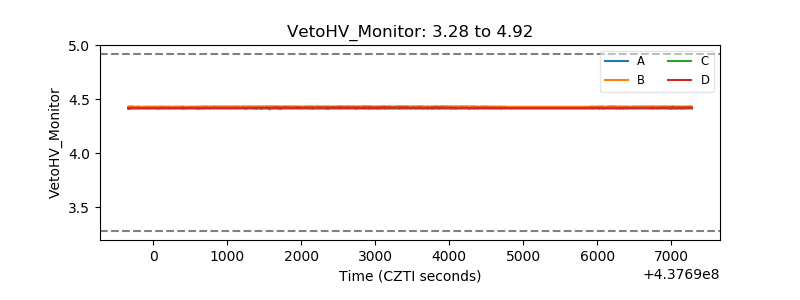 |
| Veto LLD | 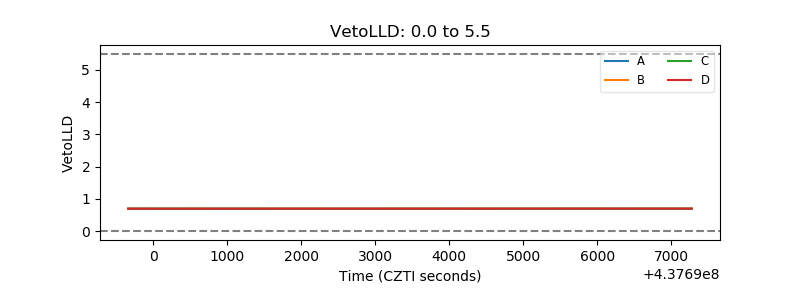 |
| Alpha Counter | 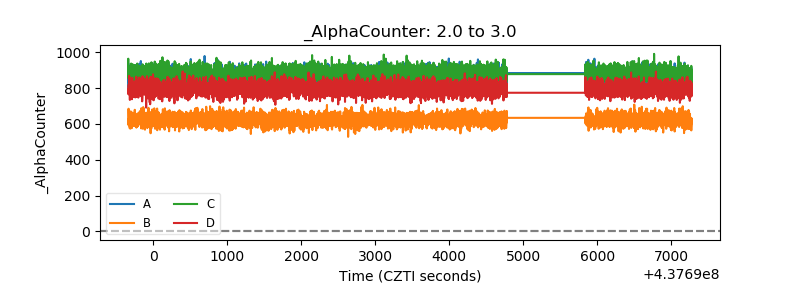 |
| _CPM_Rate | 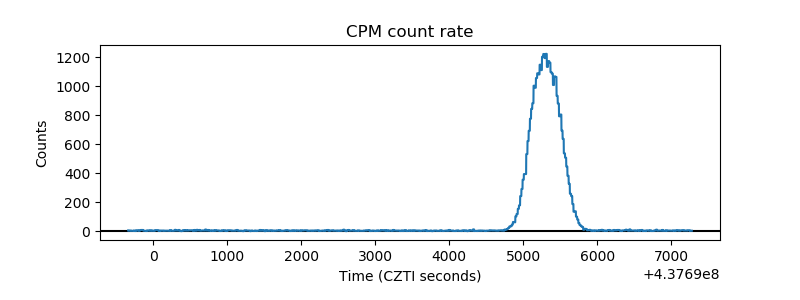 |
| CZT Counter | 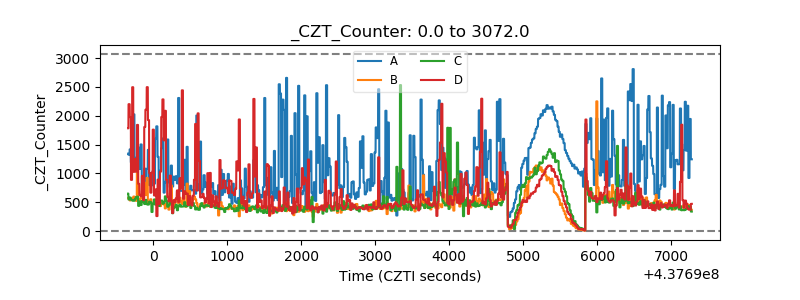 |
| +2.5 Volts monitor | 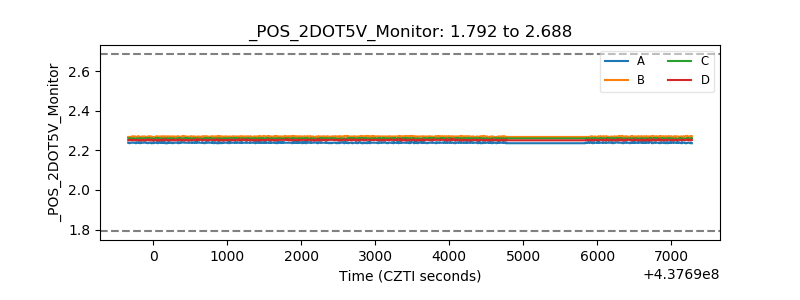 |
| +5 Volts monitor | 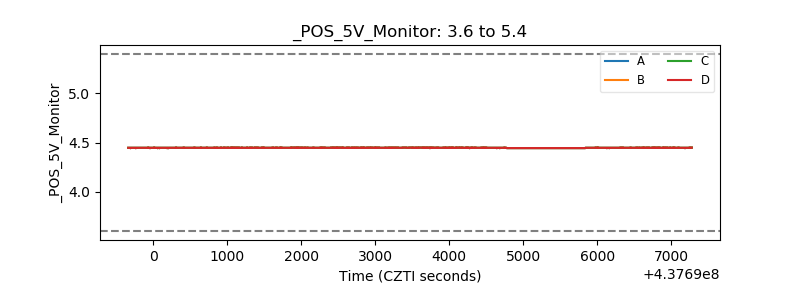 |
| _ROLL_ROT | 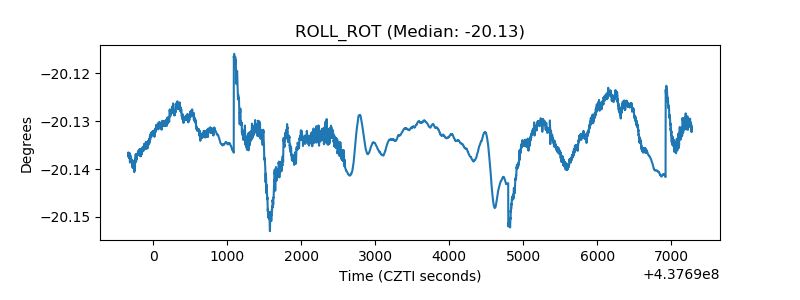 |
| _Roll_DEC | 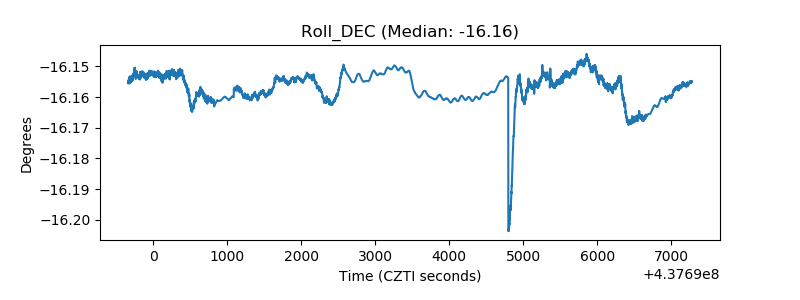 |
| _Roll_RA | 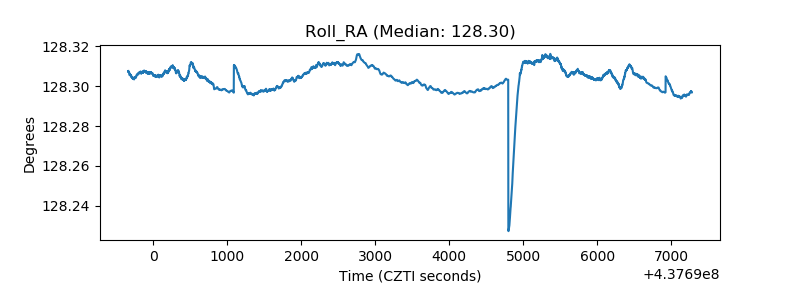 |
| Veto Counter | 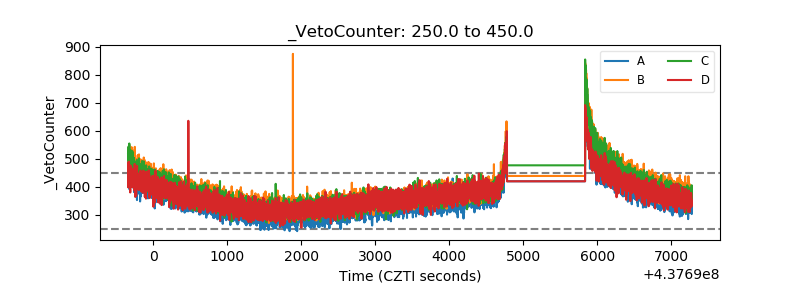 |