| Param | Original file | Final file |
|---|---|---|
| Filename | modeM0/AS1A13_065T06_9000005924_43965cztM0_level2.fits | modeM0/AS1A13_065T06_9000005924_43965cztM0_level2_quad_clean.evt |
| Size (bytes) | 540,607,680 | 107,956,800 |
| Size | 515.6 MB | 103.0 MB |
| Events in quadrant A | 9,089,514 | 644,388 |
| Events in quadrant B | 3,213,989 | 776,428 |
| Events in quadrant C | 3,063,753 | 735,985 |
| Events in quadrant D | 4,142,666 | 660,681 |
| Mode SS | |||
|---|---|---|---|
| Quadrant | BADHDUFLAG | Total packets | Discarded packets |
| A | 0 | 132 | 0 |
| B | 0 | 132 | 0 |
| C | 0 | 132 | 0 |
| D | 0 | 132 | 0 |
| Mode M9 | |||
|---|---|---|---|
| Quadrant | BADHDUFLAG | Total packets | Discarded packets |
| A | 0 | 14 | 0 |
| B | 0 | 15 | 0 |
| C | 0 | 15 | 0 |
| D | 0 | 15 | 0 |
| Mode M0 | |||
|---|---|---|---|
| Quadrant | BADHDUFLAG | Total packets | Discarded packets |
| A | 0 | 31547 | 2 |
| B | 0 | 13994 | 2 |
| C | 0 | 13656 | 2 |
| D | 0 | 16789 | 3 |
| Quadrant | Total seconds | Saturated seconds | Saturation percentage |
|---|---|---|---|
| A | 6467 | 1305 | 20.179372% |
| B | 6467 | 85 | 1.314365% |
| C | 6467 | 49 | 0.757693% |
| D | 6466 | 184 | 2.845654% |
Noise dominated data is calculated using 1-second bins in cleaned event files. If a bin has >2000 counts, and if more than 50% of those come from <1% of pixels, then it is considered to be noise-dominated and hence unusable.
| Quadrant | # 1 sec bins | Bins with >0 counts | Bins with >2000 counts | High rate bins dominated by noise | Noise dominated (total time) | Noise dominated (detector-on time) | Marked lightcurve |
|---|---|---|---|---|---|---|---|
| A | 7627 | 6468 | 1117 | 1117 | 14.65% | 17.27% | 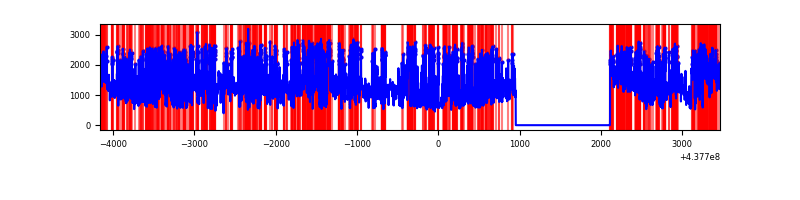 |
| B | 7626 | 6466 | 21 | 21 | 0.28% | 0.32% | 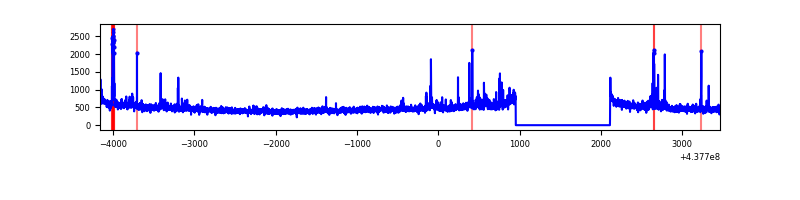 |
| C | 7626 | 6467 | 29 | 29 | 0.38% | 0.45% | 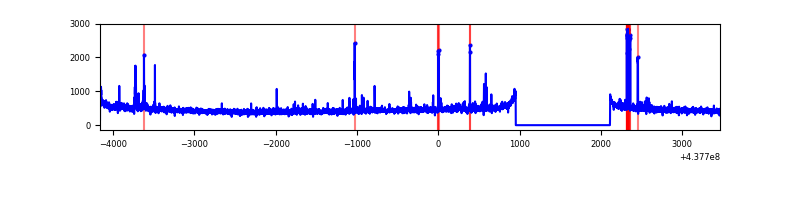 |
| D | 7625 | 6466 | 120 | 120 | 1.57% | 1.86% | 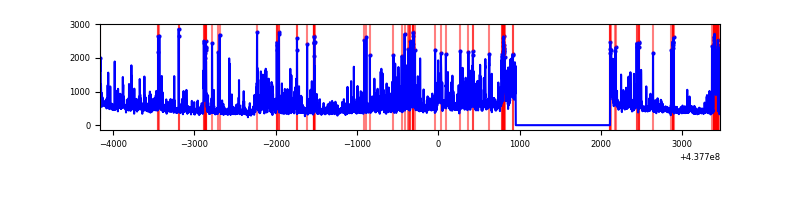 |
Top three noisy pixels from each quadrant. If the there are fewer than three noisy pixels in the level2.evt file, extra rows are filled as -1
| Pixel properties | Quadrant properties | ||||||
|---|---|---|---|---|---|---|---|
| Quadrant | DetID | PixID | Counts | Sigma | Mean | Median | Sigma |
| A | 15 | 223 | 4199379 | 28891.21 | 705 | 692 | 145.3 |
| A | 10 | 83 | 1105381 | 7601.38 | 705 | 692 | 145.3 |
| A | 14 | 238 | 1016730 | 6991.37 | 705 | 692 | 145.3 |
| B | 0 | 183 | 77959 | 522.23 | 754 | 730 | 147.9 |
| B | 0 | 200 | 62687 | 418.96 | 754 | 730 | 147.9 |
| B | 4 | 158 | 23046 | 150.9 | 754 | 730 | 147.9 |
| C | 14 | 254 | 85239 | 484.06 | 739 | 744 | 174.6 |
| C | 12 | 16 | 70639 | 400.42 | 739 | 744 | 174.6 |
| C | 3 | 233 | 14891 | 81.05 | 739 | 744 | 174.6 |
| D | 1 | 52 | 483078 | 2636.38 | 723 | 701 | 183.0 |
| D | 5 | 235 | 252357 | 1375.4 | 723 | 701 | 183.0 |
| D | 12 | 17 | 96889 | 525.71 | 723 | 701 | 183.0 |
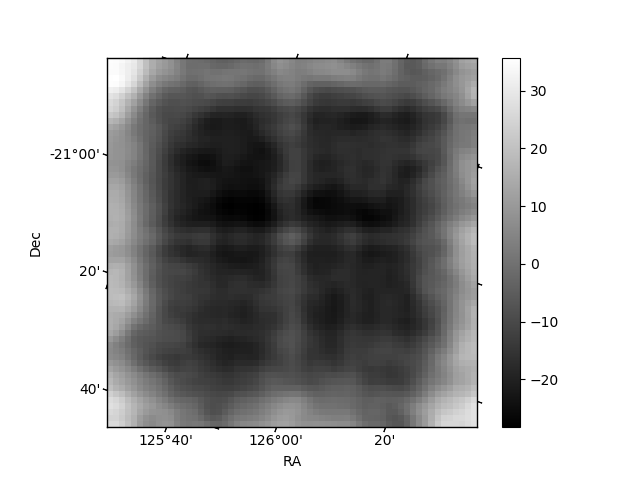
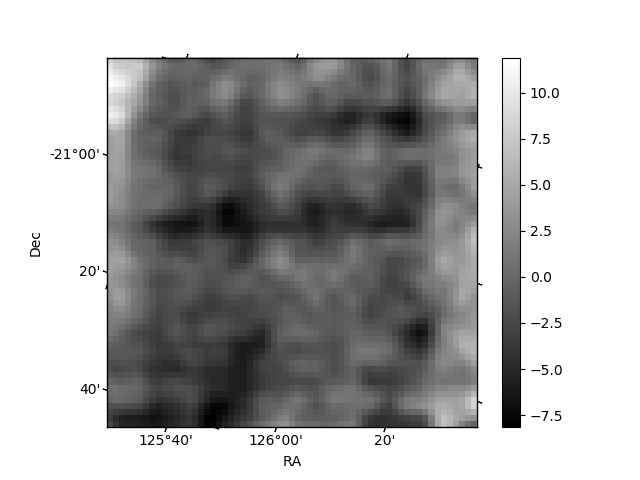
Histogram calculated using DETX and DETY for each event in the final _common_clean file
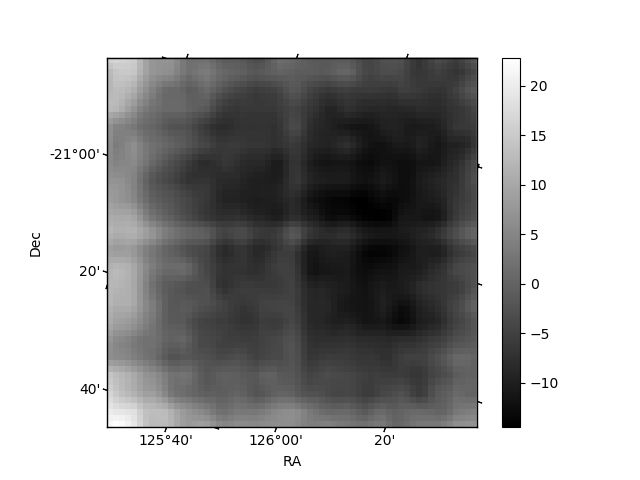
| Quadrant A | 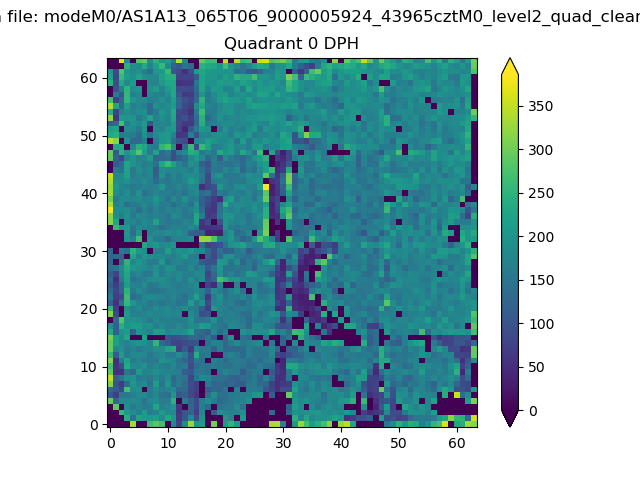 |
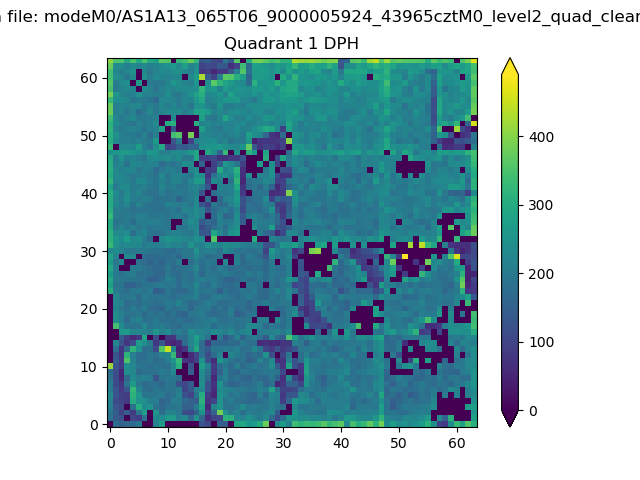 |
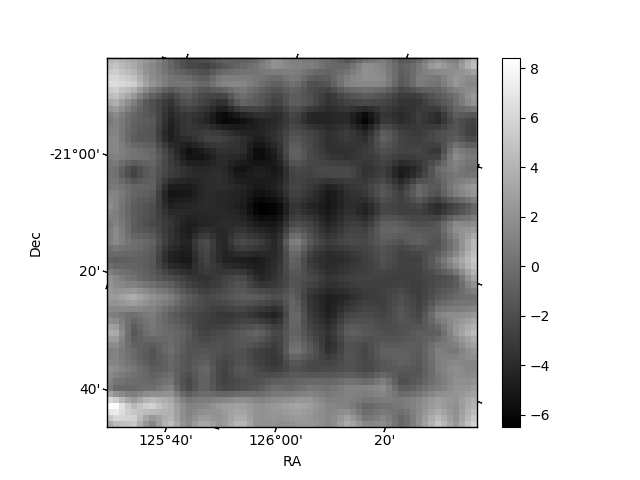
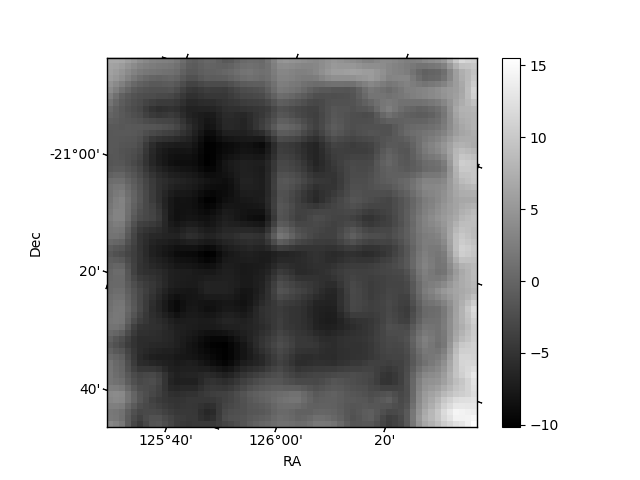
Quadrant B |
|---|---|---|---|
| Quadrant D | 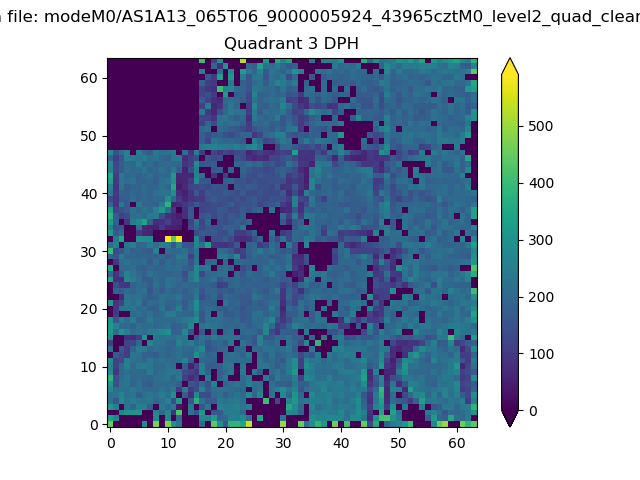 |
 |
Quadrant C |
| Plot type | Count rate plots | Images |
|---|---|---|
| Comparison with Poisson distribution Blue bars denote a histogram of data divided into 1 sec bins. Red curve is a Poisson curve with rate = median count rate of data. |
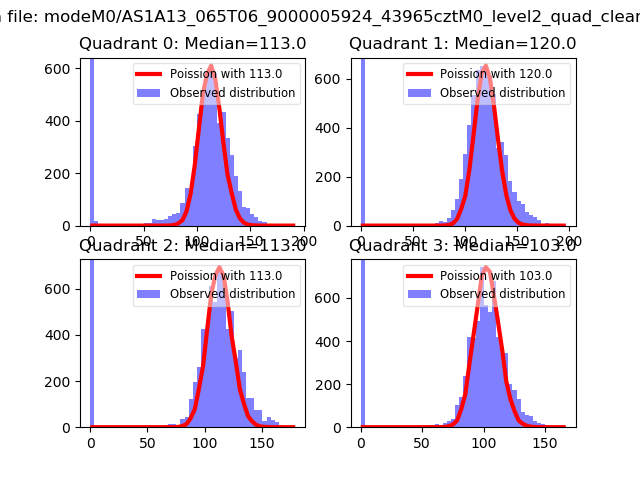 |
 |
| Quadrant-wise count rates Data is divided into 100 sec bins |
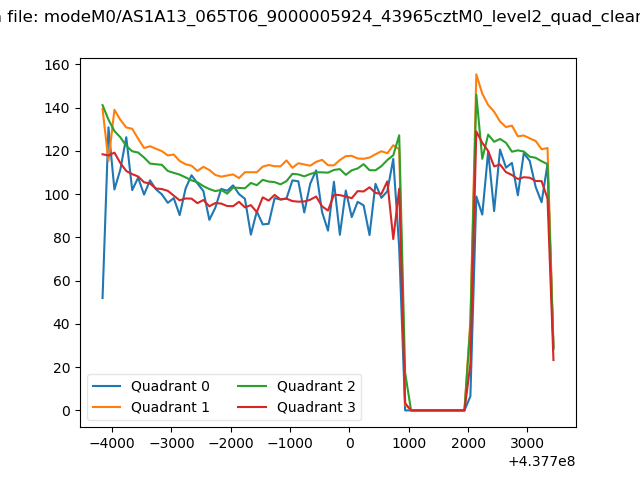 |
|
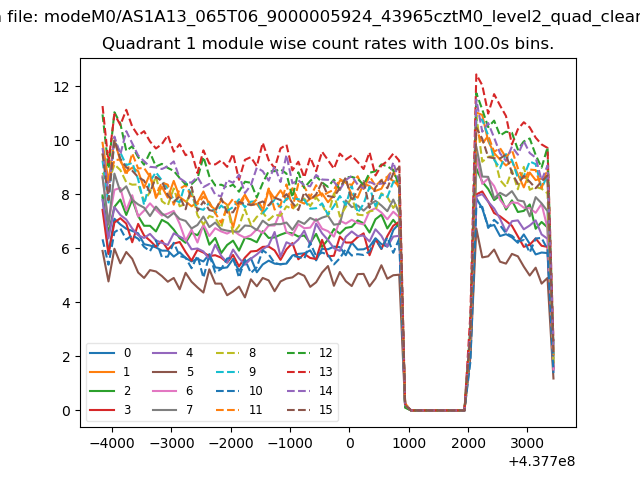
| Module-wise count rates for Quadrant A Data is divided into 100 sec bins |
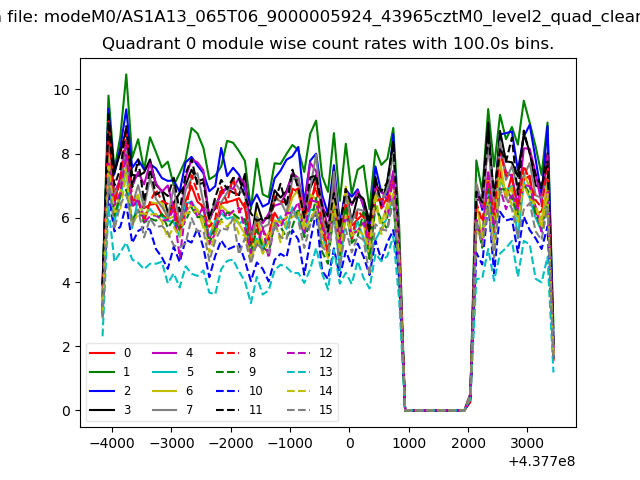 |
 |
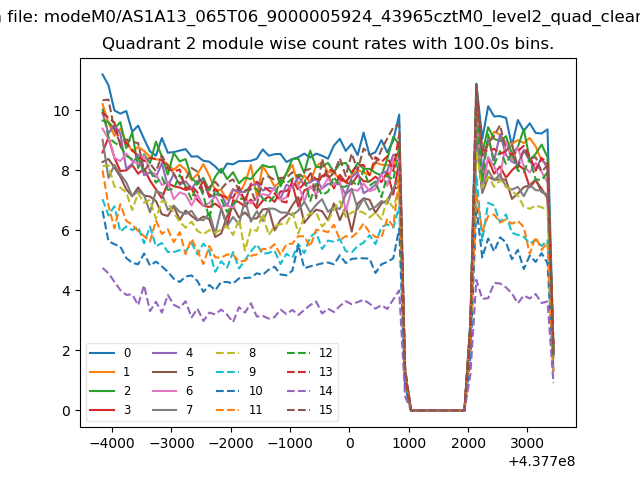
| Module-wise count rates for Quadrant B Data is divided into 100 sec bins |
 |
 |
| Module-wise count rates for Quadrant C Data is divided into 100 sec bins |
 |
 |
| Module-wise count rates for Quadrant D Data is divided into 100 sec bins |
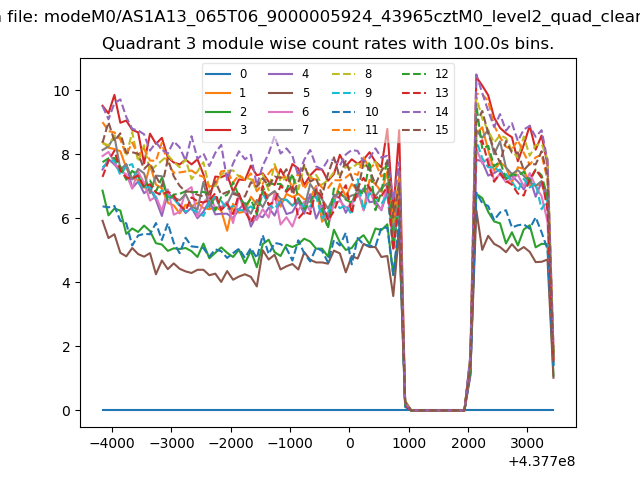 |
 |
| Parameter | Plot |
|---|---|
| CZT HV Monitor | 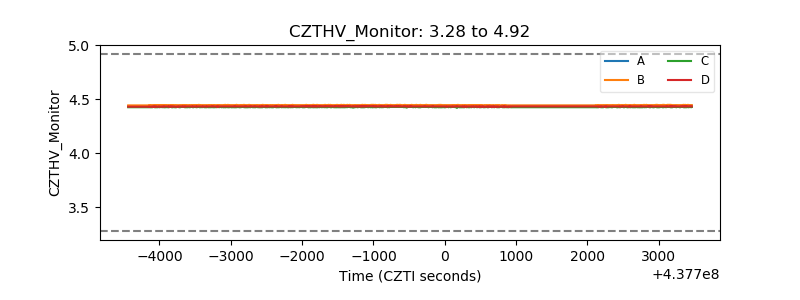 |
| D_VDD | 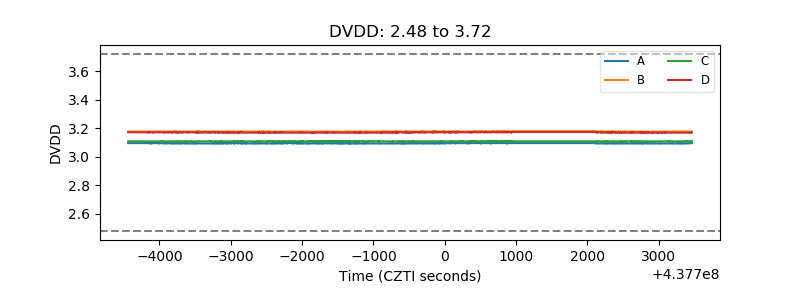 |
| Temperature 1 | 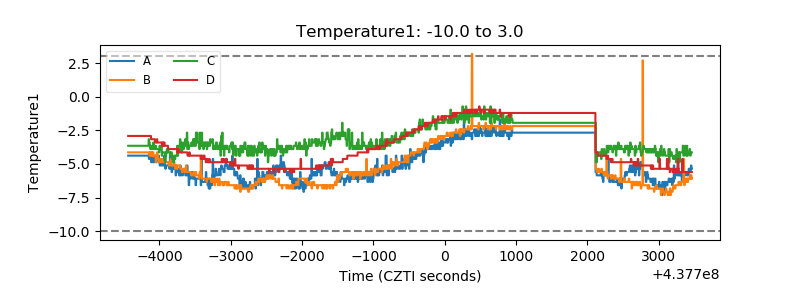 |
| Veto HV Monitor | 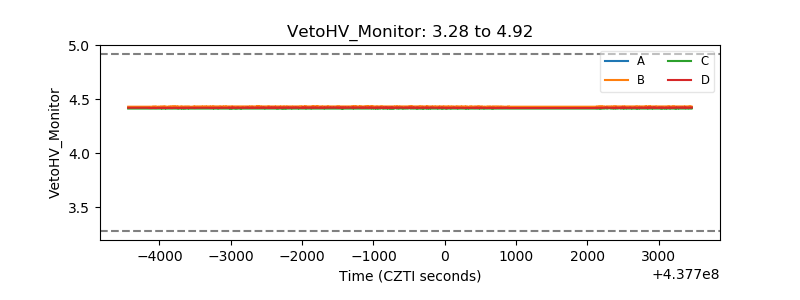 |
| Veto LLD | 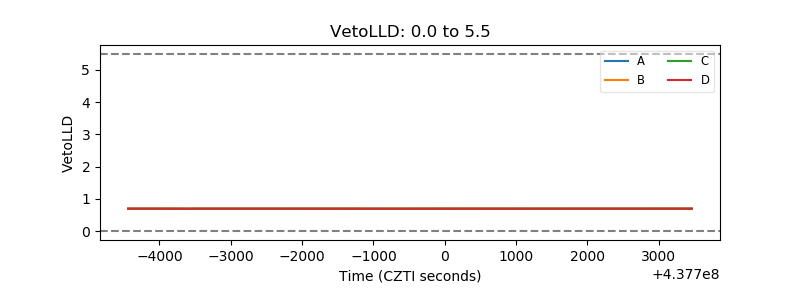 |
| Alpha Counter | 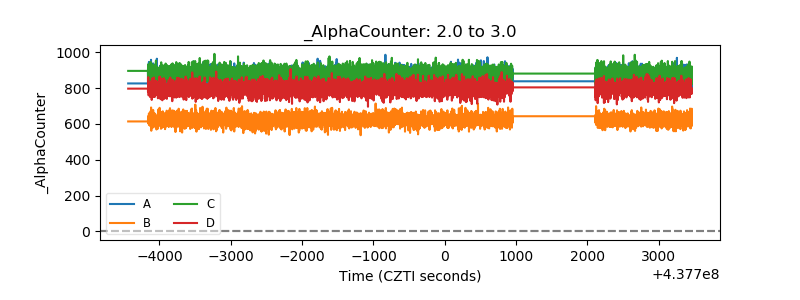 |
| _CPM_Rate | 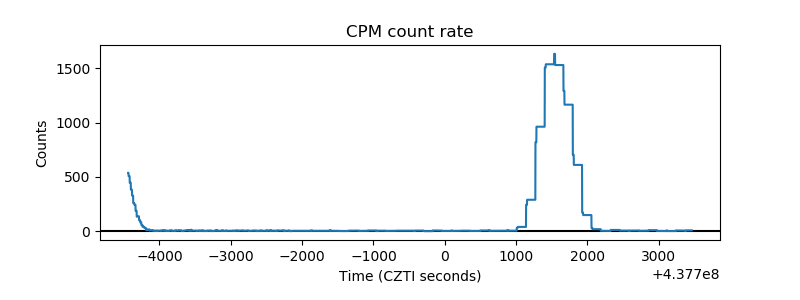 |
| CZT Counter | 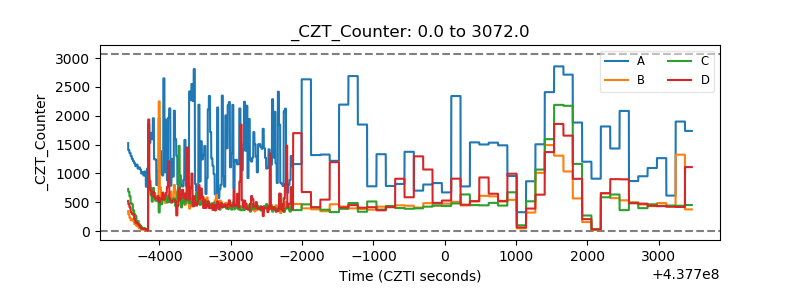 |
| +2.5 Volts monitor | 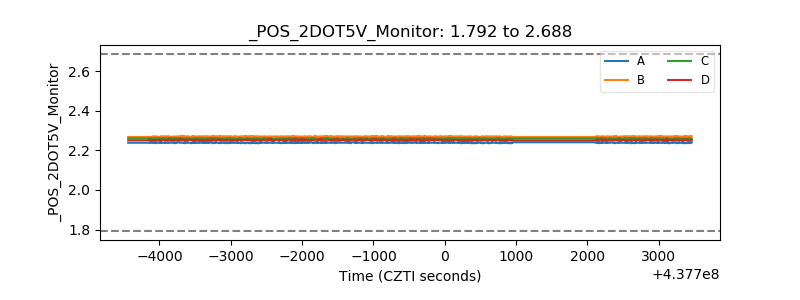 |
| +5 Volts monitor | 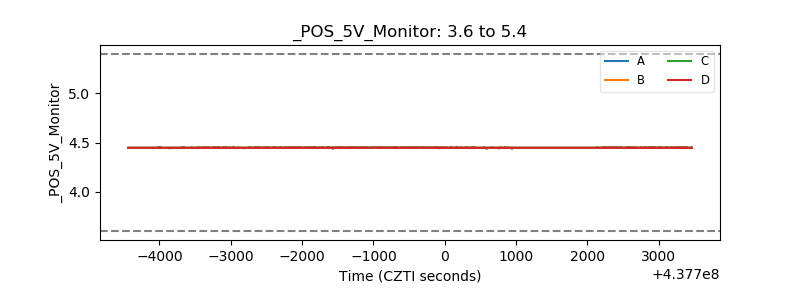 |
| _ROLL_ROT | 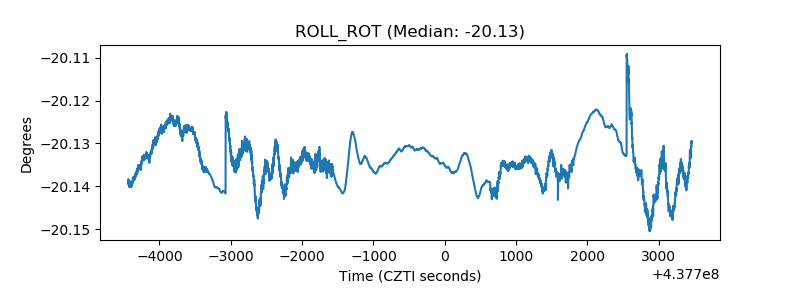 |
| _Roll_DEC | 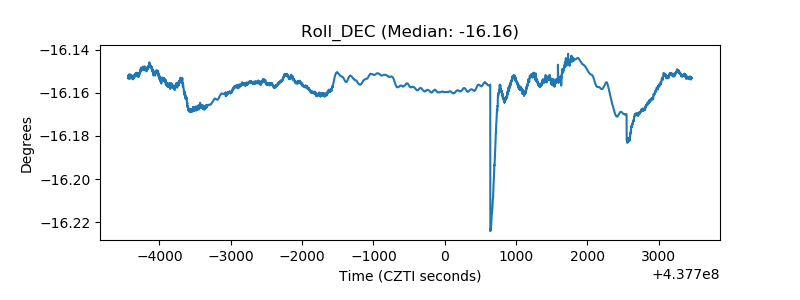 |
| _Roll_RA | 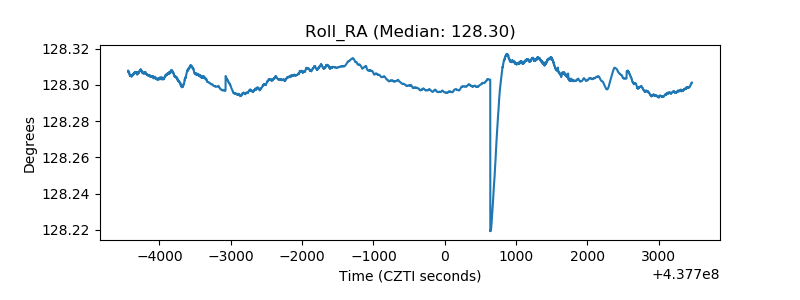 |
| Veto Counter | 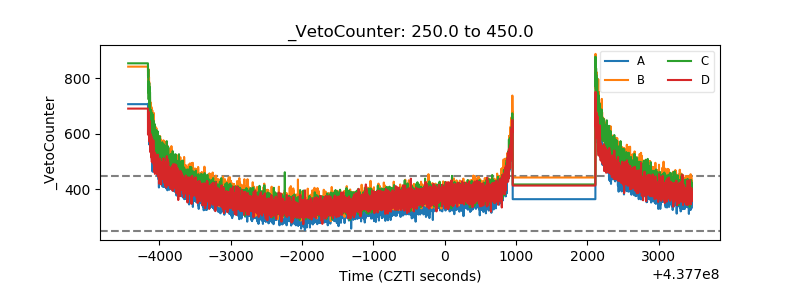 |