| Param | Original file | Final file |
|---|---|---|
| Filename | modeM0/AS1A13_065T06_9000005924_43966cztM0_level2.fits | modeM0/AS1A13_065T06_9000005924_43966cztM0_level2_quad_clean.evt |
| Size (bytes) | 660,499,200 | 106,885,440 |
| Size | 629.9 MB | 101.9 MB |
| Events in quadrant A | 12,516,556 | 467,535 |
| Events in quadrant B | 3,346,820 | 831,190 |
| Events in quadrant C | 3,238,652 | 783,565 |
| Events in quadrant D | 4,824,778 | 684,579 |
| Mode SS | |||
|---|---|---|---|
| Quadrant | BADHDUFLAG | Total packets | Discarded packets |
| A | 0 | 136 | 0 |
| B | 0 | 136 | 0 |
| C | 0 | 136 | 0 |
| D | 0 | 136 | 0 |
| Mode M9 | |||
|---|---|---|---|
| Quadrant | BADHDUFLAG | Total packets | Discarded packets |
| A | 0 | 20 | 0 |
| B | 0 | 21 | 0 |
| C | 0 | 21 | 0 |
| D | 0 | 21 | 0 |
| Mode M0 | |||
|---|---|---|---|
| Quadrant | BADHDUFLAG | Total packets | Discarded packets |
| A | 0 | 41930 | 2 |
| B | 0 | 14523 | 2 |
| C | 0 | 14269 | 2 |
| D | 0 | 19023 | 2 |
| Quadrant | Total seconds | Saturated seconds | Saturation percentage |
|---|---|---|---|
| A | 6738 | 3188 | 47.313743% |
| B | 6738 | 75 | 1.113090% |
| C | 6738 | 57 | 0.845948% |
| D | 6738 | 390 | 5.788068% |
Noise dominated data is calculated using 1-second bins in cleaned event files. If a bin has >2000 counts, and if more than 50% of those come from <1% of pixels, then it is considered to be noise-dominated and hence unusable.
| Quadrant | # 1 sec bins | Bins with >0 counts | Bins with >2000 counts | High rate bins dominated by noise | Noise dominated (total time) | Noise dominated (detector-on time) | Marked lightcurve |
|---|---|---|---|---|---|---|---|
| A | 7944 | 6741 | 3288 | 3288 | 41.39% | 48.78% | 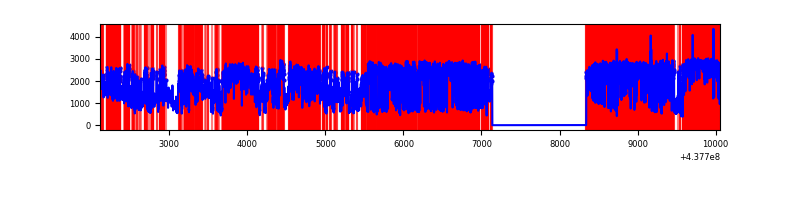 |
| B | 7943 | 6739 | 12 | 12 | 0.15% | 0.18% | 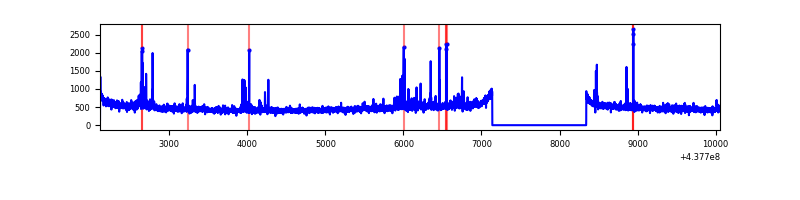 |
| C | 7944 | 6740 | 34 | 34 | 0.43% | 0.50% | 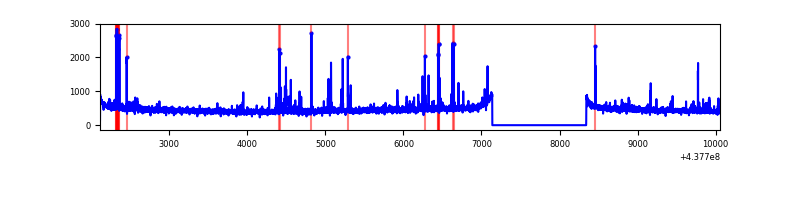 |
| D | 7944 | 6741 | 371 | 371 | 4.67% | 5.50% | 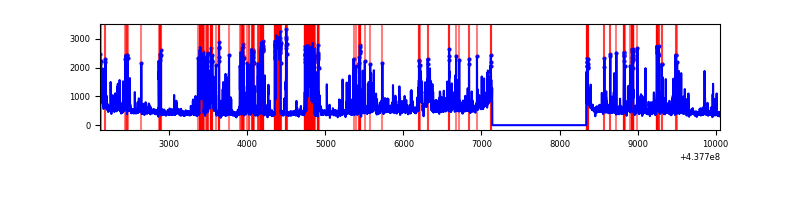 |
Top three noisy pixels from each quadrant. If the there are fewer than three noisy pixels in the level2.evt file, extra rows are filled as -1
| Pixel properties | Quadrant properties | ||||||
|---|---|---|---|---|---|---|---|
| Quadrant | DetID | PixID | Counts | Sigma | Mean | Median | Sigma |
| A | 15 | 223 | 8546184 | 67435.6 | 617 | 606 | 126.7 |
| A | 10 | 83 | 981002 | 7736.59 | 617 | 606 | 126.7 |
| A | 14 | 238 | 540959 | 4264.08 | 617 | 606 | 126.7 |
| B | 5 | 172 | 66410 | 424.54 | 792 | 768 | 154.6 |
| B | 0 | 200 | 56984 | 363.58 | 792 | 768 | 154.6 |
| B | 0 | 183 | 27491 | 172.83 | 792 | 768 | 154.6 |
| C | 14 | 254 | 86212 | 469.73 | 776 | 781 | 181.9 |
| C | 12 | 16 | 69397 | 377.28 | 776 | 781 | 181.9 |
| C | 15 | 157 | 56629 | 307.07 | 776 | 781 | 181.9 |
| D | 10 | 118 | 416477 | 2215.75 | 751 | 729 | 187.6 |
| D | 12 | 17 | 339847 | 1807.35 | 751 | 729 | 187.6 |
| D | 2 | 249 | 314102 | 1670.14 | 751 | 729 | 187.6 |
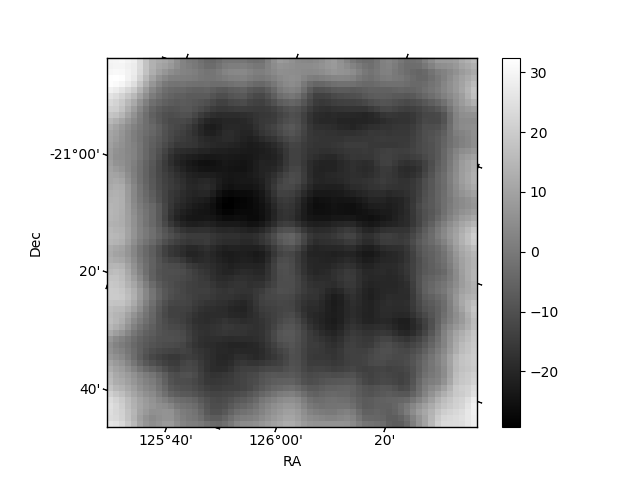
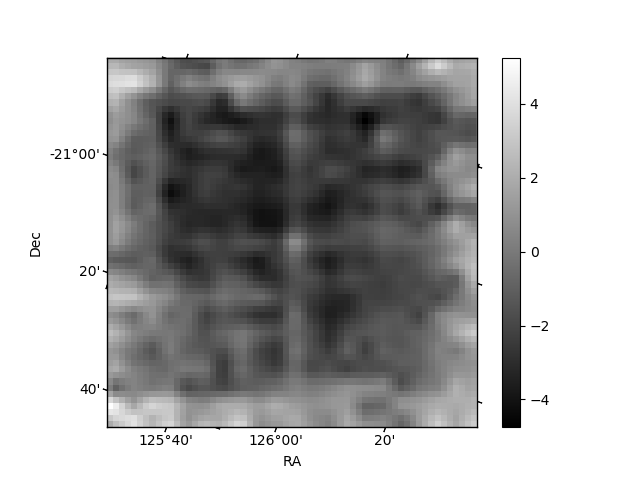
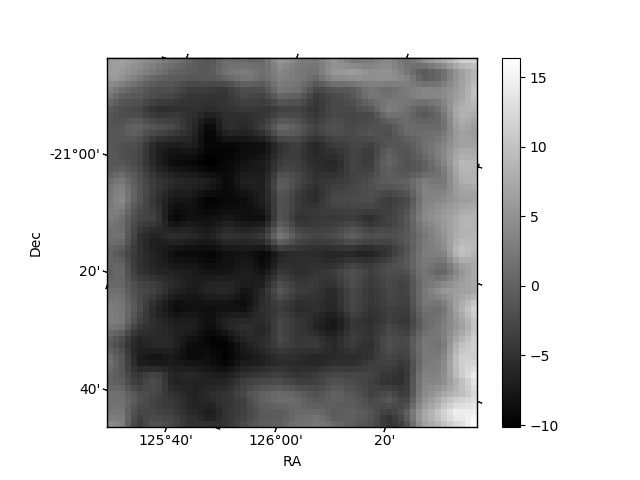
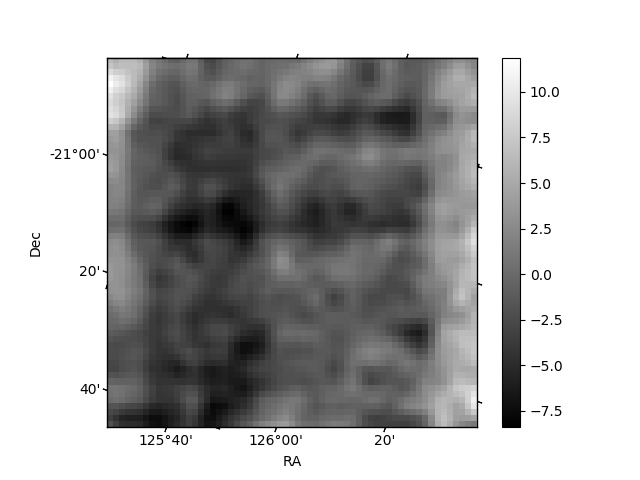
Histogram calculated using DETX and DETY for each event in the final _common_clean file
| Quadrant A | 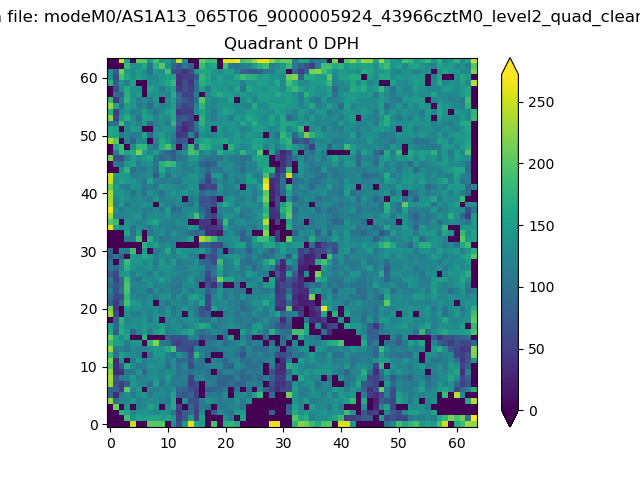 |
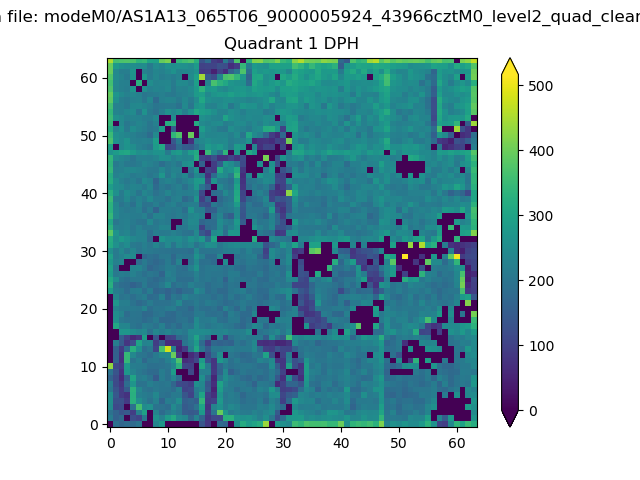 |
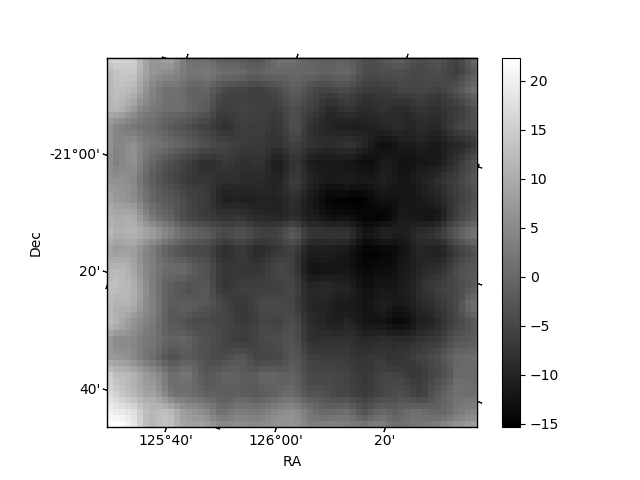
Quadrant B |
|---|---|---|---|
| Quadrant D | 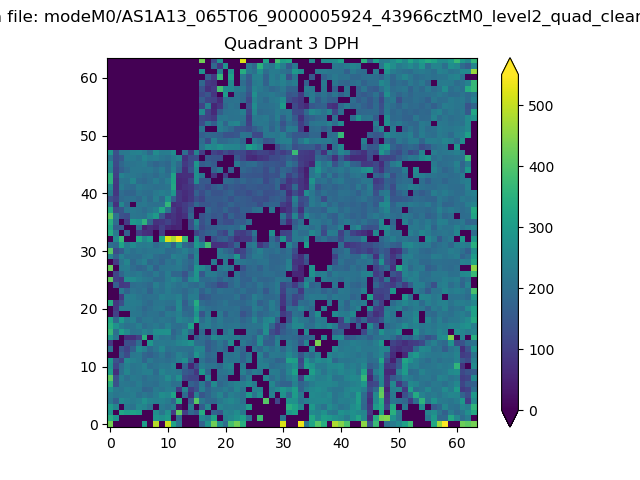 |
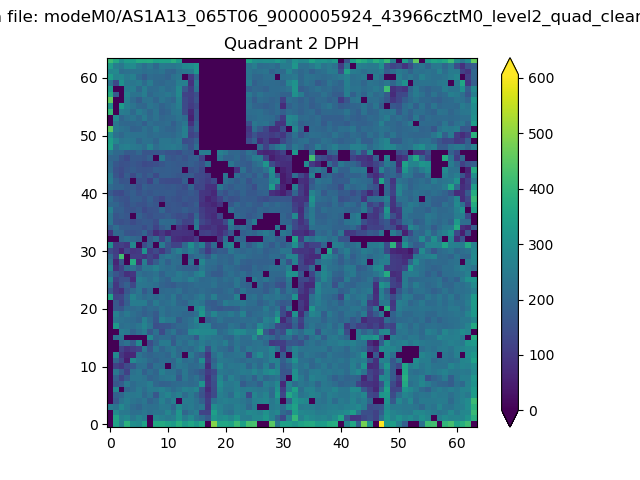 |
Quadrant C |
| Plot type | Count rate plots | Images |
|---|---|---|
| Comparison with Poisson distribution Blue bars denote a histogram of data divided into 1 sec bins. Red curve is a Poisson curve with rate = median count rate of data. |
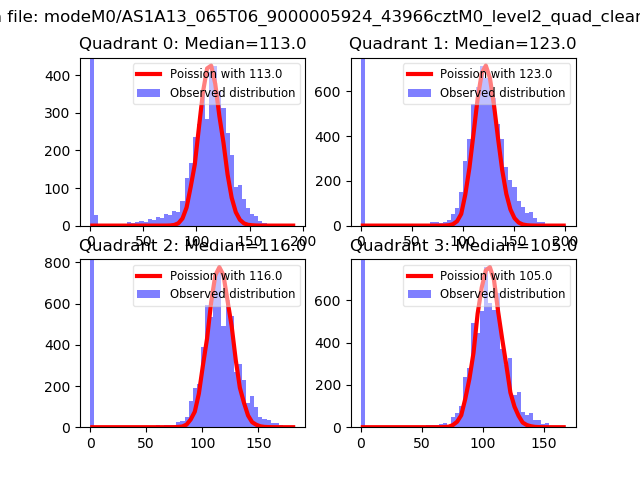 |
 |
| Quadrant-wise count rates Data is divided into 100 sec bins |
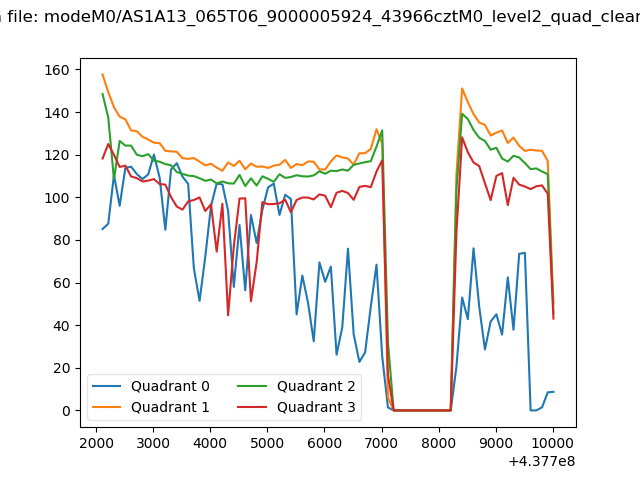 |
|
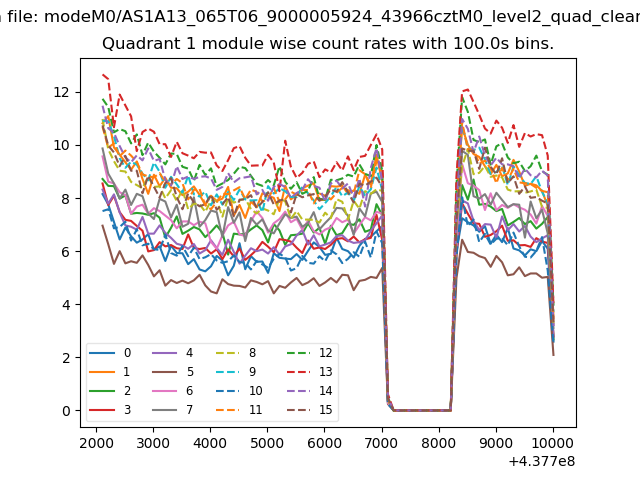
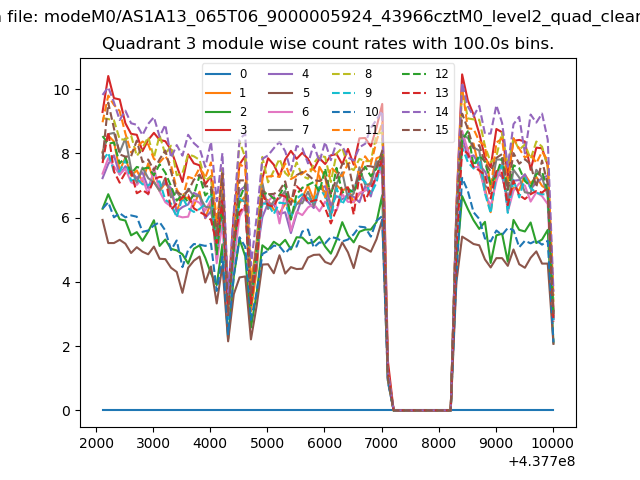
| Module-wise count rates for Quadrant A Data is divided into 100 sec bins |
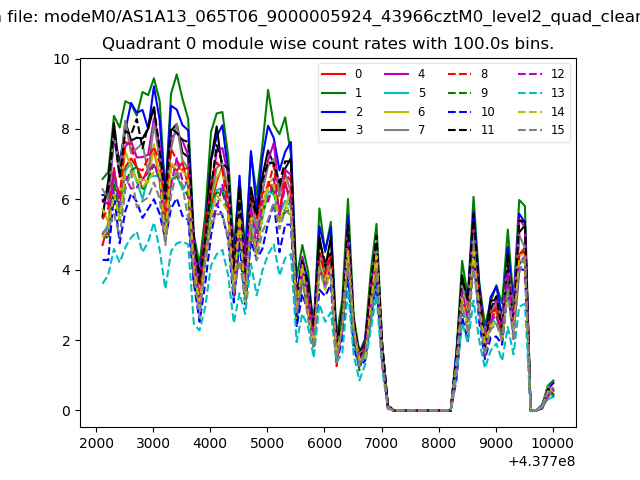 |
 |
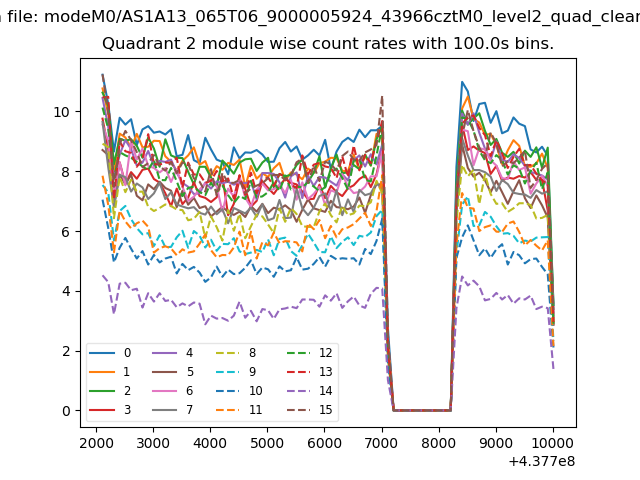
| Module-wise count rates for Quadrant B Data is divided into 100 sec bins |
 |
 |
| Module-wise count rates for Quadrant C Data is divided into 100 sec bins |
 |
 |
| Module-wise count rates for Quadrant D Data is divided into 100 sec bins |
 |
 |
| Parameter | Plot |
|---|---|
| CZT HV Monitor | 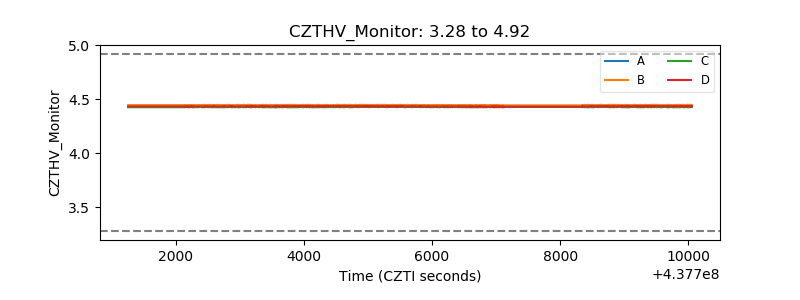 |
| D_VDD | 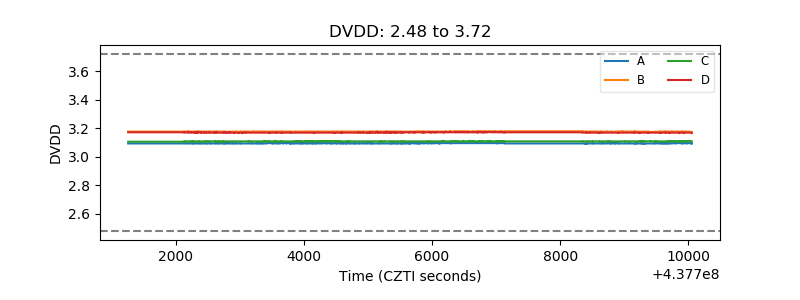 |
| Temperature 1 | 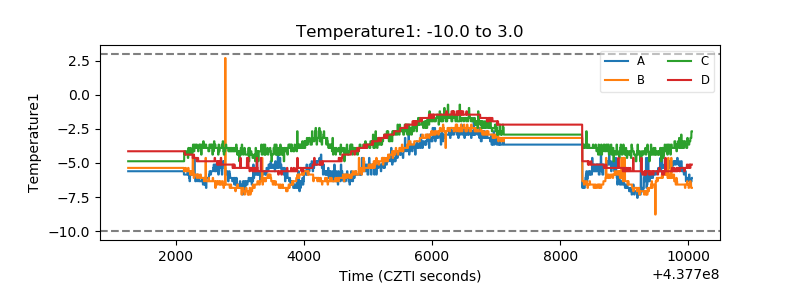 |
| Veto HV Monitor | 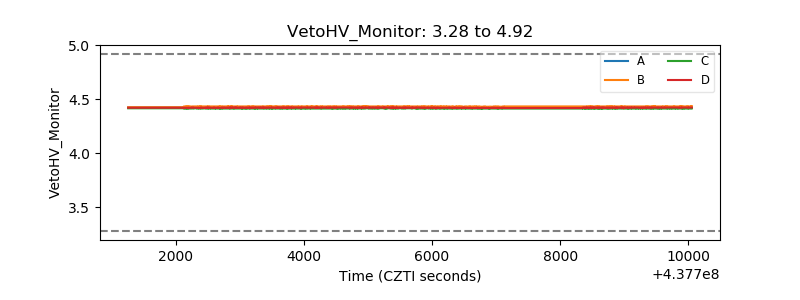 |
| Veto LLD | 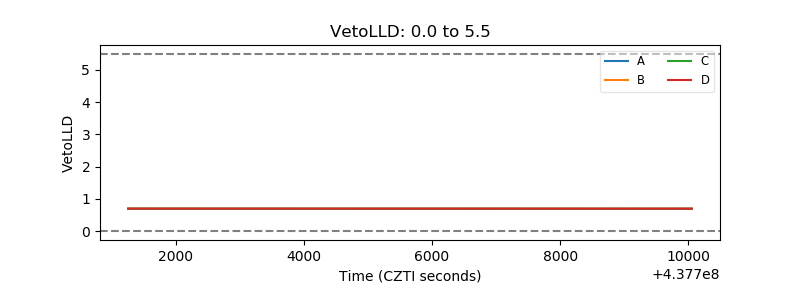 |
| Alpha Counter | 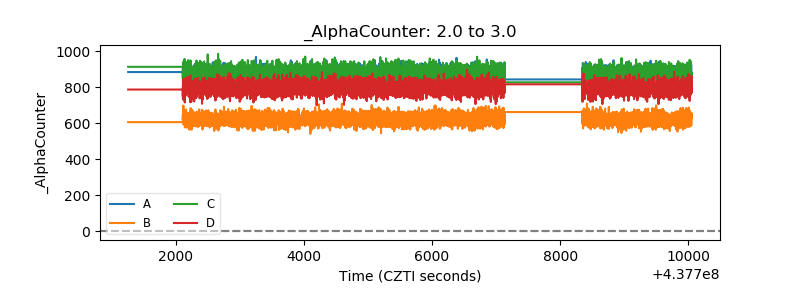 |
| _CPM_Rate | 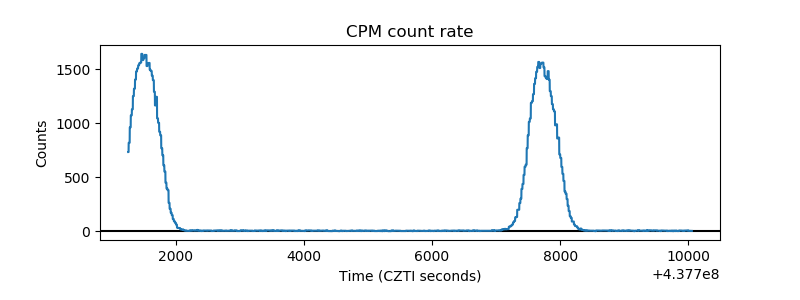 |
| CZT Counter | 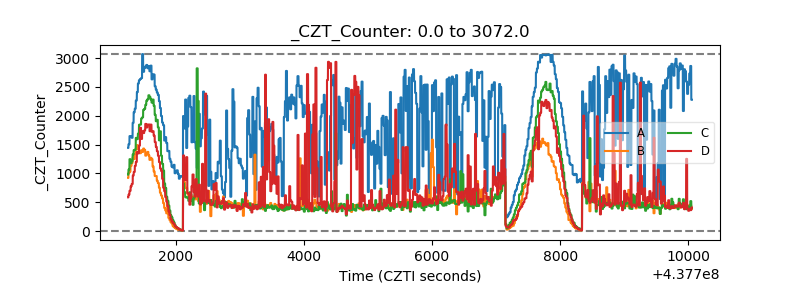 |
| +2.5 Volts monitor | 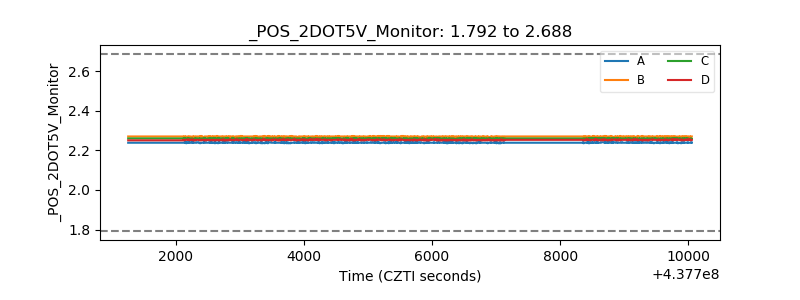 |
| +5 Volts monitor | 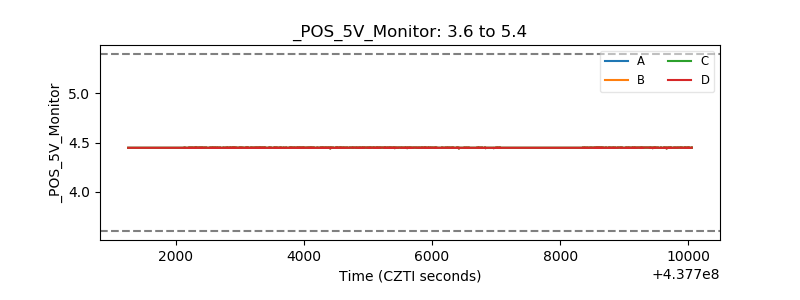 |
| _ROLL_ROT | 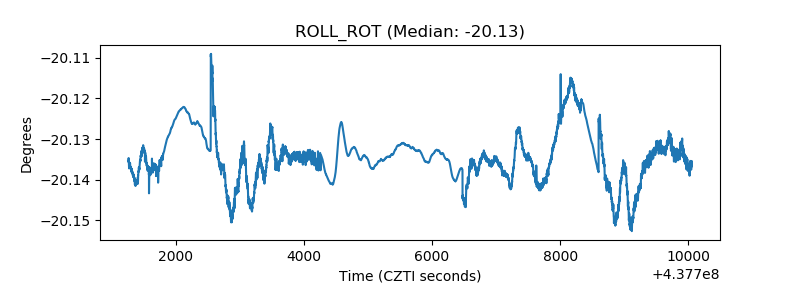 |
| _Roll_DEC |  |
| _Roll_RA | 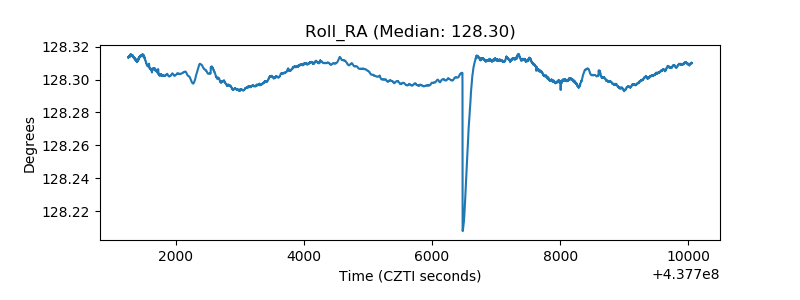 |
| Veto Counter | 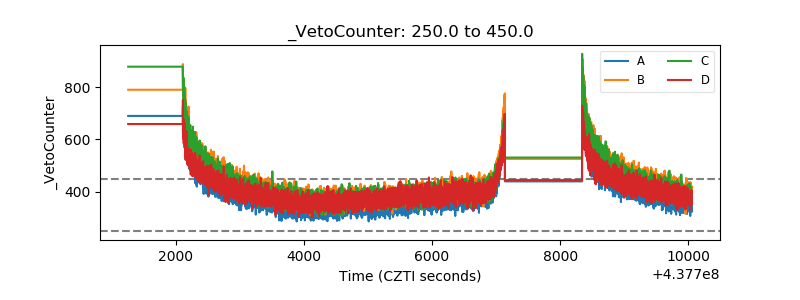 |