| Param | Original file | Final file |
|---|---|---|
| Filename | modeM0/AS1A13_065T06_9000005924_43968cztM0_level2.fits | modeM0/AS1A13_065T06_9000005924_43968cztM0_level2_quad_clean.evt |
| Size (bytes) | 476,504,640 | 98,115,840 |
| Size | 454.4 MB | 93.6 MB |
| Events in quadrant A | 6,255,951 | 611,324 |
| Events in quadrant B | 3,160,984 | 687,398 |
| Events in quadrant C | 2,870,744 | 669,486 |
| Events in quadrant D | 4,889,705 | 587,936 |
| Mode SS | |||
|---|---|---|---|
| Quadrant | BADHDUFLAG | Total packets | Discarded packets |
| A | 0 | 120 | 0 |
| B | 0 | 120 | 0 |
| C | 0 | 120 | 0 |
| D | 0 | 120 | 0 |
| Mode M9 | |||
|---|---|---|---|
| Quadrant | BADHDUFLAG | Total packets | Discarded packets |
| A | 0 | 11 | 0 |
| B | 0 | 11 | 0 |
| C | 0 | 11 | 0 |
| D | 0 | 11 | 0 |
| Mode M0 | |||
|---|---|---|---|
| Quadrant | BADHDUFLAG | Total packets | Discarded packets |
| A | 0 | 23071 | 1 |
| B | 0 | 13514 | 1 |
| C | 0 | 12686 | 1 |
| D | 0 | 18604 | 3 |
| Quadrant | Total seconds | Saturated seconds | Saturation percentage |
|---|---|---|---|
| A | 5940 | 789 | 13.282828% |
| B | 5941 | 193 | 3.248611% |
| C | 5941 | 39 | 0.656455% |
| D | 5940 | 341 | 5.740741% |
Noise dominated data is calculated using 1-second bins in cleaned event files. If a bin has >2000 counts, and if more than 50% of those come from <1% of pixels, then it is considered to be noise-dominated and hence unusable.
| Quadrant | # 1 sec bins | Bins with >0 counts | Bins with >2000 counts | High rate bins dominated by noise | Noise dominated (total time) | Noise dominated (detector-on time) | Marked lightcurve |
|---|---|---|---|---|---|---|---|
| A | 7025 | 5941 | 630 | 630 | 8.97% | 10.60% | 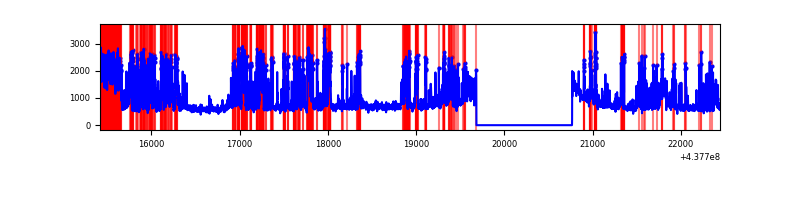 |
| B | 7026 | 5941 | 107 | 107 | 1.52% | 1.80% | 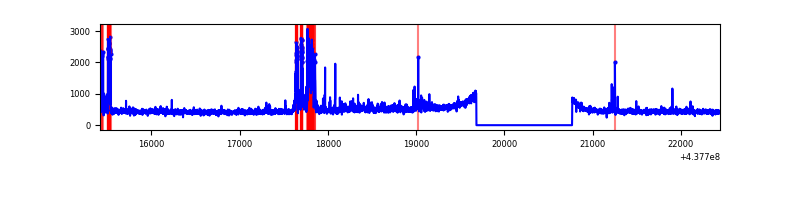 |
| C | 7026 | 5941 | 13 | 13 | 0.19% | 0.22% | 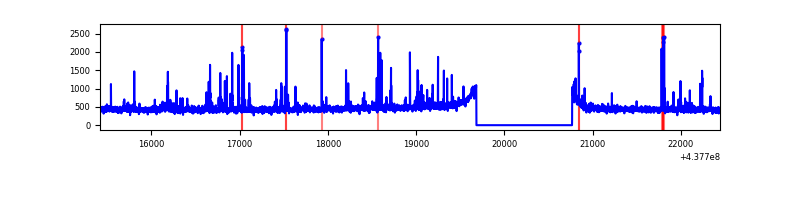 |
| D | 7025 | 5940 | 382 | 382 | 5.44% | 6.43% | 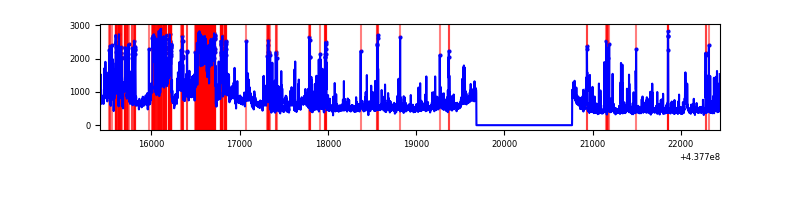 |
Top three noisy pixels from each quadrant. If the there are fewer than three noisy pixels in the level2.evt file, extra rows are filled as -1
| Pixel properties | Quadrant properties | ||||||
|---|---|---|---|---|---|---|---|
| Quadrant | DetID | PixID | Counts | Sigma | Mean | Median | Sigma |
| A | 14 | 238 | 2092750 | 15110.99 | 662 | 648 | 138.4 |
| A | 10 | 83 | 927528 | 6694.74 | 662 | 648 | 138.4 |
| A | 15 | 223 | 625146 | 4510.67 | 662 | 648 | 138.4 |
| B | 5 | 172 | 320795 | 2366.64 | 681 | 660 | 135.3 |
| B | 0 | 213 | 53718 | 392.24 | 681 | 660 | 135.3 |
| B | 0 | 183 | 51411 | 375.18 | 681 | 660 | 135.3 |
| C | 14 | 254 | 96619 | 595.37 | 680 | 684 | 161.1 |
| C | 15 | 157 | 60352 | 370.3 | 680 | 684 | 161.1 |
| C | 3 | 233 | 35236 | 214.43 | 680 | 684 | 161.1 |
| D | 12 | 17 | 870674 | 5047.05 | 671 | 650 | 172.4 |
| D | 5 | 184 | 616521 | 3572.7 | 671 | 650 | 172.4 |
| D | 5 | 222 | 216269 | 1250.82 | 671 | 650 | 172.4 |
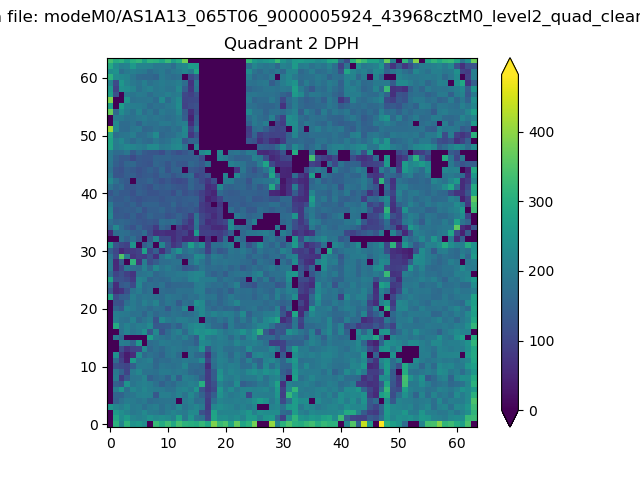
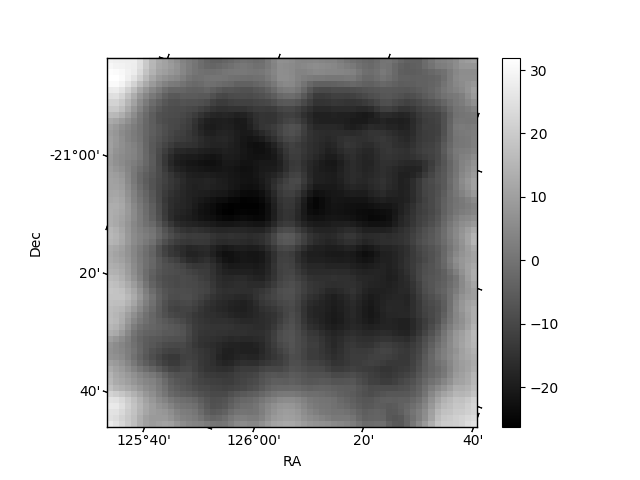
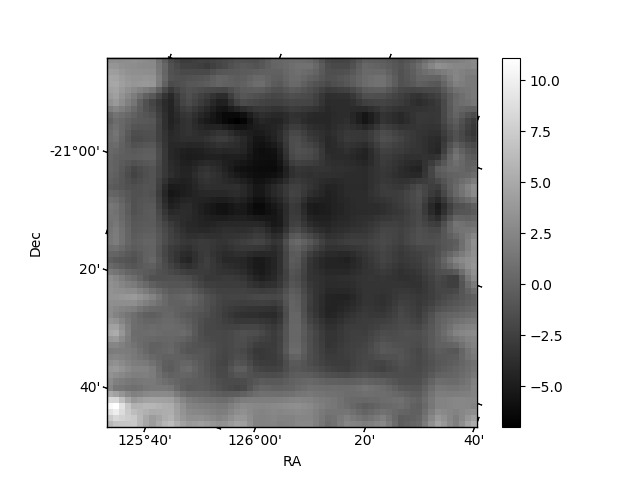
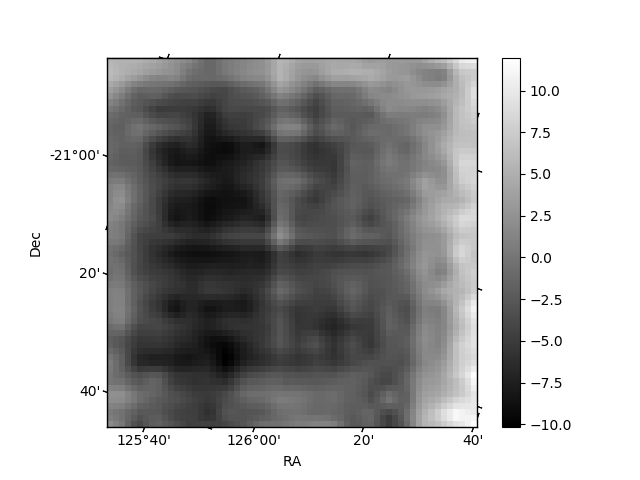
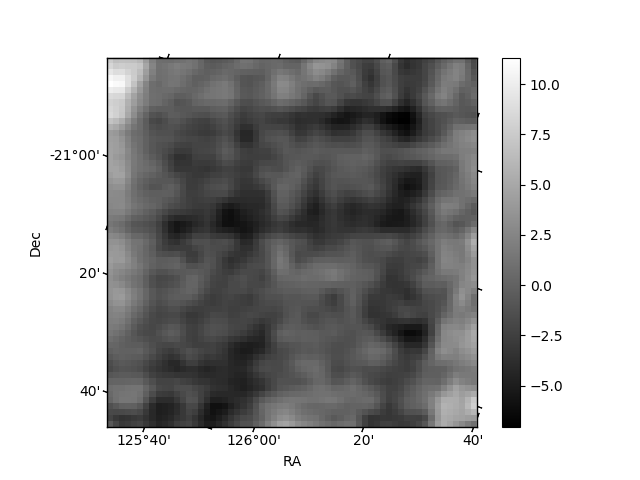
Histogram calculated using DETX and DETY for each event in the final _common_clean file
| Quadrant A | 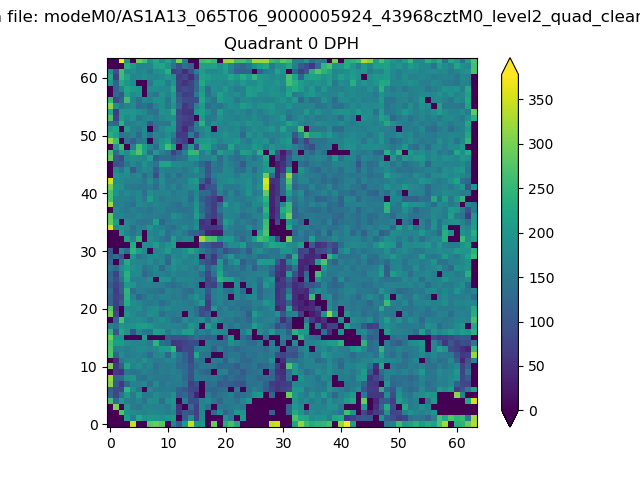 |
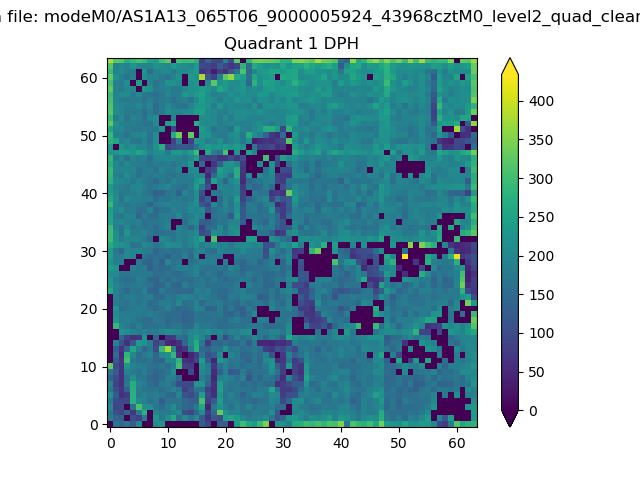 |
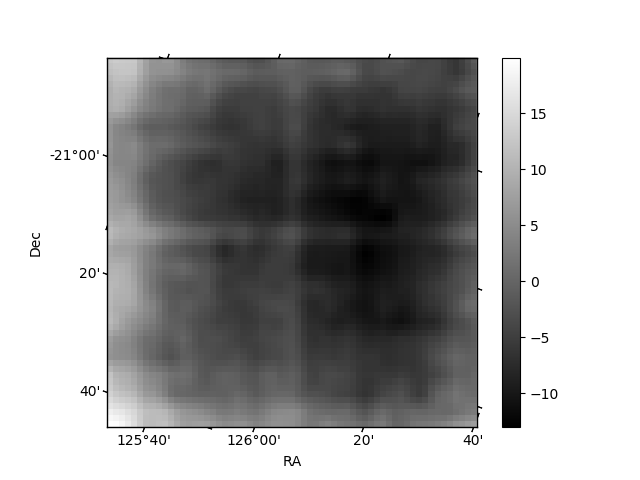
Quadrant B |
|---|---|---|---|
| Quadrant D | 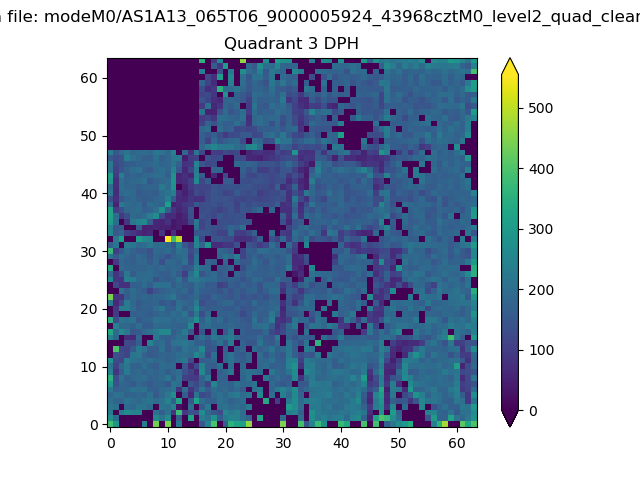 |
 |
Quadrant C |
| Plot type | Count rate plots | Images |
|---|---|---|
| Comparison with Poisson distribution Blue bars denote a histogram of data divided into 1 sec bins. Red curve is a Poisson curve with rate = median count rate of data. |
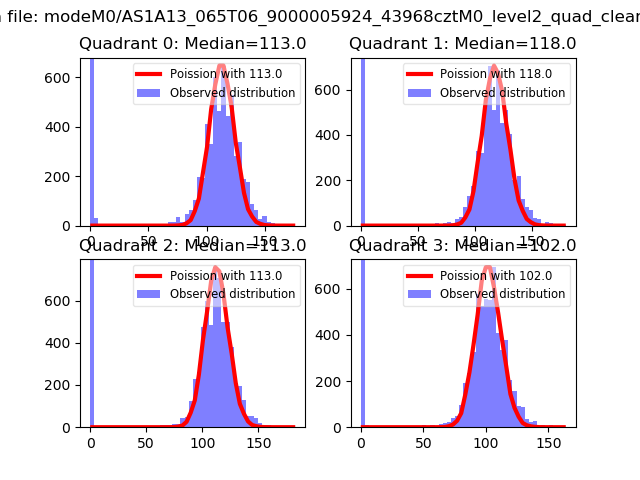 |
 |
| Quadrant-wise count rates Data is divided into 100 sec bins |
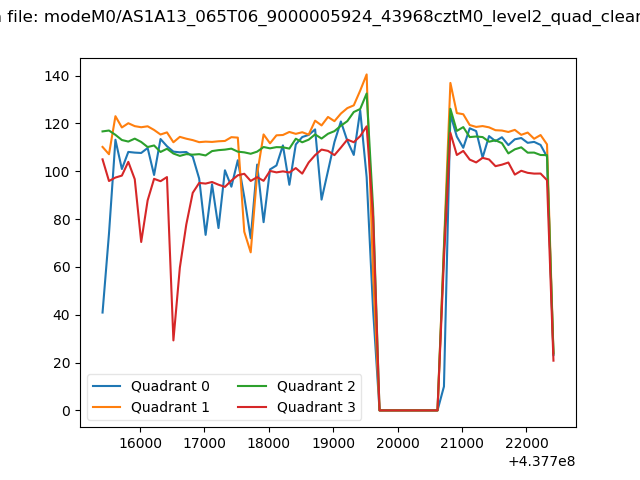 |
|
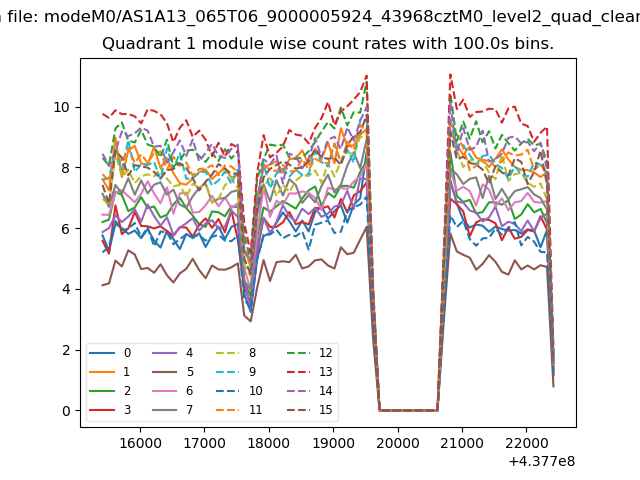
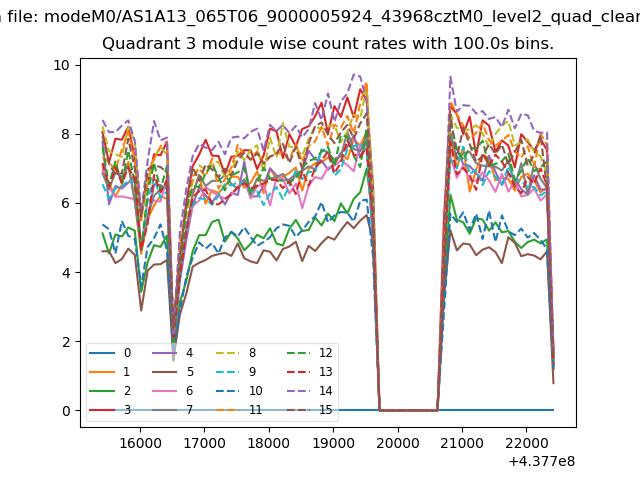
| Module-wise count rates for Quadrant A Data is divided into 100 sec bins |
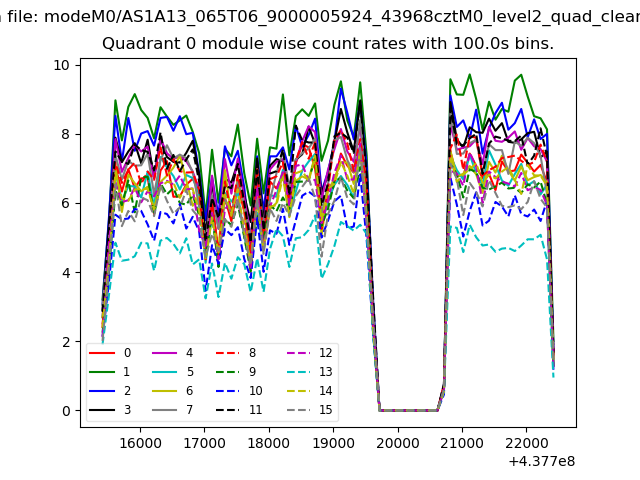 |
 |
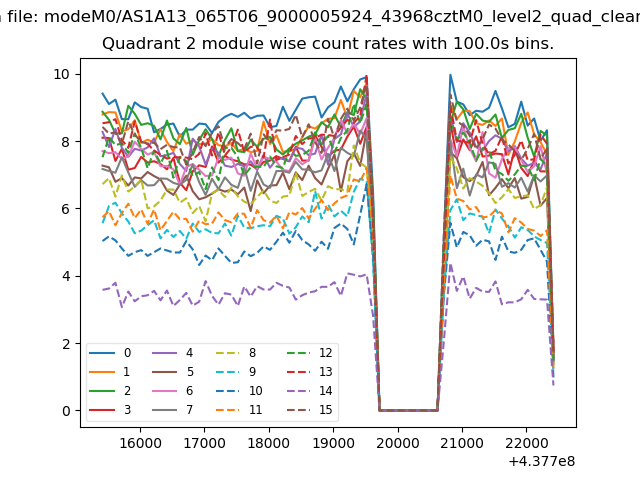
| Module-wise count rates for Quadrant B Data is divided into 100 sec bins |
 |
 |
| Module-wise count rates for Quadrant C Data is divided into 100 sec bins |
 |
 |
| Module-wise count rates for Quadrant D Data is divided into 100 sec bins |
 |
 |
| Parameter | Plot |
|---|---|
| CZT HV Monitor | 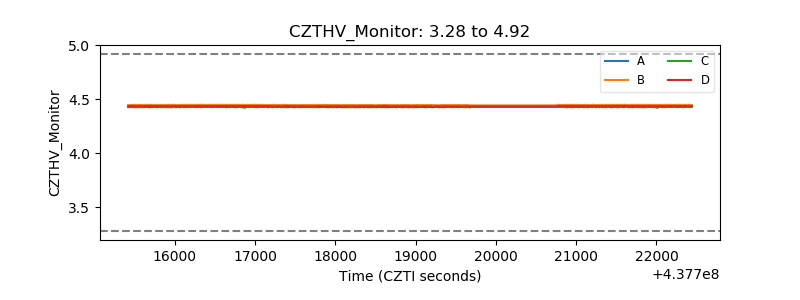 |
| D_VDD | 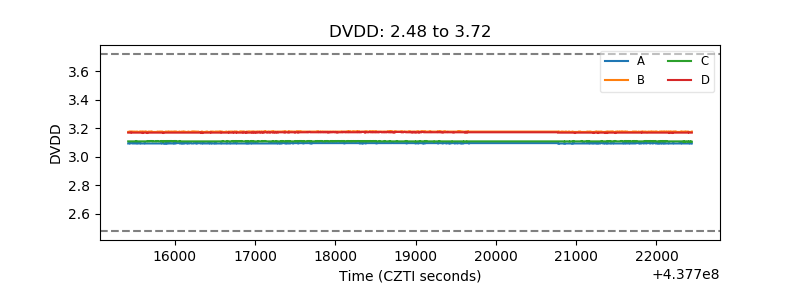 |
| Temperature 1 | 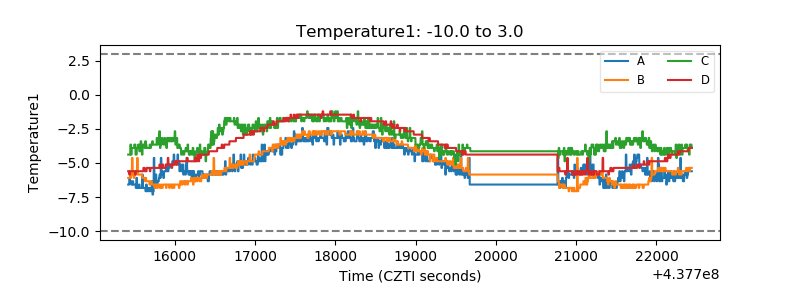 |
| Veto HV Monitor | 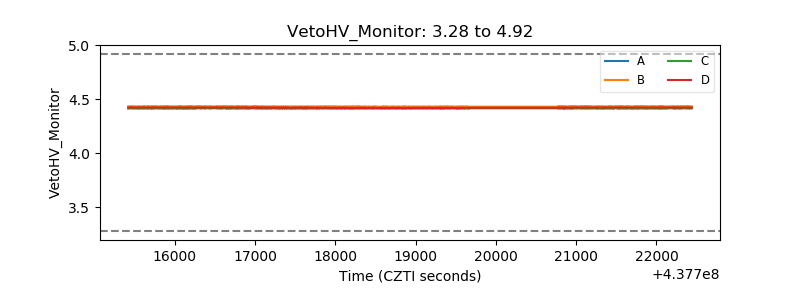 |
| Veto LLD | 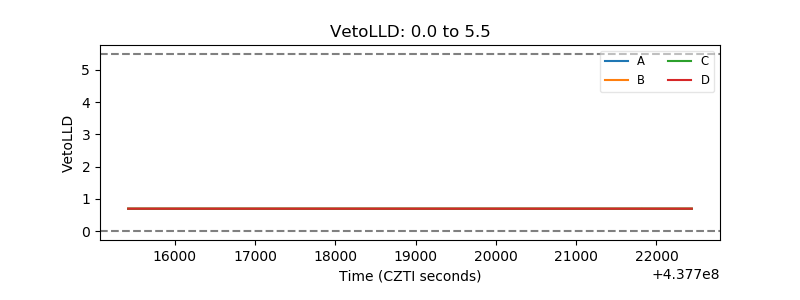 |
| Alpha Counter | 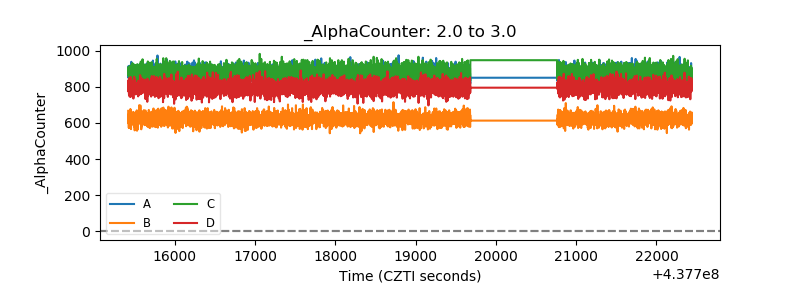 |
| _CPM_Rate | 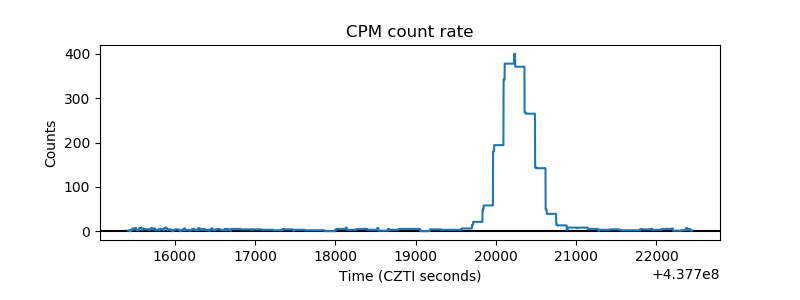 |
| CZT Counter | 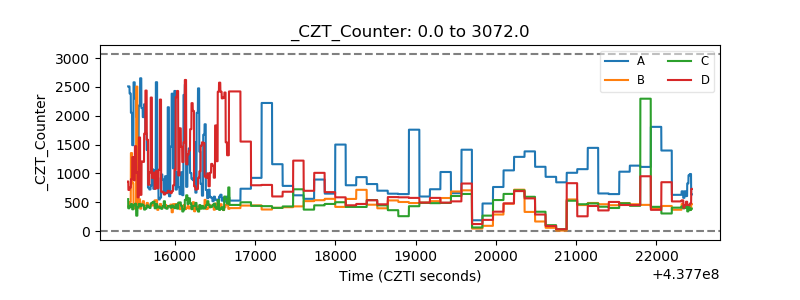 |
| +2.5 Volts monitor | 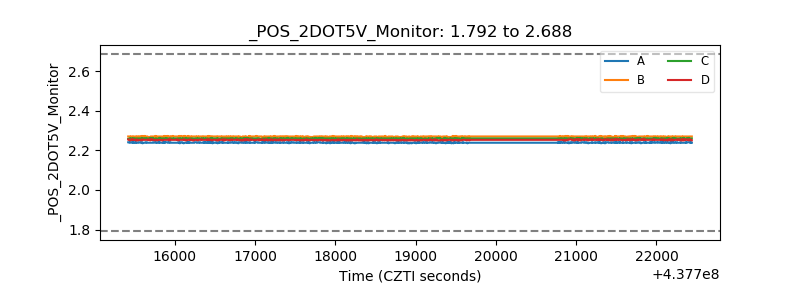 |
| +5 Volts monitor | 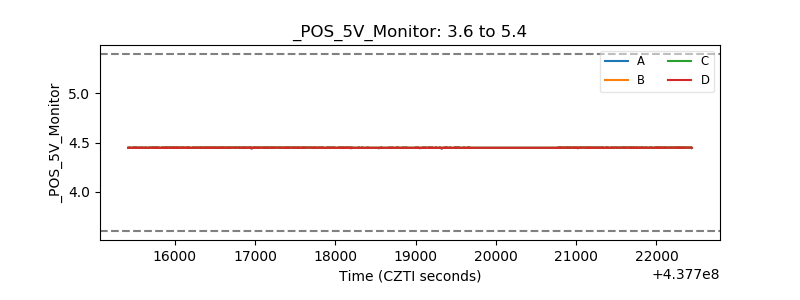 |
| _ROLL_ROT | 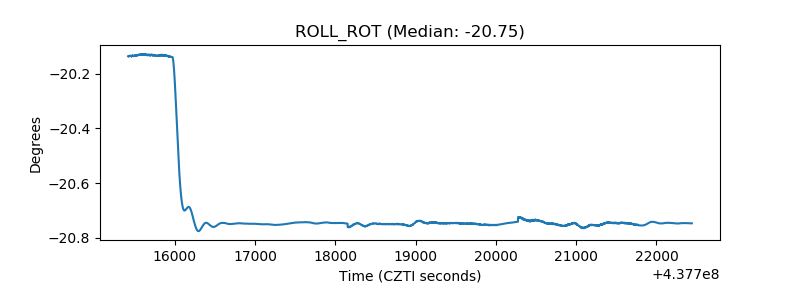 |
| _Roll_DEC | 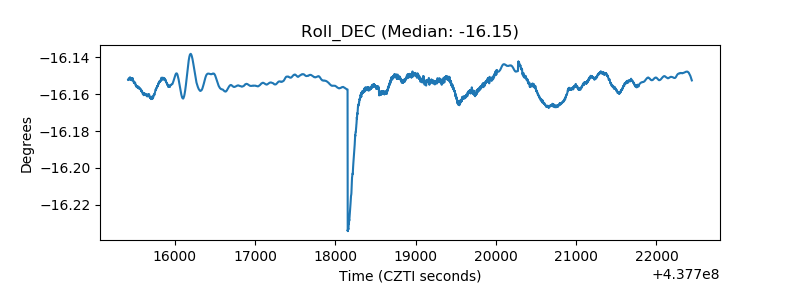 |
| _Roll_RA | 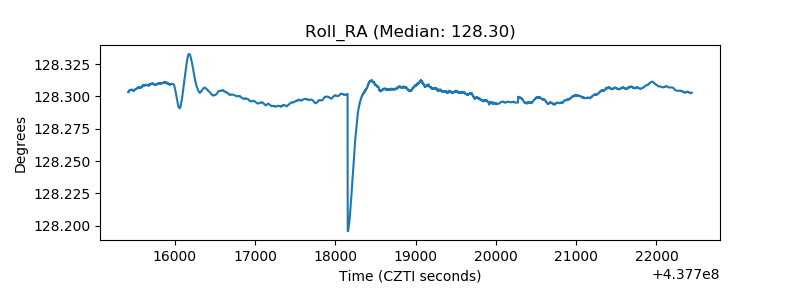 |
| Veto Counter | 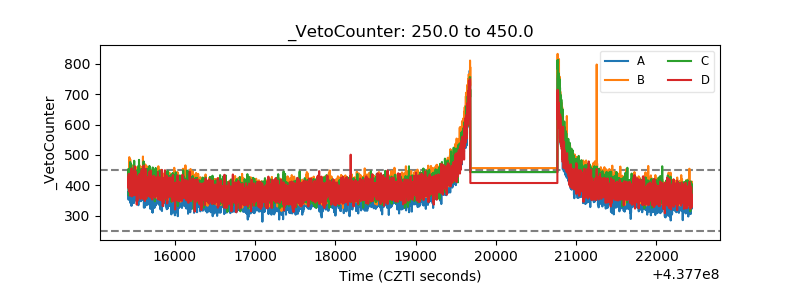 |