| Param | Original file | Final file |
|---|---|---|
| Filename | modeM0/AS1A13_065T06_9000005924_43969cztM0_level2.fits | modeM0/AS1A13_065T06_9000005924_43969cztM0_level2_quad_clean.evt |
| Size (bytes) | 298,676,160 | 66,715,200 |
| Size | 284.8 MB | 63.6 MB |
| Events in quadrant A | 4,100,209 | 426,726 |
| Events in quadrant B | 2,032,409 | 461,211 |
| Events in quadrant C | 2,059,864 | 444,688 |
| Events in quadrant D | 2,548,769 | 403,078 |
| Mode SS | |||
|---|---|---|---|
| Quadrant | BADHDUFLAG | Total packets | Discarded packets |
| A | 0 | 84 | 0 |
| B | 0 | 85 | 1 |
| C | 0 | 84 | 0 |
| D | 0 | 84 | 0 |
| Mode M9 | |||
|---|---|---|---|
| Quadrant | BADHDUFLAG | Total packets | Discarded packets |
| A | 0 | 10 | 1 |
| B | 0 | 10 | 1 |
| C | 0 | 9 | 0 |
| D | 0 | 9 | 0 |
| Mode M0 | |||
|---|---|---|---|
| Quadrant | BADHDUFLAG | Total packets | Discarded packets |
| A | 0 | 15503 | 172 |
| B | 0 | 8826 | 122 |
| C | 0 | 8949 | 102 |
| D | 0 | 10398 | 123 |
| Quadrant | Total seconds | Saturated seconds | Saturation percentage |
|---|---|---|---|
| A | 4028 | 418 | 10.377358% |
| B | 4036 | 123 | 3.047572% |
| C | 4039 | 72 | 1.782619% |
| D | 4035 | 179 | 4.436183% |
Noise dominated data is calculated using 1-second bins in cleaned event files. If a bin has >2000 counts, and if more than 50% of those come from <1% of pixels, then it is considered to be noise-dominated and hence unusable.
| Quadrant | # 1 sec bins | Bins with >0 counts | Bins with >2000 counts | High rate bins dominated by noise | Noise dominated (total time) | Noise dominated (detector-on time) | Marked lightcurve |
|---|---|---|---|---|---|---|---|
| A | 7487 | 4041 | 222 | 222 | 2.97% | 5.49% | 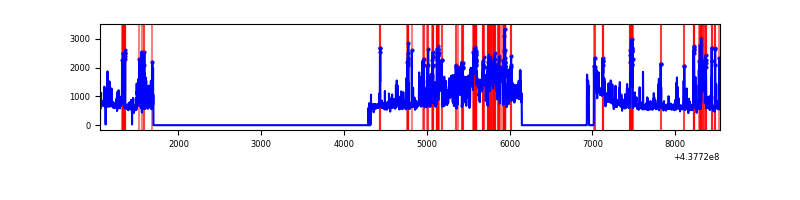 |
| B | 7488 | 4043 | 3 | 3 | 0.04% | 0.07% | 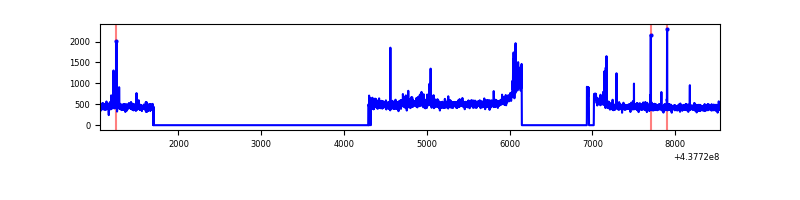 |
| C | 7488 | 4050 | 8 | 8 | 0.11% | 0.20% | 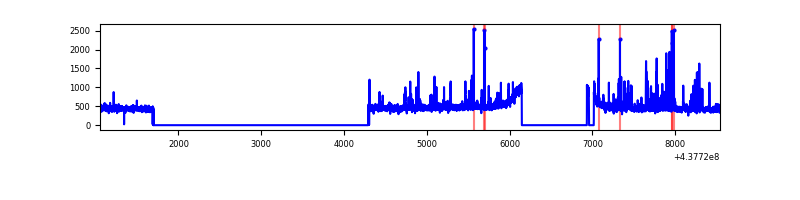 |
| D | 7488 | 4046 | 90 | 90 | 1.20% | 2.22% | 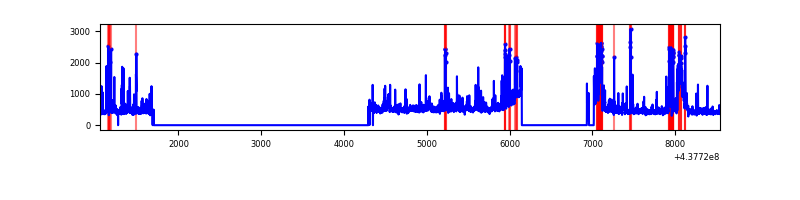 |
Top three noisy pixels from each quadrant. If the there are fewer than three noisy pixels in the level2.evt file, extra rows are filled as -1
| Pixel properties | Quadrant properties | ||||||
|---|---|---|---|---|---|---|---|
| Quadrant | DetID | PixID | Counts | Sigma | Mean | Median | Sigma |
| A | 15 | 223 | 1137531 | 11631.08 | 464 | 453 | 97.8 |
| A | 10 | 83 | 691781 | 7071.54 | 464 | 453 | 97.8 |
| A | 14 | 238 | 448459 | 4582.62 | 464 | 453 | 97.8 |
| B | 0 | 213 | 62434 | 633.96 | 479 | 464 | 97.8 |
| B | 5 | 172 | 31933 | 321.93 | 479 | 464 | 97.8 |
| B | 0 | 183 | 21445 | 214.64 | 479 | 464 | 97.8 |
| C | 14 | 254 | 148521 | 1299.49 | 476 | 479 | 113.9 |
| C | 15 | 157 | 26807 | 231.1 | 476 | 479 | 113.9 |
| C | 3 | 233 | 15988 | 136.14 | 476 | 479 | 113.9 |
| D | 7 | 204 | 166667 | 1378.15 | 470 | 455 | 120.6 |
| D | 5 | 235 | 135831 | 1122.47 | 470 | 455 | 120.6 |
| D | 4 | 222 | 103632 | 855.49 | 470 | 455 | 120.6 |
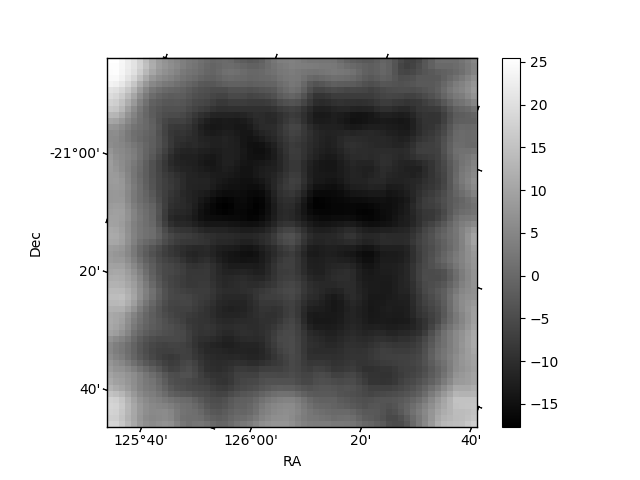
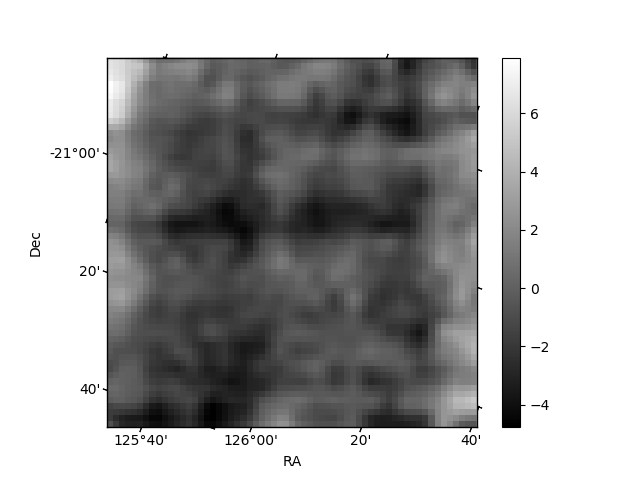
Histogram calculated using DETX and DETY for each event in the final _common_clean file
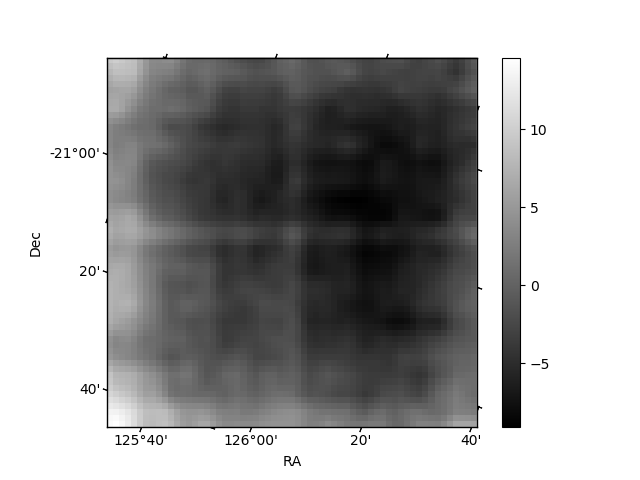
| Quadrant A | 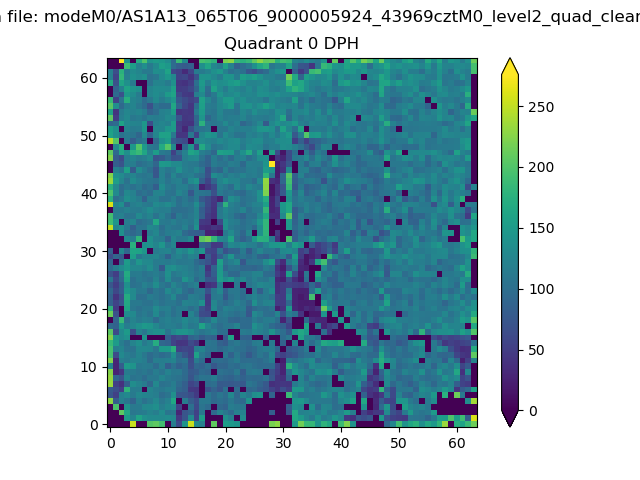 |
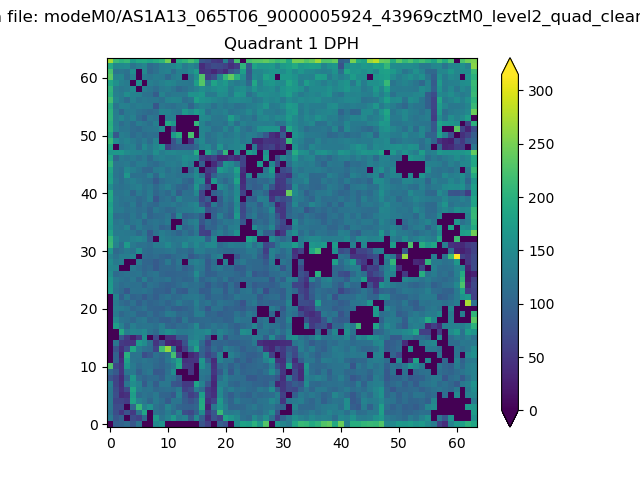 |
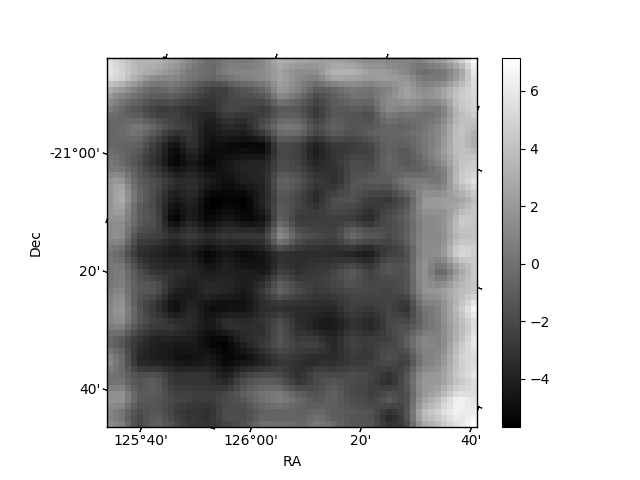
Quadrant B |
|---|---|---|---|
| Quadrant D | 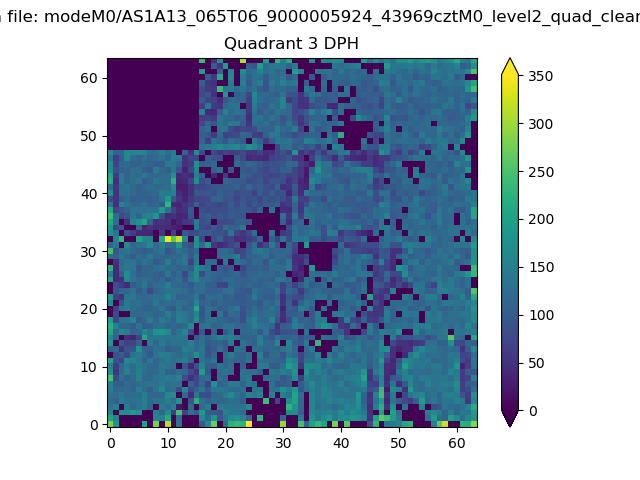 |
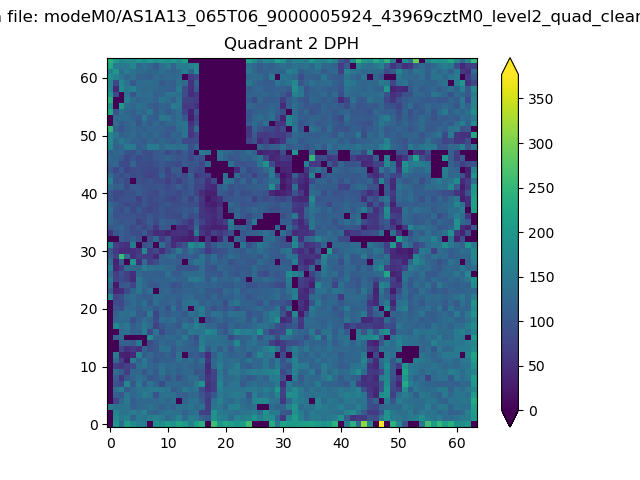 |
Quadrant C |
| Plot type | Count rate plots | Images |
|---|---|---|
| Comparison with Poisson distribution Blue bars denote a histogram of data divided into 1 sec bins. Red curve is a Poisson curve with rate = median count rate of data. |
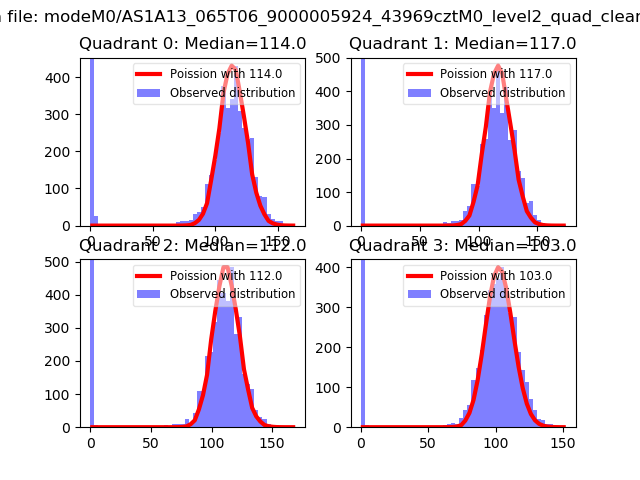 |
 |
| Quadrant-wise count rates Data is divided into 100 sec bins |
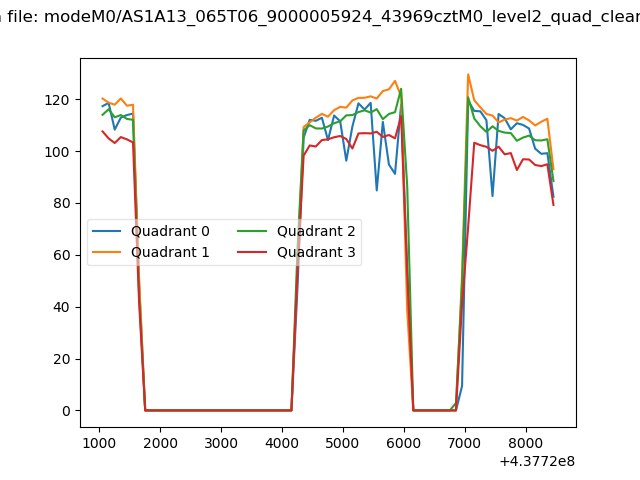 |
|
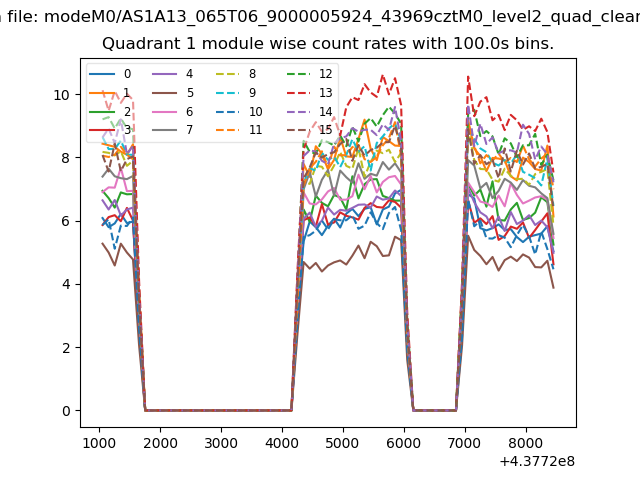
| Module-wise count rates for Quadrant A Data is divided into 100 sec bins |
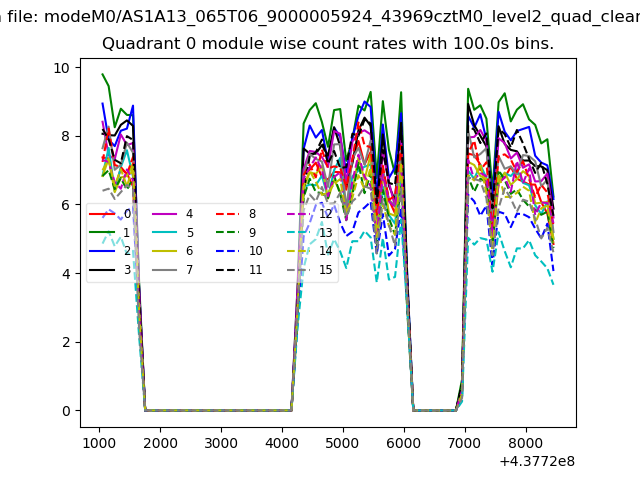 |
 |
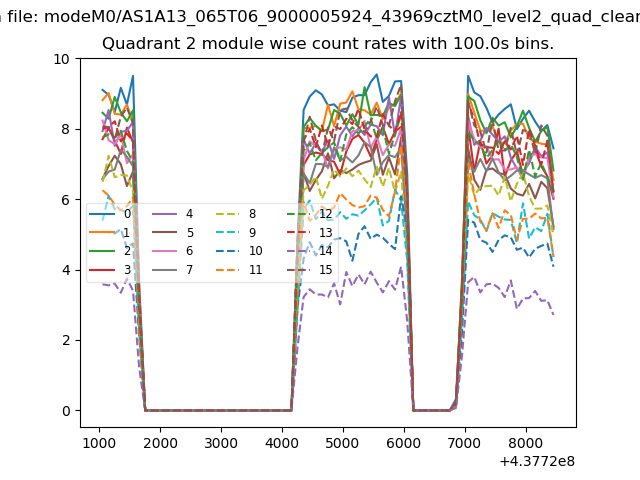
| Module-wise count rates for Quadrant B Data is divided into 100 sec bins |
 |
 |
| Module-wise count rates for Quadrant C Data is divided into 100 sec bins |
 |
 |
| Module-wise count rates for Quadrant D Data is divided into 100 sec bins |
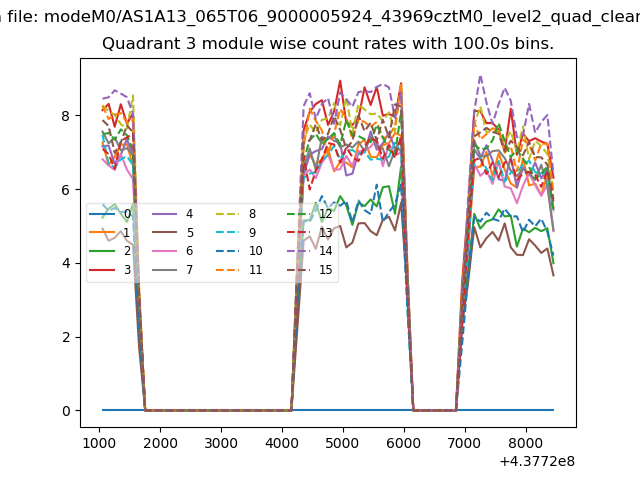 |
 |
| Parameter | Plot |
|---|---|
| CZT HV Monitor | 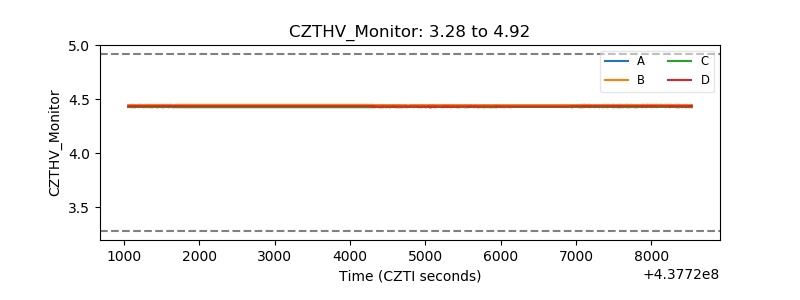 |
| D_VDD | 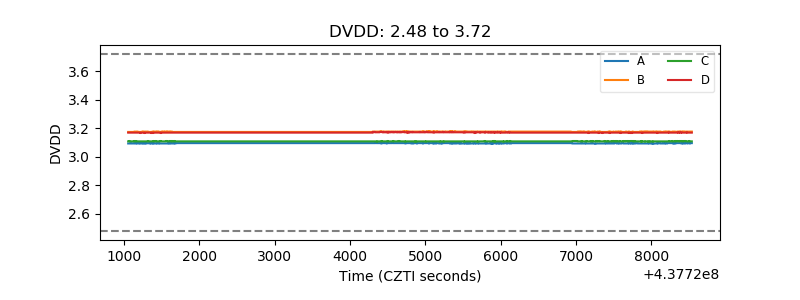 |
| Temperature 1 | 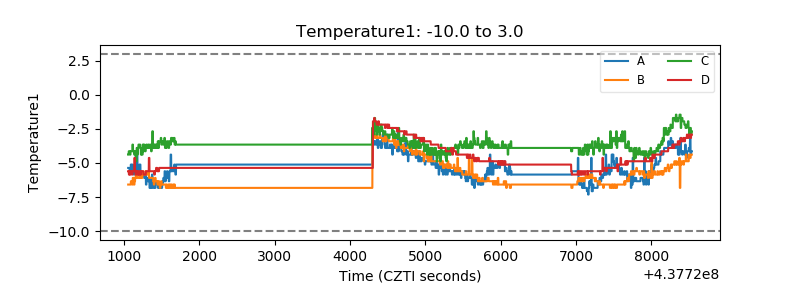 |
| Veto HV Monitor | 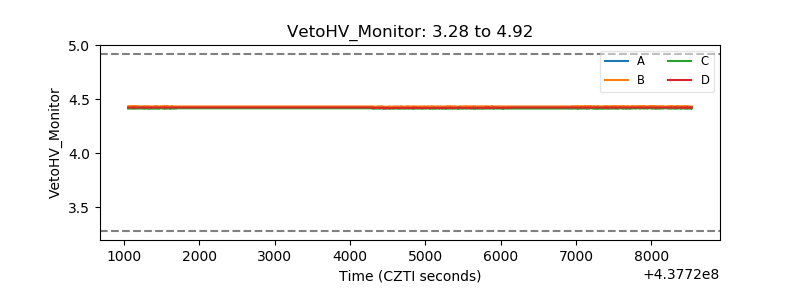 |
| Veto LLD | 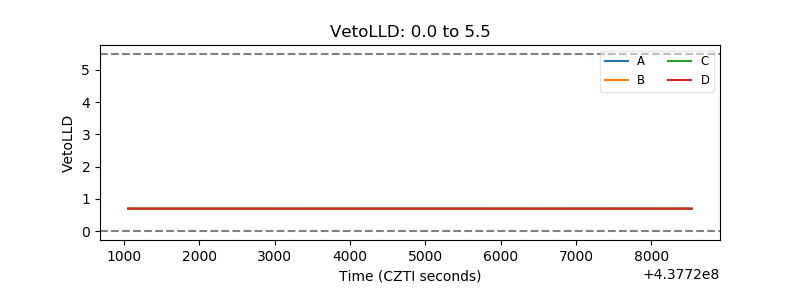 |
| Alpha Counter | 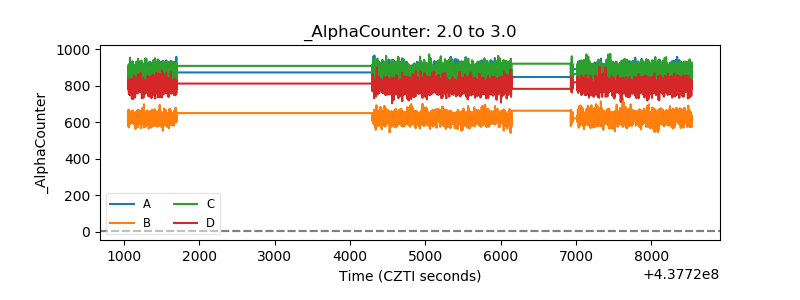 |
| _CPM_Rate | 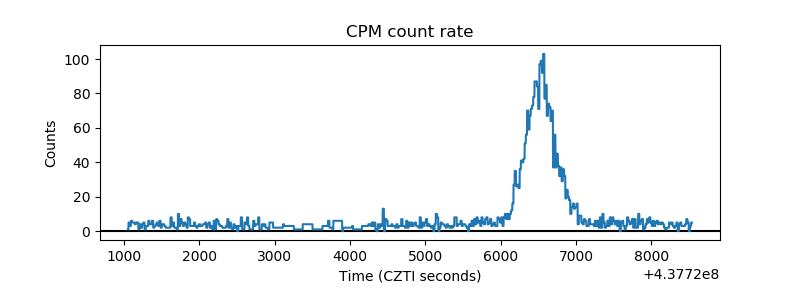 |
| CZT Counter | 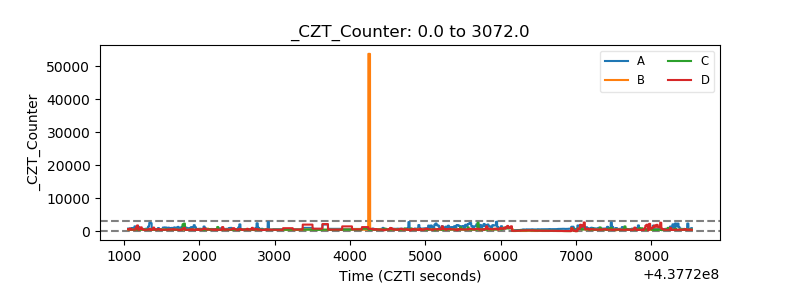 |
| +2.5 Volts monitor | 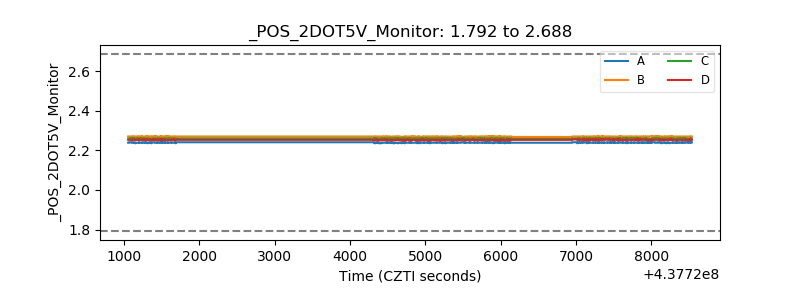 |
| +5 Volts monitor | 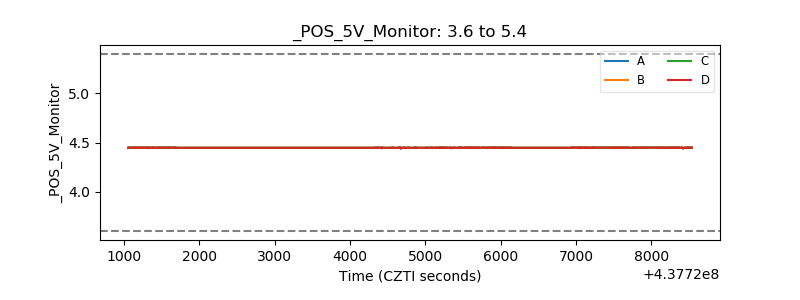 |
| _ROLL_ROT |  |
| _Roll_DEC |  |
| _Roll_RA | 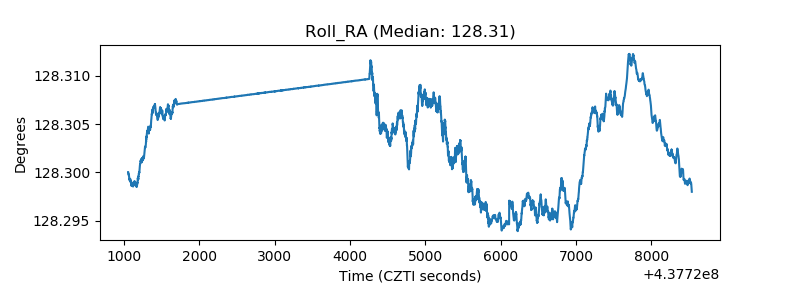 |
| Veto Counter |  |