| Param | Original file | Final file |
|---|---|---|
| Filename | modeM0/AS1A13_065T06_9000005924_43970cztM0_level2.fits | modeM0/AS1A13_065T06_9000005924_43970cztM0_level2_quad_clean.evt |
| Size (bytes) | 504,374,400 | 112,564,800 |
| Size | 481.0 MB | 107.4 MB |
| Events in quadrant A | 6,537,315 | 712,570 |
| Events in quadrant B | 3,534,549 | 776,373 |
| Events in quadrant C | 3,667,739 | 746,360 |
| Events in quadrant D | 4,376,272 | 676,310 |
| Mode SS | |||
|---|---|---|---|
| Quadrant | BADHDUFLAG | Total packets | Discarded packets |
| A | 0 | 146 | 0 |
| B | 0 | 146 | 0 |
| C | 0 | 146 | 0 |
| D | 0 | 146 | 0 |
| Mode M9 | |||
|---|---|---|---|
| Quadrant | BADHDUFLAG | Total packets | Discarded packets |
| A | 0 | 3 | 0 |
| B | 0 | 3 | 0 |
| C | 0 | 3 | 0 |
| D | 0 | 3 | 0 |
| Mode M0 | |||
|---|---|---|---|
| Quadrant | BADHDUFLAG | Total packets | Discarded packets |
| A | 0 | 25017 | 7 |
| B | 0 | 15404 | 2 |
| C | 0 | 15944 | 5 |
| D | 0 | 17756 | 7 |
| Quadrant | Total seconds | Saturated seconds | Saturation percentage |
|---|---|---|---|
| A | 7134 | 706 | 9.896271% |
| B | 7136 | 260 | 3.643498% |
| C | 7135 | 226 | 3.167484% |
| D | 7135 | 301 | 4.218641% |
Noise dominated data is calculated using 1-second bins in cleaned event files. If a bin has >2000 counts, and if more than 50% of those come from <1% of pixels, then it is considered to be noise-dominated and hence unusable.
| Quadrant | # 1 sec bins | Bins with >0 counts | Bins with >2000 counts | High rate bins dominated by noise | Noise dominated (total time) | Noise dominated (detector-on time) | Marked lightcurve |
|---|---|---|---|---|---|---|---|
| A | 7421 | 7138 | 385 | 385 | 5.19% | 5.39% | 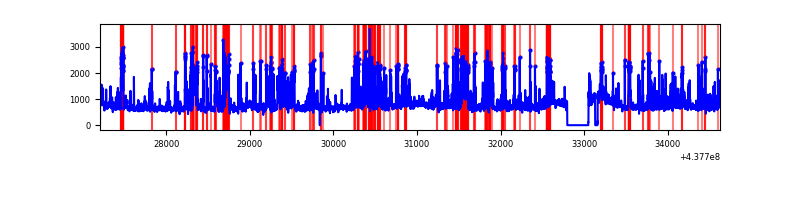 |
| B | 7421 | 7139 | 36 | 36 | 0.49% | 0.50% | 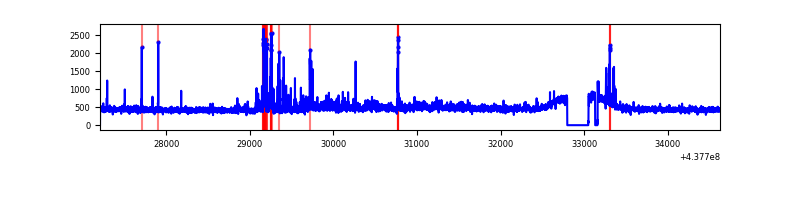 |
| C | 7422 | 7139 | 33 | 33 | 0.44% | 0.46% | 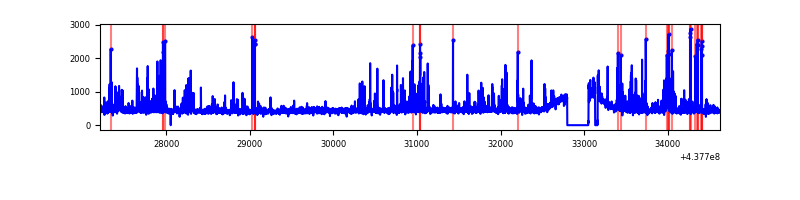 |
| D | 7422 | 7139 | 133 | 133 | 1.79% | 1.86% | 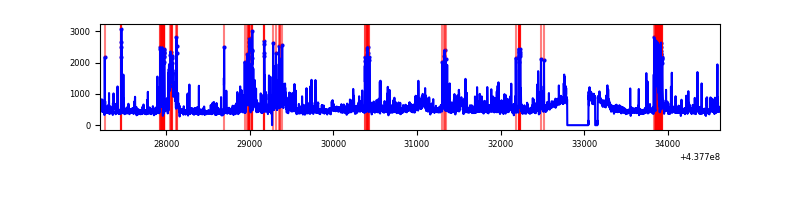 |
Top three noisy pixels from each quadrant. If the there are fewer than three noisy pixels in the level2.evt file, extra rows are filled as -1
| Pixel properties | Quadrant properties | ||||||
|---|---|---|---|---|---|---|---|
| Quadrant | DetID | PixID | Counts | Sigma | Mean | Median | Sigma |
| A | 15 | 223 | 1291803 | 7695.01 | 795 | 775 | 167.8 |
| A | 10 | 83 | 1089902 | 6491.61 | 795 | 775 | 167.8 |
| A | 14 | 238 | 981995 | 5848.44 | 795 | 775 | 167.8 |
| B | 5 | 172 | 168549 | 1029.33 | 812 | 784 | 163.0 |
| B | 0 | 213 | 54347 | 328.64 | 812 | 784 | 163.0 |
| B | 0 | 183 | 52926 | 319.92 | 812 | 784 | 163.0 |
| C | 14 | 254 | 359671 | 1876.95 | 807 | 809 | 191.2 |
| C | 15 | 157 | 115490 | 599.81 | 807 | 809 | 191.2 |
| C | 12 | 16 | 24281 | 122.77 | 807 | 809 | 191.2 |
| D | 7 | 204 | 167143 | 810.35 | 805 | 781 | 205.3 |
| D | 13 | 249 | 159707 | 774.13 | 805 | 781 | 205.3 |
| D | 4 | 222 | 148737 | 720.69 | 805 | 781 | 205.3 |
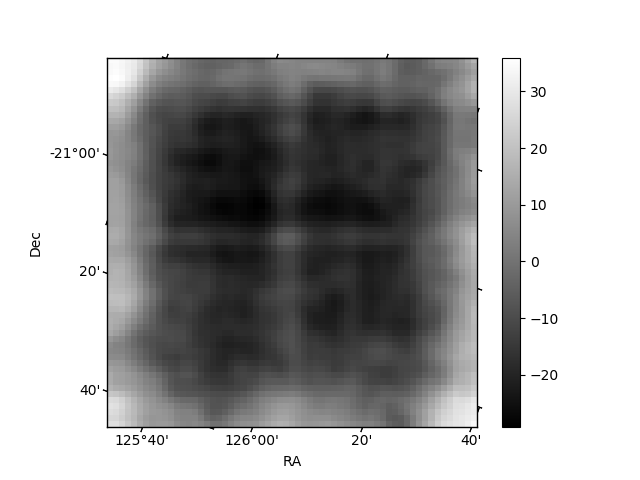
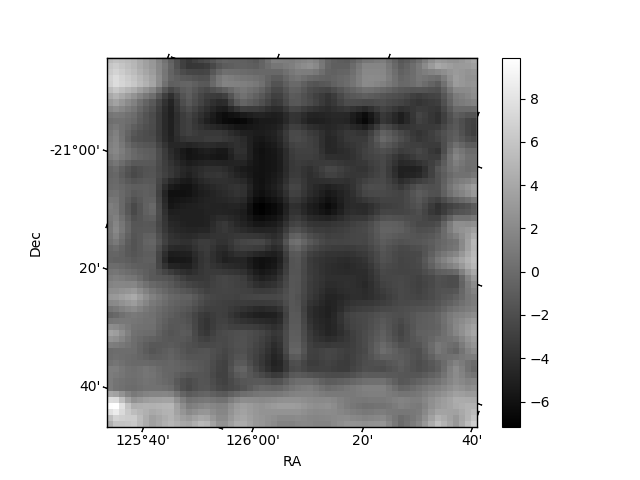
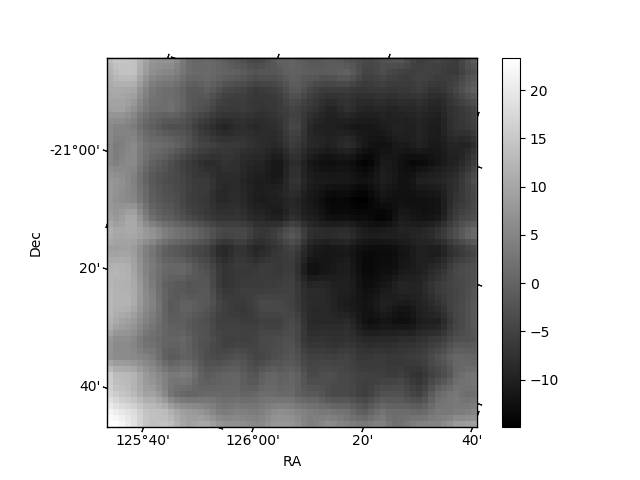
Histogram calculated using DETX and DETY for each event in the final _common_clean file
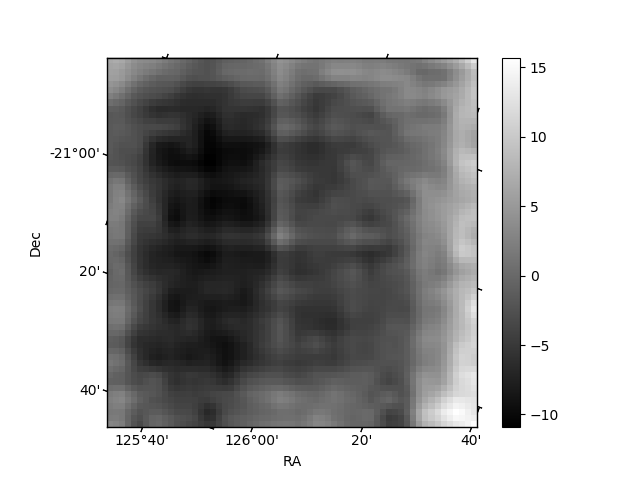
| Quadrant A | 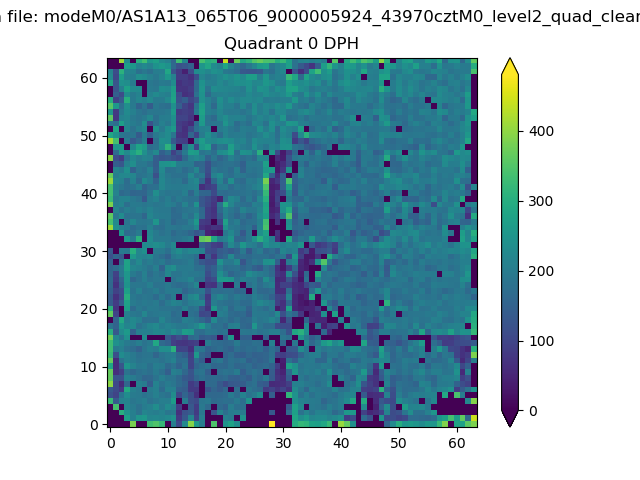 |
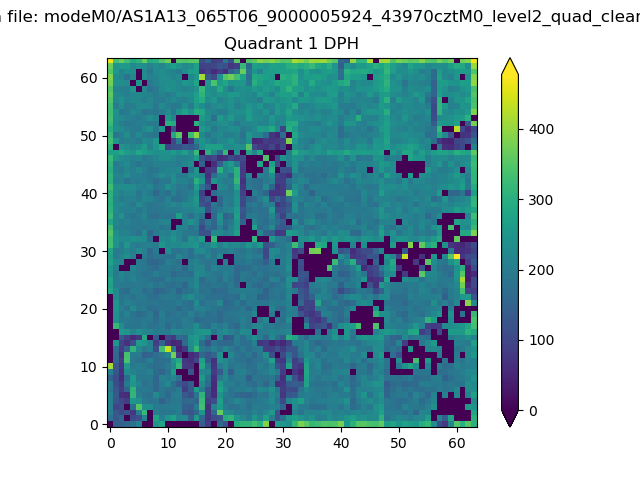 |
Quadrant B |
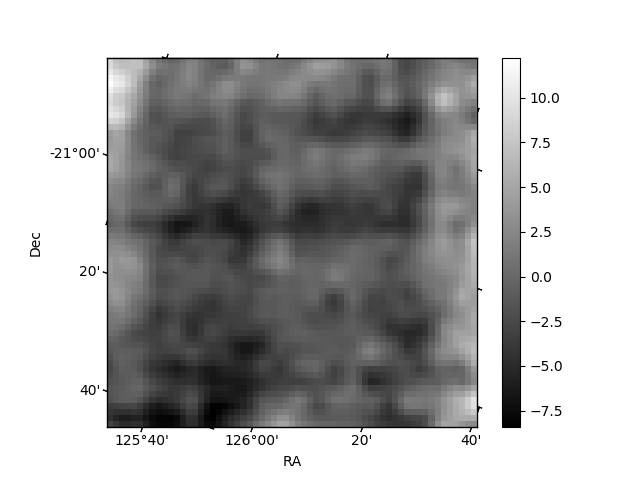
|---|---|---|---|
| Quadrant D | 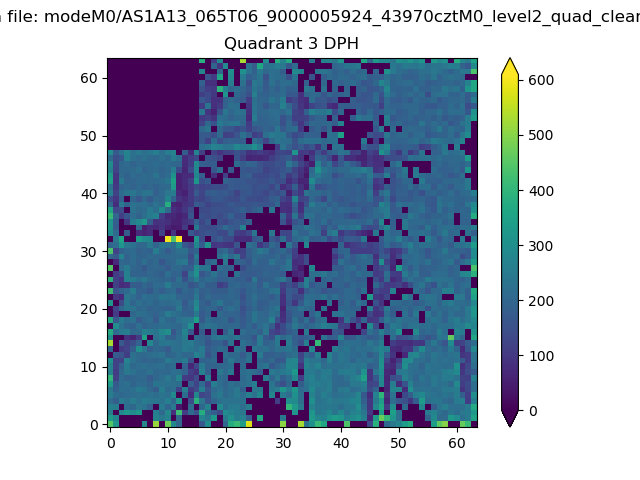 |
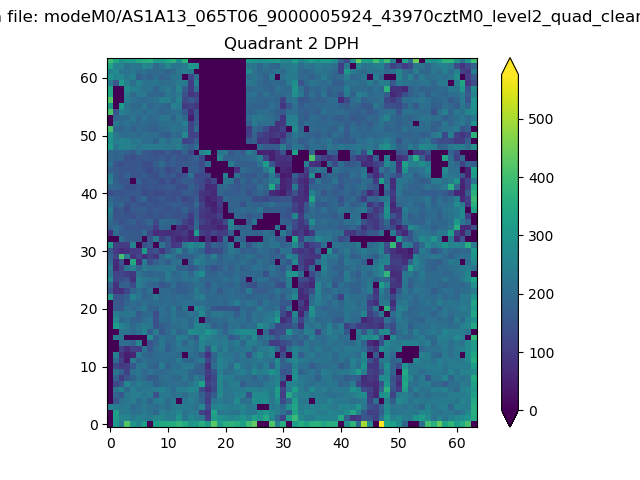 |
Quadrant C |
| Plot type | Count rate plots | Images |
|---|---|---|
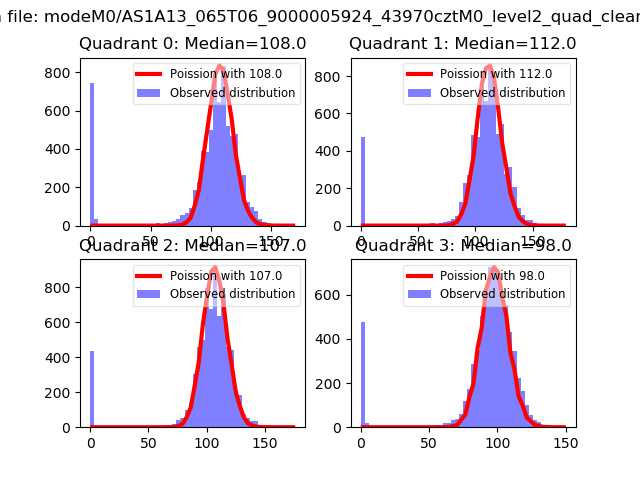
| Comparison with Poisson distribution Blue bars denote a histogram of data divided into 1 sec bins. Red curve is a Poisson curve with rate = median count rate of data. |
 |
 |
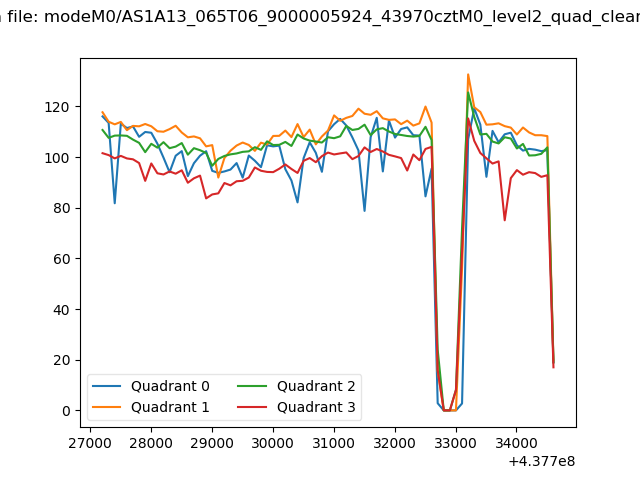
| Quadrant-wise count rates Data is divided into 100 sec bins |
 |
|
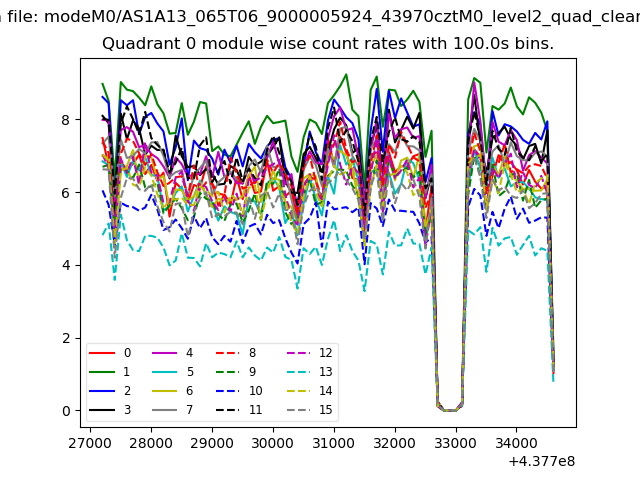
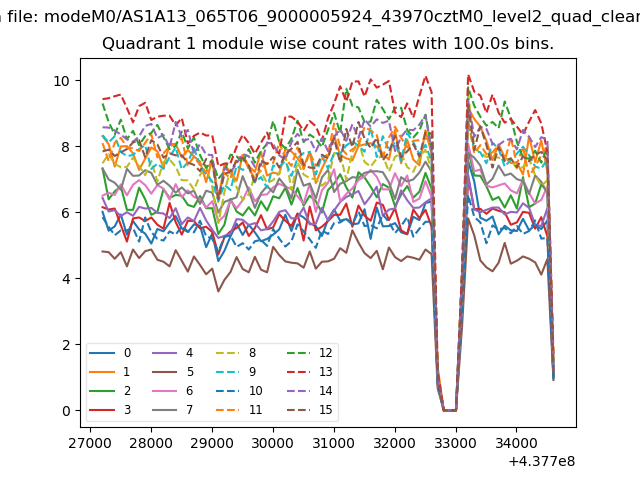
| Module-wise count rates for Quadrant A Data is divided into 100 sec bins |
 |
 |
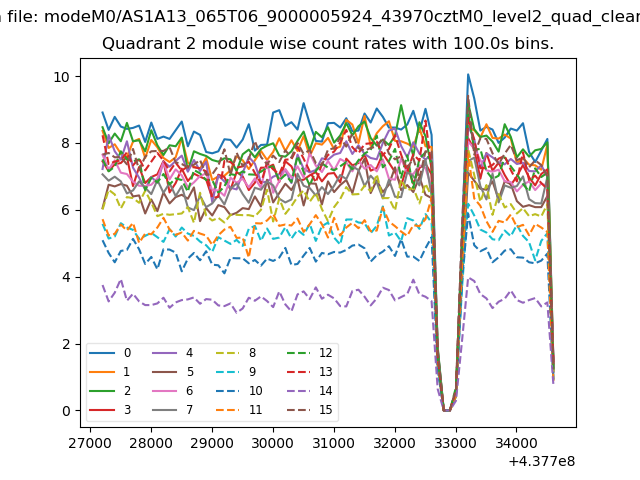
| Module-wise count rates for Quadrant B Data is divided into 100 sec bins |
 |
 |
| Module-wise count rates for Quadrant C Data is divided into 100 sec bins |
 |
 |
| Module-wise count rates for Quadrant D Data is divided into 100 sec bins |
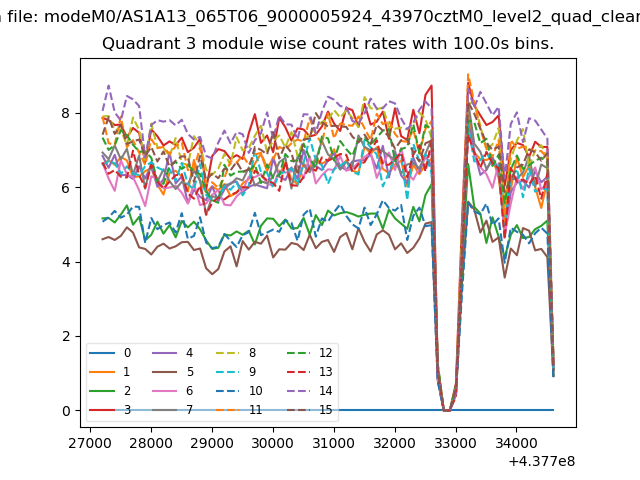 |
 |
| Parameter | Plot |
|---|---|
| CZT HV Monitor | 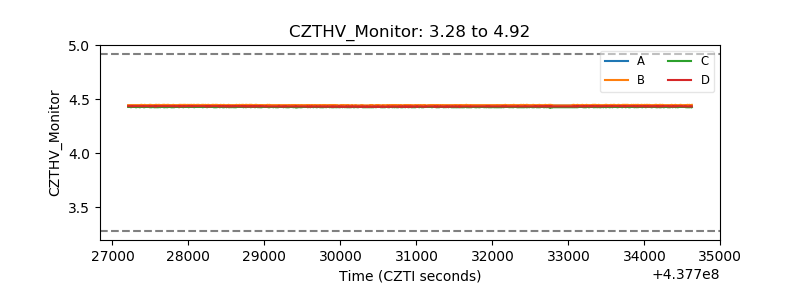 |
| D_VDD | 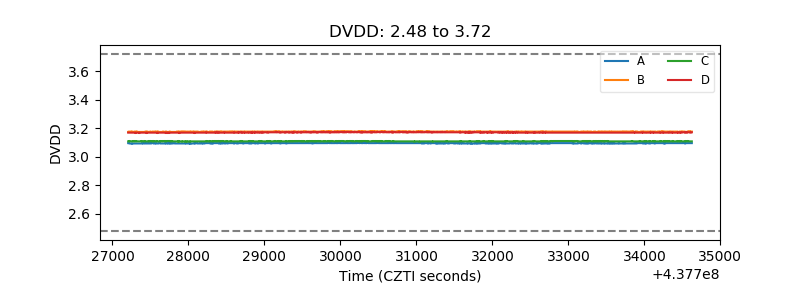 |
| Temperature 1 | 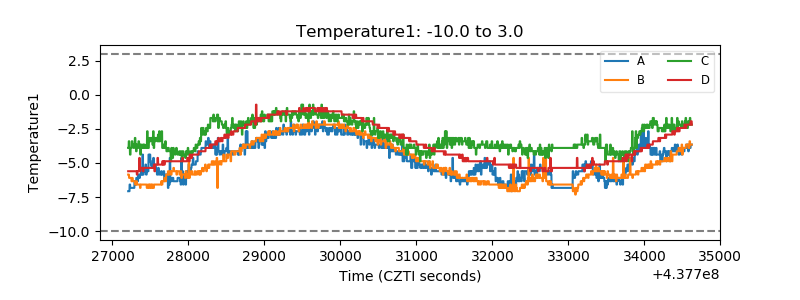 |
| Veto HV Monitor | 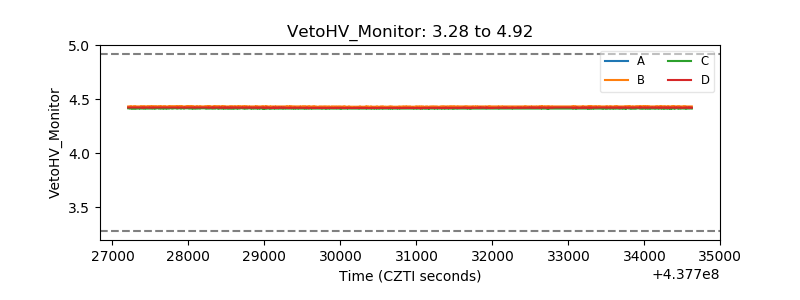 |
| Veto LLD | 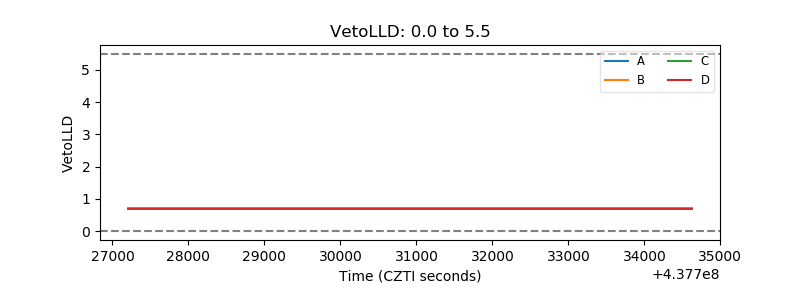 |
| Alpha Counter | 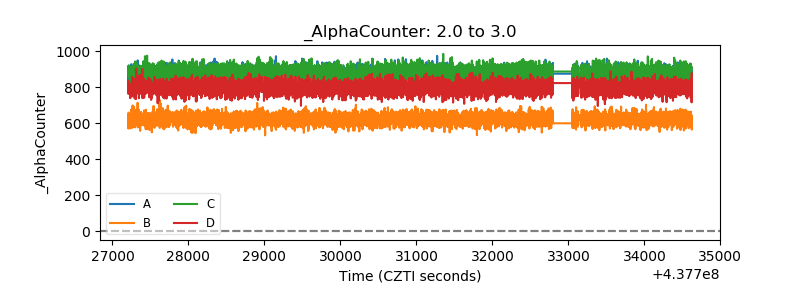 |
| _CPM_Rate | 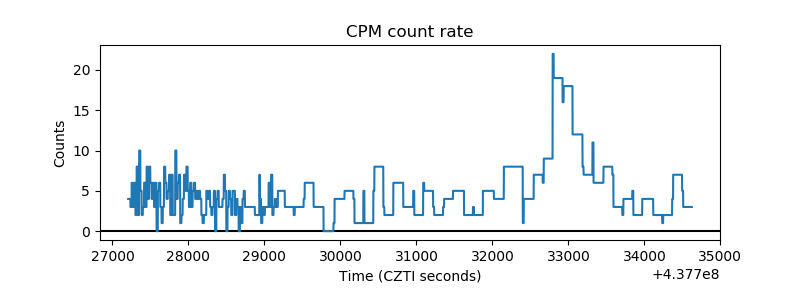 |
| CZT Counter | 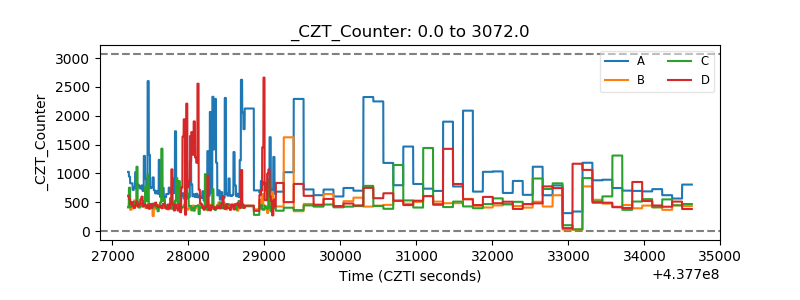 |
| +2.5 Volts monitor |  |
| +5 Volts monitor | 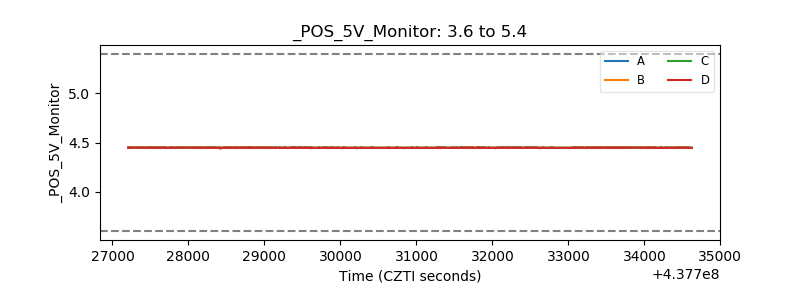 |
| _ROLL_ROT | 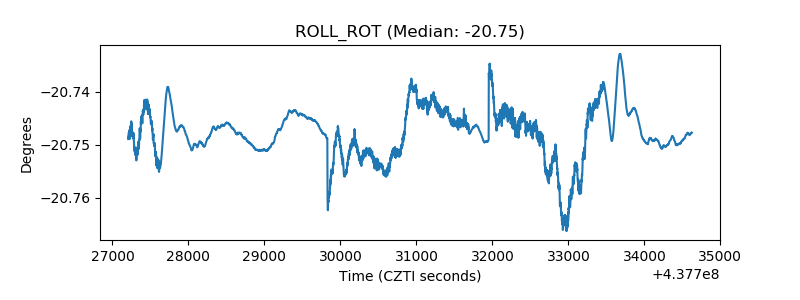 |
| _Roll_DEC | 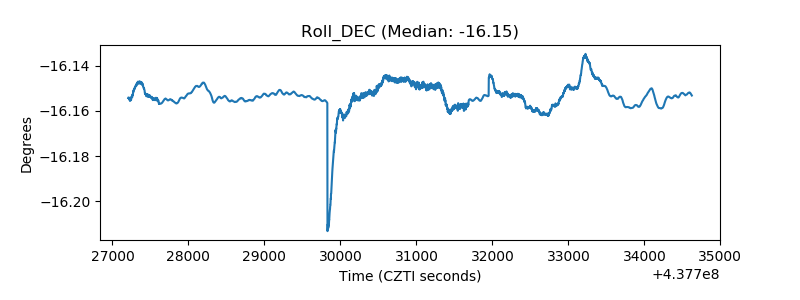 |
| _Roll_RA | 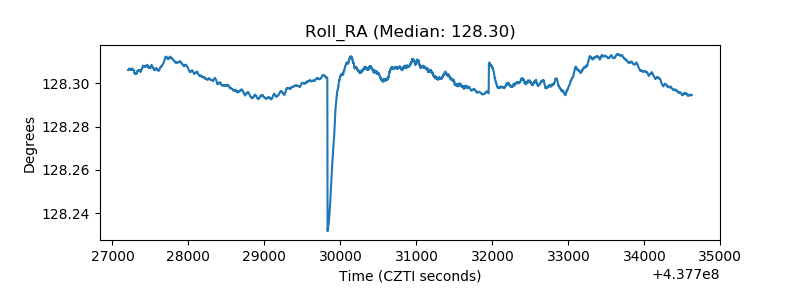 |
| Veto Counter | 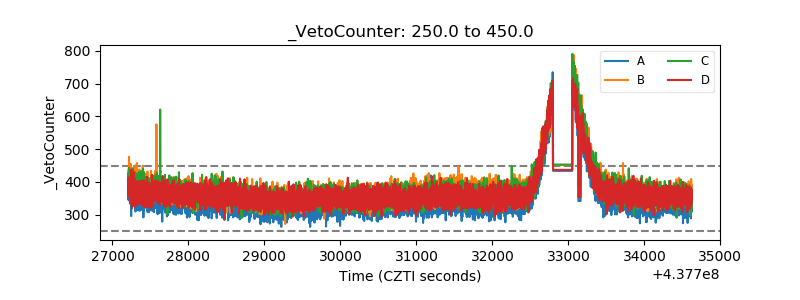 |