| Param | Original file | Final file |
|---|---|---|
| Filename | modeM0/AS1A13_065T06_9000005924_43971cztM0_level2.fits | modeM0/AS1A13_065T06_9000005924_43971cztM0_level2_quad_clean.evt |
| Size (bytes) | 1,374,854,400 | 296,398,080 |
| Size | 1.3 GB | 282.7 MB |
| Events in quadrant A | 17,175,938 | 1,910,756 |
| Events in quadrant B | 9,324,384 | 2,059,115 |
| Events in quadrant C | 9,382,990 | 1,990,874 |
| Events in quadrant D | 13,554,619 | 1,716,745 |
| Mode SS | |||
|---|---|---|---|
| Quadrant | BADHDUFLAG | Total packets | Discarded packets |
| A | 0 | 384 | 0 |
| B | 0 | 384 | 0 |
| C | 0 | 384 | 0 |
| D | 0 | 384 | 0 |
| Mode M9 | |||
|---|---|---|---|
| Quadrant | BADHDUFLAG | Total packets | Discarded packets |
| A | 0 | 12 | 0 |
| B | 0 | 12 | 0 |
| C | 0 | 12 | 0 |
| D | 0 | 12 | 0 |
| Mode M0 | |||
|---|---|---|---|
| Quadrant | BADHDUFLAG | Total packets | Discarded packets |
| A | 0 | 65717 | 3 |
| B | 0 | 40567 | 3 |
| C | 0 | 41295 | 3 |
| D | 0 | 52800 | 4 |
| Quadrant | Total seconds | Saturated seconds | Saturation percentage |
|---|---|---|---|
| A | 18815 | 1562 | 8.301887% |
| B | 18815 | 450 | 2.391709% |
| C | 18816 | 363 | 1.929209% |
| D | 18815 | 1279 | 6.797768% |
Noise dominated data is calculated using 1-second bins in cleaned event files. If a bin has >2000 counts, and if more than 50% of those come from <1% of pixels, then it is considered to be noise-dominated and hence unusable.
| Quadrant | # 1 sec bins | Bins with >0 counts | Bins with >2000 counts | High rate bins dominated by noise | Noise dominated (total time) | Noise dominated (detector-on time) | Marked lightcurve |
|---|---|---|---|---|---|---|---|
| A | 19945 | 18820 | 914 | 914 | 4.58% | 4.86% | 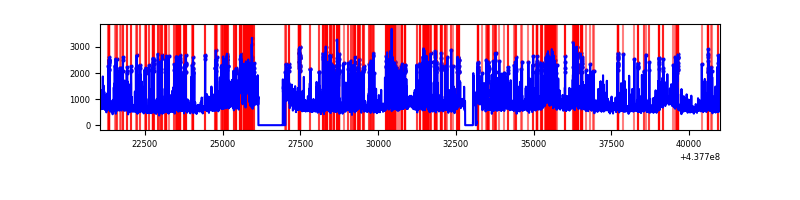 |
| B | 19945 | 18818 | 56 | 56 | 0.28% | 0.30% | 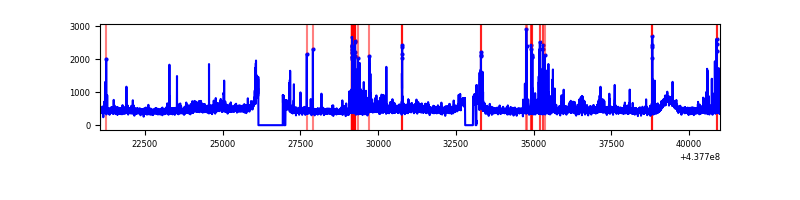 |
| C | 19946 | 18820 | 82 | 82 | 0.41% | 0.44% | 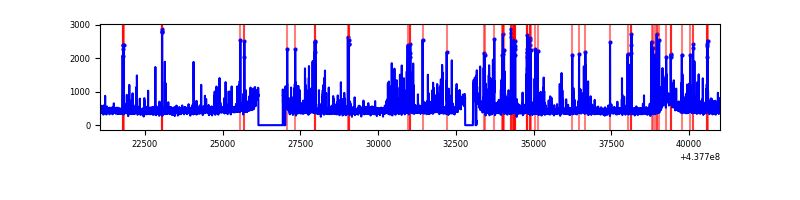 |
| D | 19945 | 18819 | 956 | 956 | 4.79% | 5.08% | 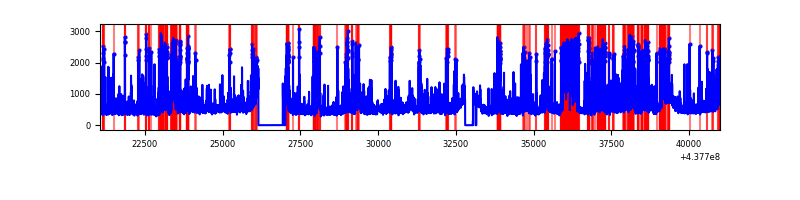 |
Top three noisy pixels from each quadrant. If the there are fewer than three noisy pixels in the level2.evt file, extra rows are filled as -1
| Pixel properties | Quadrant properties | ||||||
|---|---|---|---|---|---|---|---|
| Quadrant | DetID | PixID | Counts | Sigma | Mean | Median | Sigma |
| A | 15 | 223 | 3523379 | 8022.64 | 2116 | 2069 | 438.9 |
| A | 10 | 83 | 2860360 | 6512.07 | 2116 | 2069 | 438.9 |
| A | 14 | 238 | 2424839 | 5519.82 | 2116 | 2069 | 438.9 |
| B | 5 | 172 | 364253 | 852.92 | 2153 | 2083 | 424.6 |
| B | 0 | 213 | 142291 | 330.19 | 2153 | 2083 | 424.6 |
| B | 0 | 183 | 97654 | 225.07 | 2153 | 2083 | 424.6 |
| C | 14 | 254 | 750165 | 1492.49 | 2135 | 2144 | 501.2 |
| C | 15 | 157 | 202194 | 399.15 | 2135 | 2144 | 501.2 |
| C | 3 | 233 | 53268 | 102.01 | 2135 | 2144 | 501.2 |
| D | 5 | 235 | 1401768 | 2615.07 | 2103 | 2039 | 535.3 |
| D | 12 | 17 | 857568 | 1598.36 | 2103 | 2039 | 535.3 |
| D | 4 | 222 | 615147 | 1145.45 | 2103 | 2039 | 535.3 |
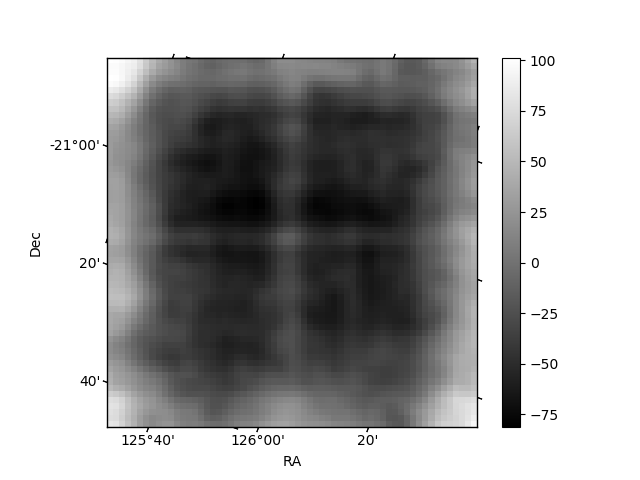
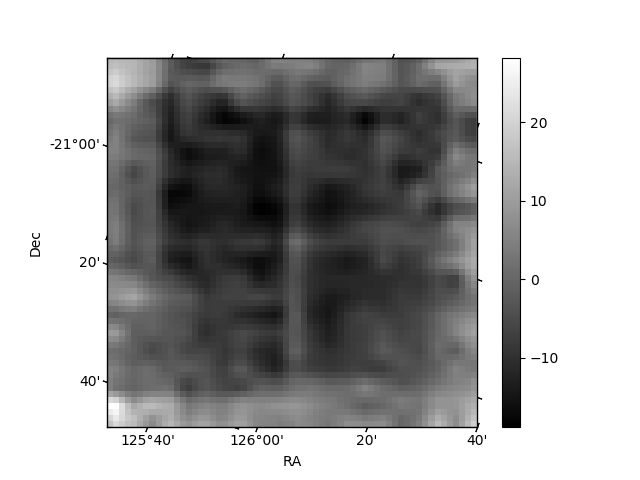
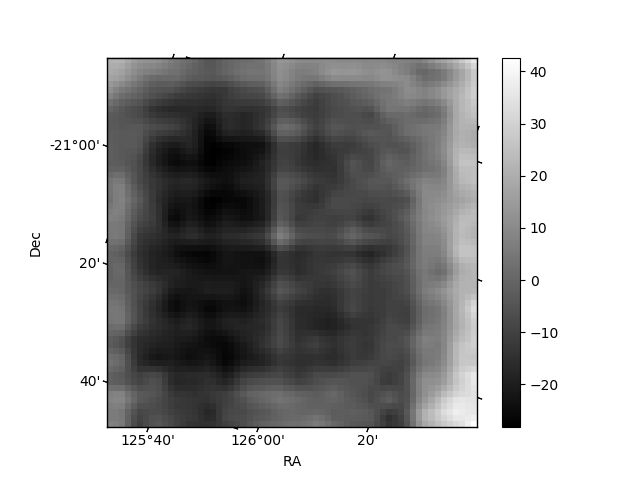
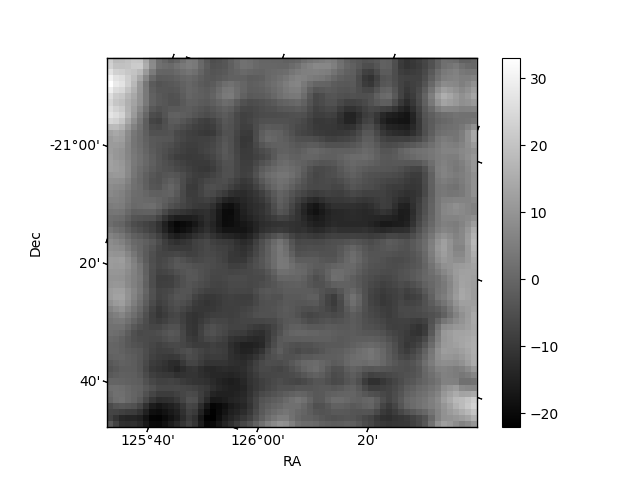
Histogram calculated using DETX and DETY for each event in the final _common_clean file
| Quadrant A | 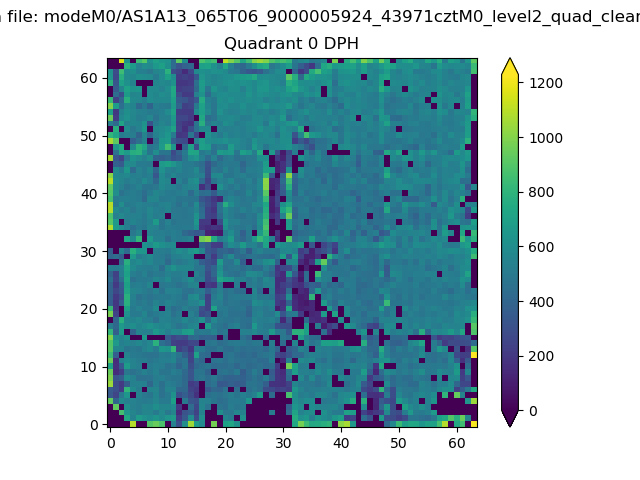 |
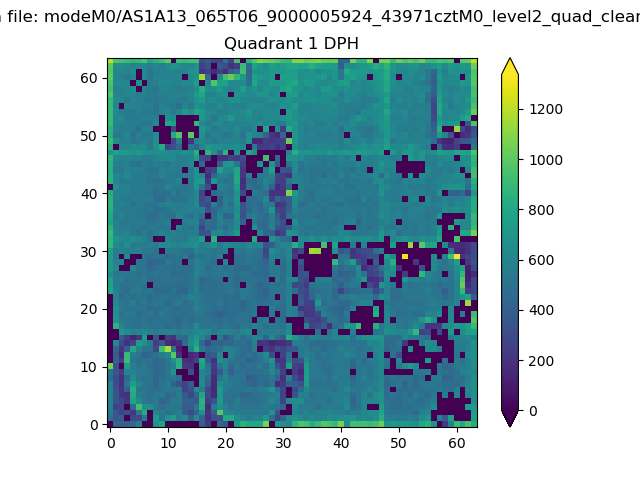 |
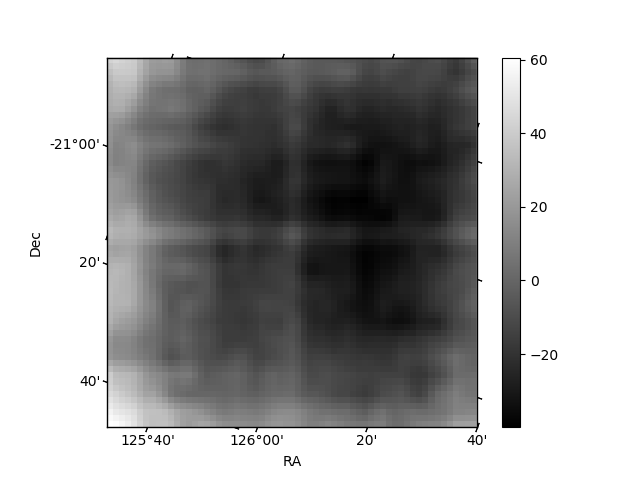
Quadrant B |
|---|---|---|---|
| Quadrant D | 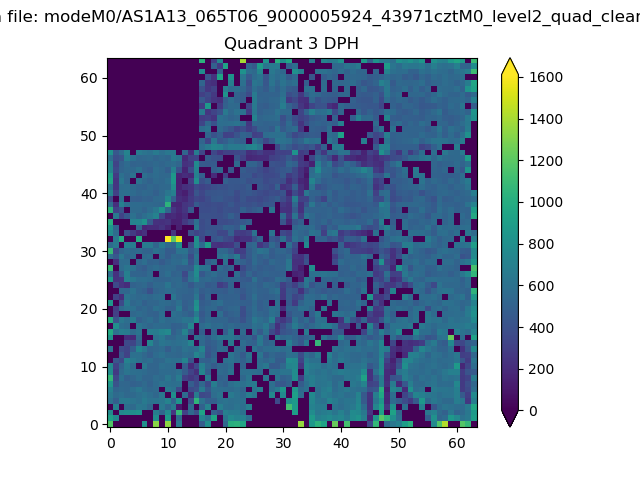 |
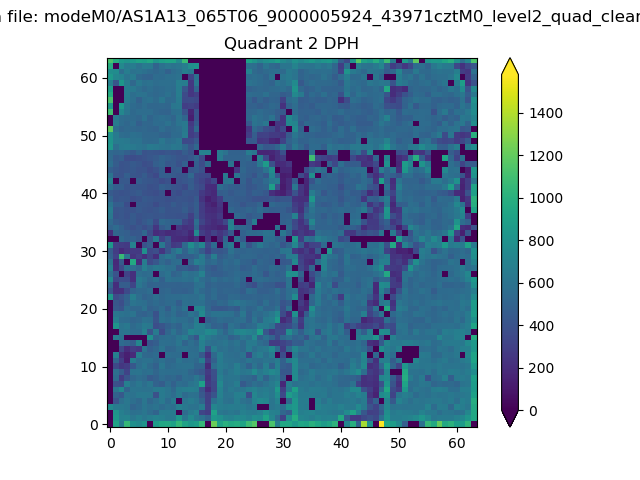 |
Quadrant C |
| Plot type | Count rate plots | Images |
|---|---|---|
| Comparison with Poisson distribution Blue bars denote a histogram of data divided into 1 sec bins. Red curve is a Poisson curve with rate = median count rate of data. |
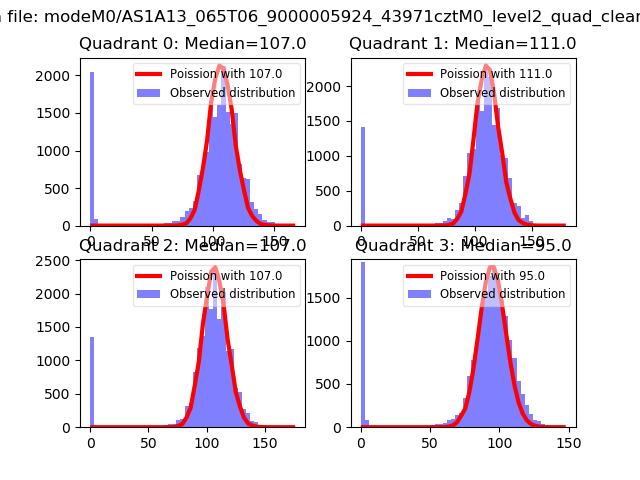 |
 |
| Quadrant-wise count rates Data is divided into 100 sec bins |
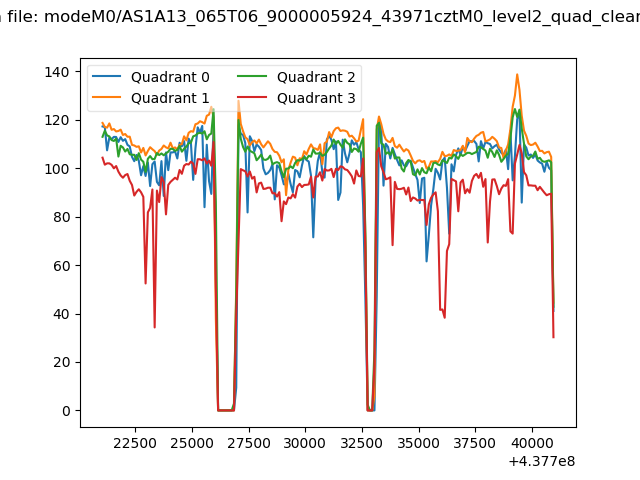 |
|
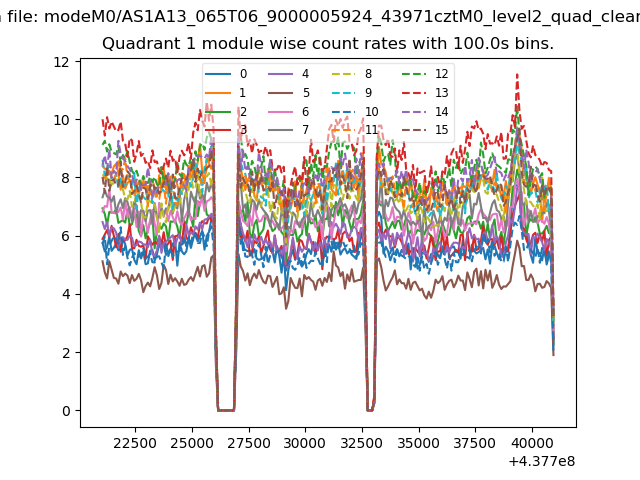
| Module-wise count rates for Quadrant A Data is divided into 100 sec bins |
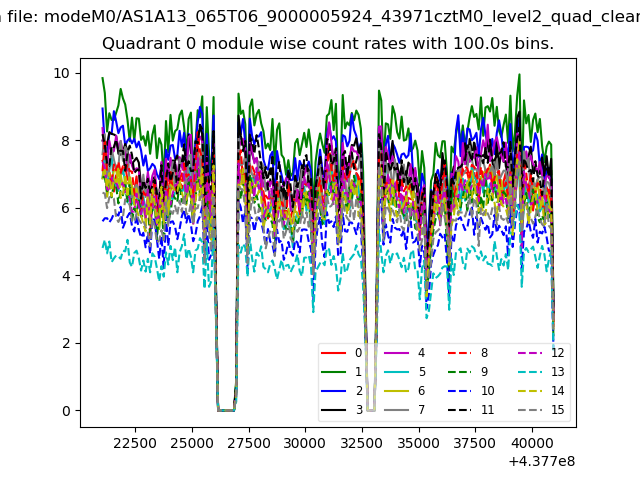 |
 |
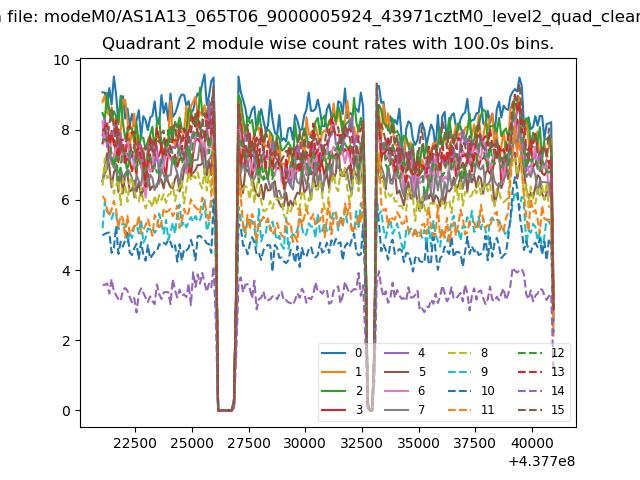
| Module-wise count rates for Quadrant B Data is divided into 100 sec bins |
 |
 |
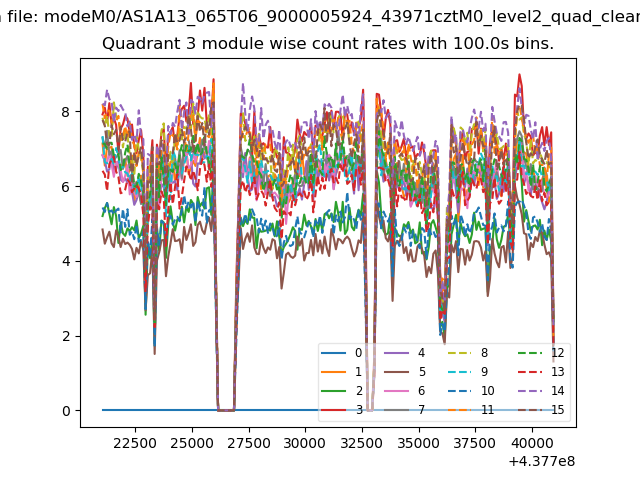
| Module-wise count rates for Quadrant C Data is divided into 100 sec bins |
 |
 |
| Module-wise count rates for Quadrant D Data is divided into 100 sec bins |
 |
 |
| Parameter | Plot |
|---|---|
| CZT HV Monitor | 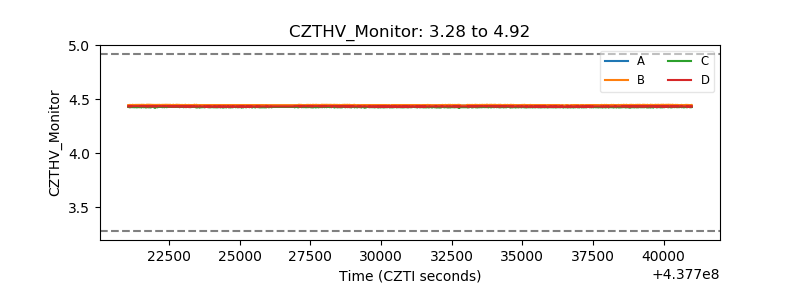 |
| D_VDD | 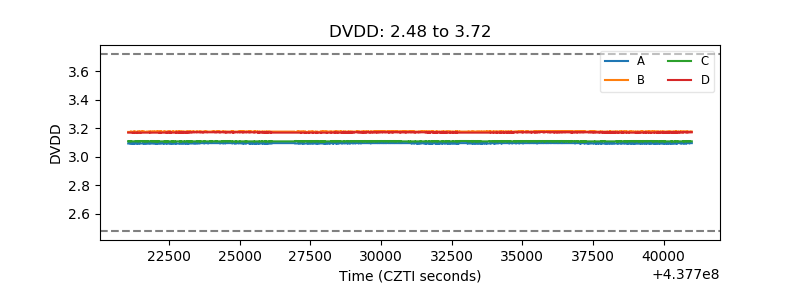 |
| Temperature 1 | 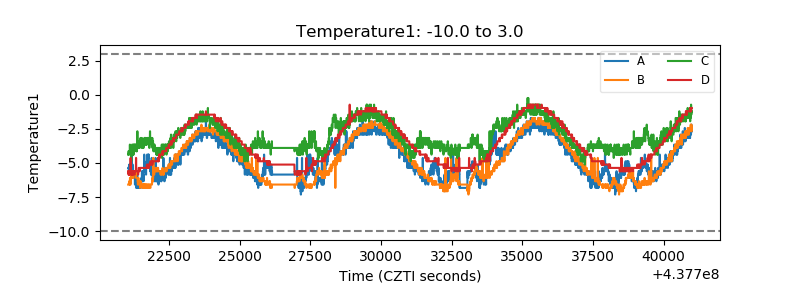 |
| Veto HV Monitor | 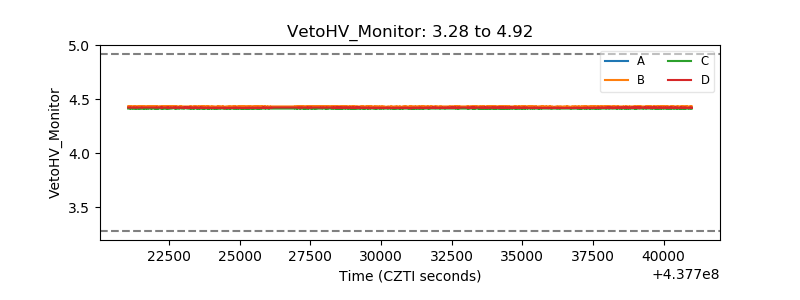 |
| Veto LLD | 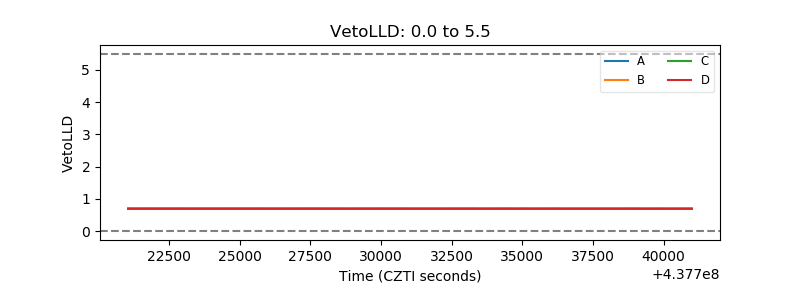 |
| Alpha Counter | 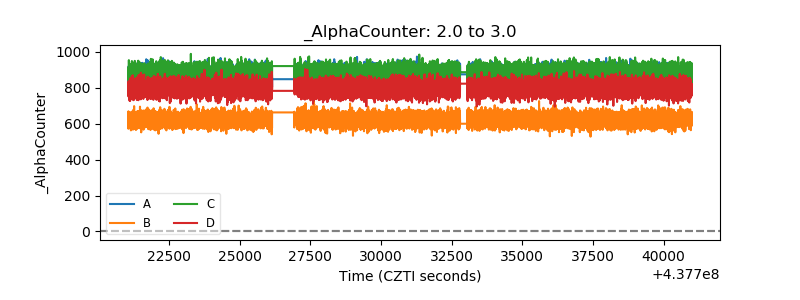 |
| _CPM_Rate | 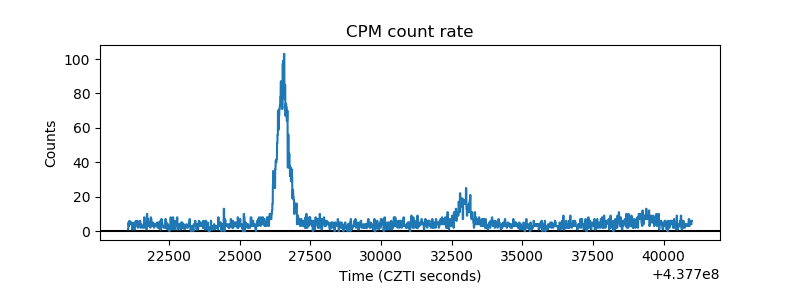 |
| CZT Counter | 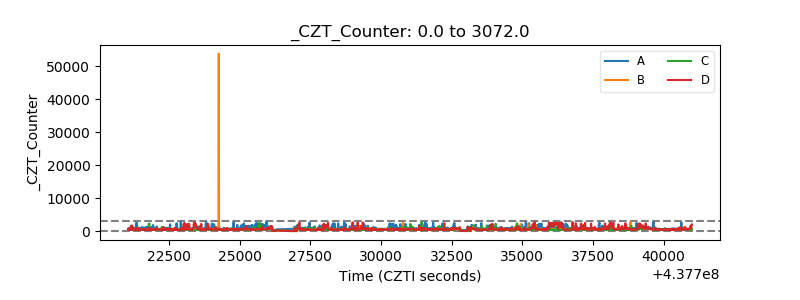 |
| +2.5 Volts monitor | 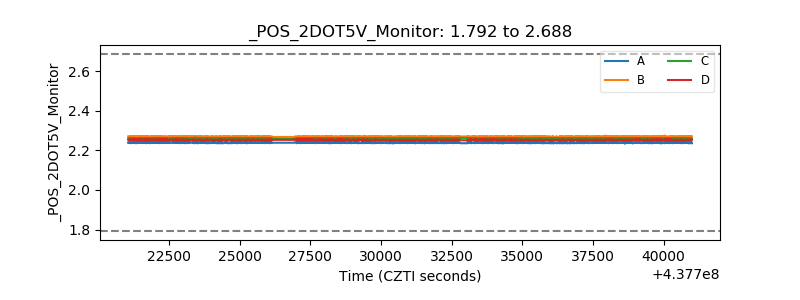 |
| +5 Volts monitor | 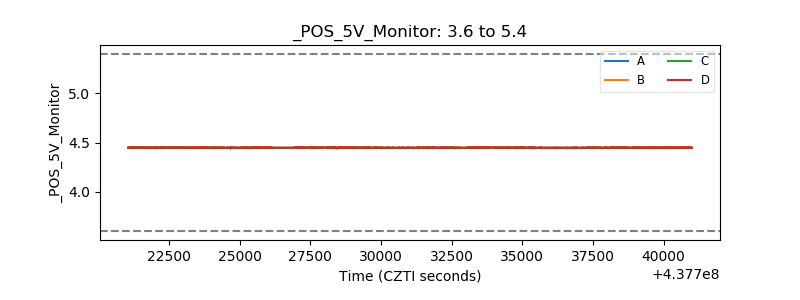 |
| _ROLL_ROT | 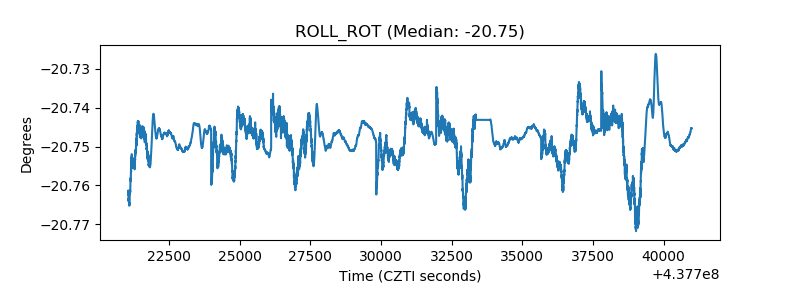 |
| _Roll_DEC | 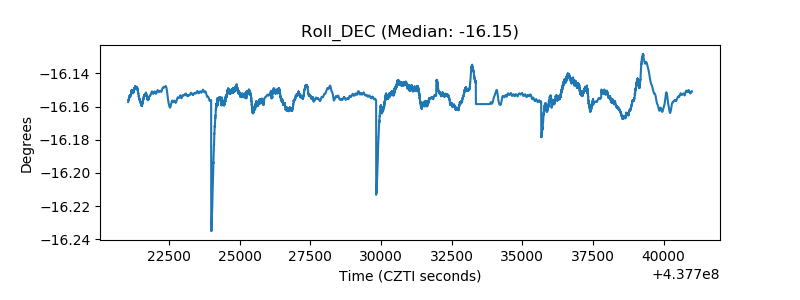 |
| _Roll_RA | 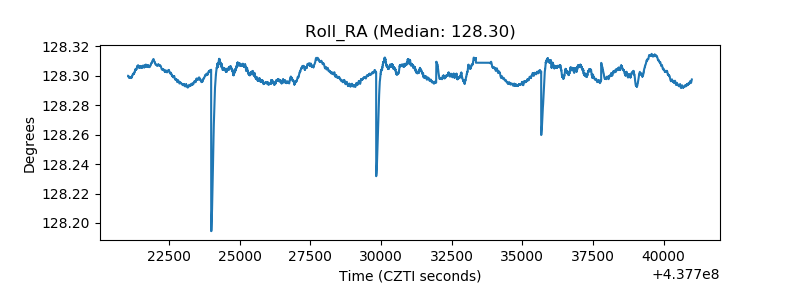 |
| Veto Counter | 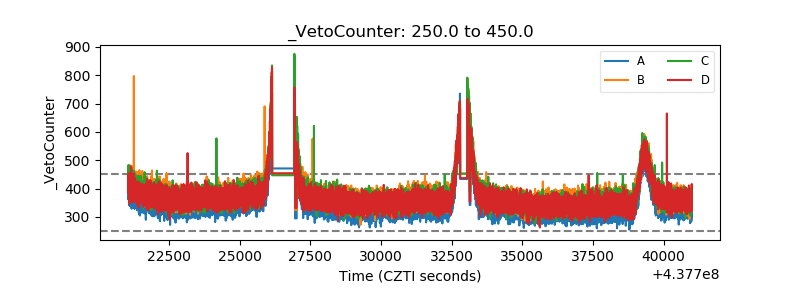 |