| Param | Original file | Final file |
|---|---|---|
| Filename | modeM0/AS1A13_065T06_9000005924_43975cztM0_level2.fits | modeM0/AS1A13_065T06_9000005924_43975cztM0_level2_quad_clean.evt |
| Size (bytes) | 1,580,480,640 | 314,164,800 |
| Size | 1.5 GB | 299.6 MB |
| Events in quadrant A | 19,891,454 | 1,845,243 |
| Events in quadrant B | 11,308,665 | 2,163,838 |
| Events in quadrant C | 10,535,672 | 2,163,273 |
| Events in quadrant D | 15,149,161 | 1,896,449 |
| Mode SS | |||
|---|---|---|---|
| Quadrant | BADHDUFLAG | Total packets | Discarded packets |
| A | 0 | 428 | 0 |
| B | 0 | 428 | 0 |
| C | 0 | 428 | 0 |
| D | 0 | 428 | 0 |
| Mode M9 | |||
|---|---|---|---|
| Quadrant | BADHDUFLAG | Total packets | Discarded packets |
| A | 0 | 12 | 0 |
| B | 0 | 12 | 0 |
| C | 0 | 12 | 0 |
| D | 0 | 12 | 0 |
| Mode M0 | |||
|---|---|---|---|
| Quadrant | BADHDUFLAG | Total packets | Discarded packets |
| A | 0 | 75357 | 6 |
| B | 0 | 48077 | 3 |
| C | 0 | 46390 | 3 |
| D | 0 | 59444 | 3 |
| Quadrant | Total seconds | Saturated seconds | Saturation percentage |
|---|---|---|---|
| A | 20939 | 3256 | 15.549931% |
| B | 20940 | 957 | 4.570201% |
| C | 20940 | 468 | 2.234957% |
| D | 20940 | 1111 | 5.305635% |
Noise dominated data is calculated using 1-second bins in cleaned event files. If a bin has >2000 counts, and if more than 50% of those come from <1% of pixels, then it is considered to be noise-dominated and hence unusable.
| Quadrant | # 1 sec bins | Bins with >0 counts | Bins with >2000 counts | High rate bins dominated by noise | Noise dominated (total time) | Noise dominated (detector-on time) | Marked lightcurve |
|---|---|---|---|---|---|---|---|
| A | 25941 | 20944 | 2392 | 2392 | 9.22% | 11.42% | 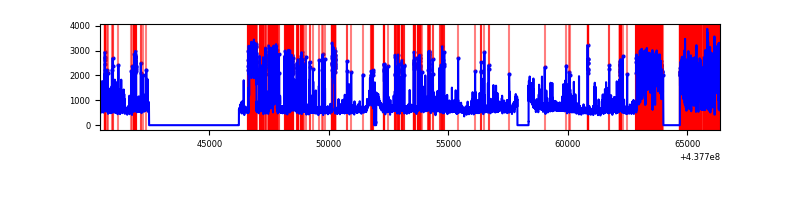 |
| B | 25942 | 20945 | 337 | 337 | 1.30% | 1.61% | 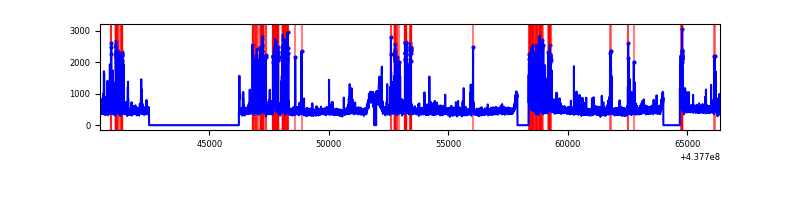 |
| C | 25942 | 20945 | 148 | 148 | 0.57% | 0.71% | 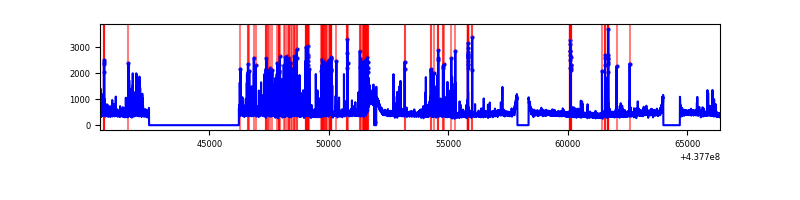 |
| D | 25942 | 20945 | 702 | 702 | 2.71% | 3.35% | 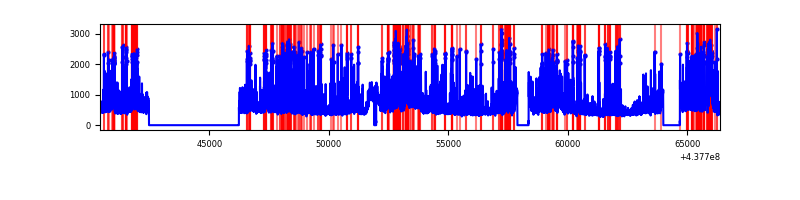 |
Top three noisy pixels from each quadrant. If the there are fewer than three noisy pixels in the level2.evt file, extra rows are filled as -1
| Pixel properties | Quadrant properties | ||||||
|---|---|---|---|---|---|---|---|
| Quadrant | DetID | PixID | Counts | Sigma | Mean | Median | Sigma |
| A | 15 | 223 | 7480655 | 16326.35 | 2202 | 2153 | 458.1 |
| A | 10 | 83 | 3118567 | 6803.46 | 2202 | 2153 | 458.1 |
| A | 14 | 238 | 471993 | 1025.71 | 2202 | 2153 | 458.1 |
| B | 5 | 172 | 1344531 | 2885.28 | 2342 | 2270 | 465.2 |
| B | 0 | 183 | 178752 | 379.36 | 2342 | 2270 | 465.2 |
| B | 15 | 36 | 165081 | 349.97 | 2342 | 2270 | 465.2 |
| C | 14 | 254 | 589959 | 1070.6 | 2331 | 2347 | 548.9 |
| C | 15 | 158 | 433329 | 785.23 | 2331 | 2347 | 548.9 |
| C | 15 | 157 | 167238 | 300.42 | 2331 | 2347 | 548.9 |
| D | 12 | 17 | 1590382 | 2686.18 | 2321 | 2249 | 591.2 |
| D | 5 | 235 | 1100172 | 1857.04 | 2321 | 2249 | 591.2 |
| D | 1 | 52 | 1090842 | 1841.26 | 2321 | 2249 | 591.2 |
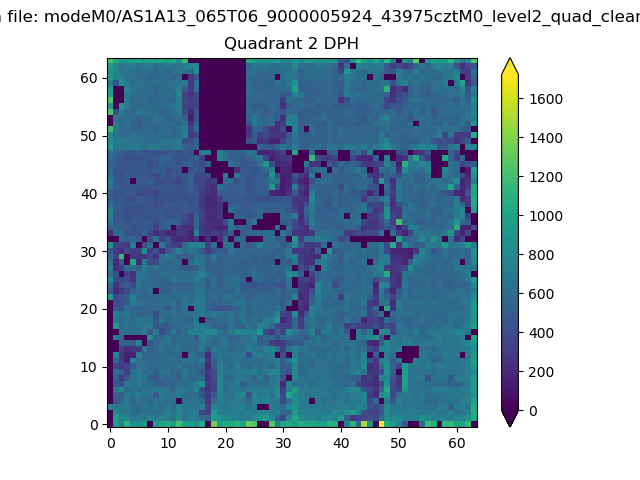
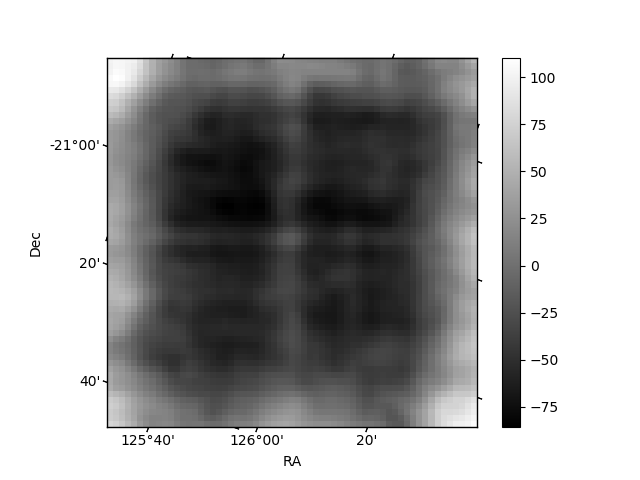
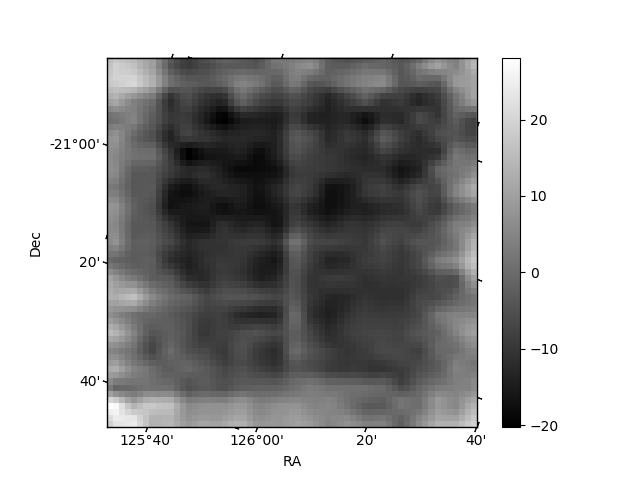
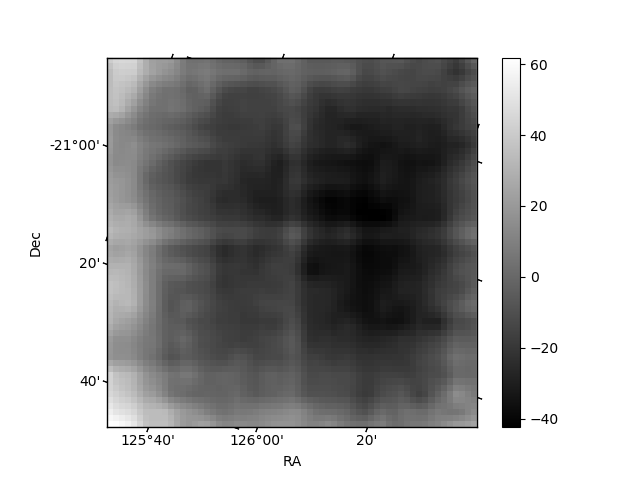
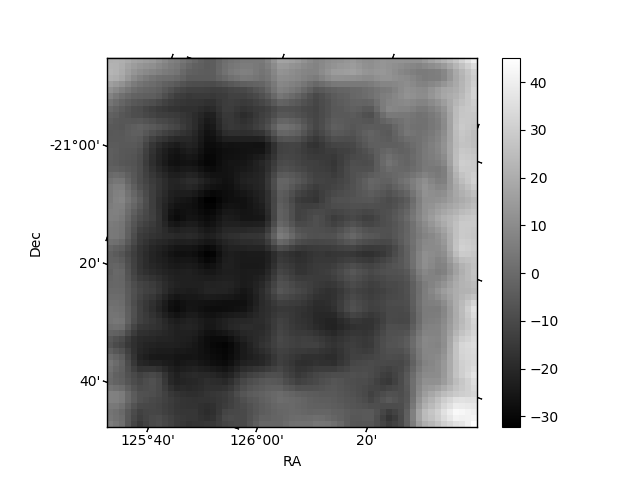
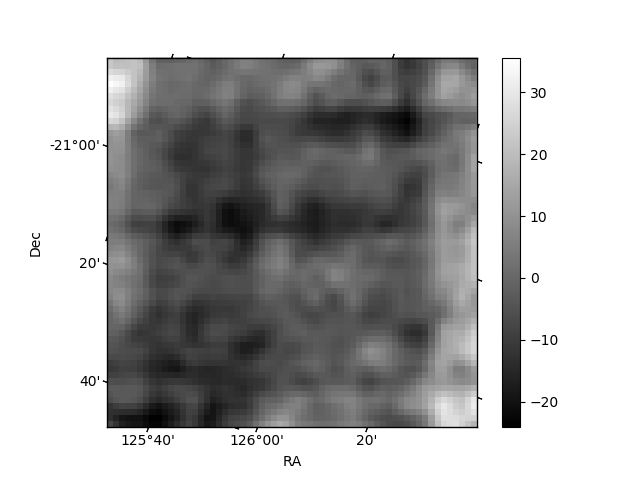
Histogram calculated using DETX and DETY for each event in the final _common_clean file
| Quadrant A | 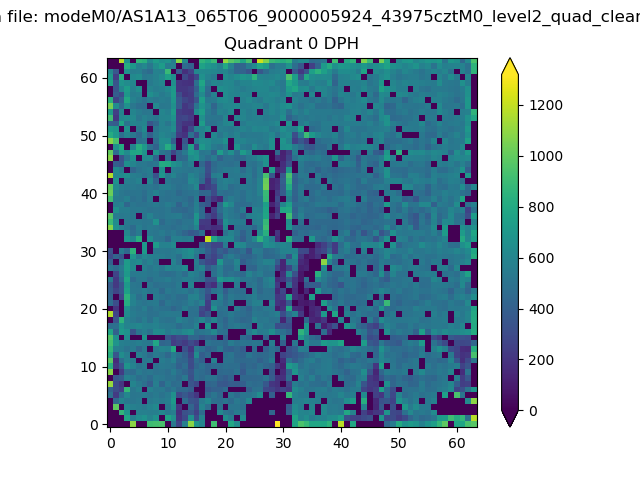 |
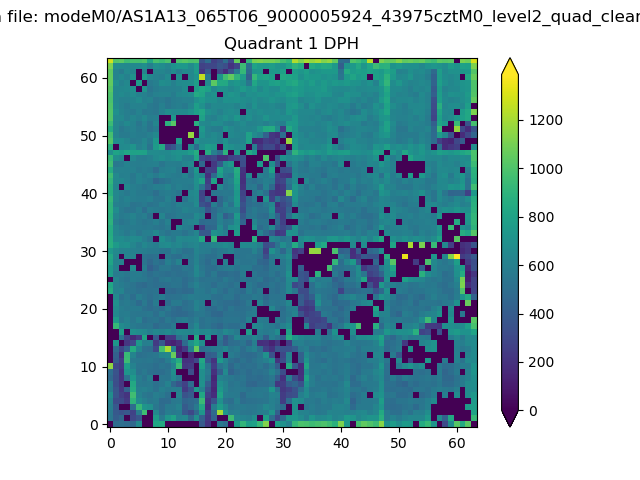 |
Quadrant B |
|---|---|---|---|
| Quadrant D | 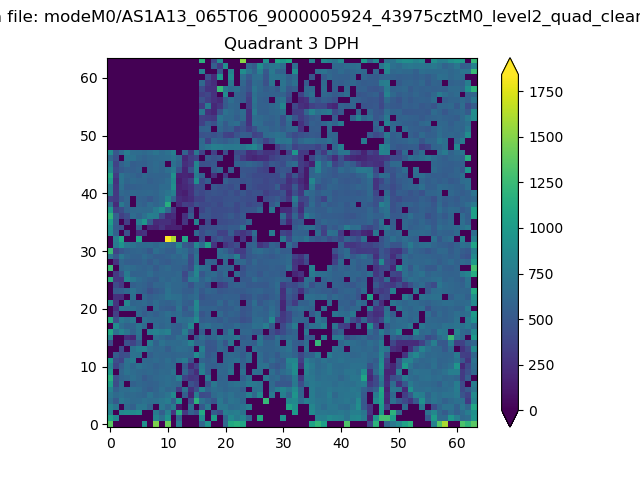 |
 |
Quadrant C |
| Plot type | Count rate plots | Images |
|---|---|---|
| Comparison with Poisson distribution Blue bars denote a histogram of data divided into 1 sec bins. Red curve is a Poisson curve with rate = median count rate of data. |
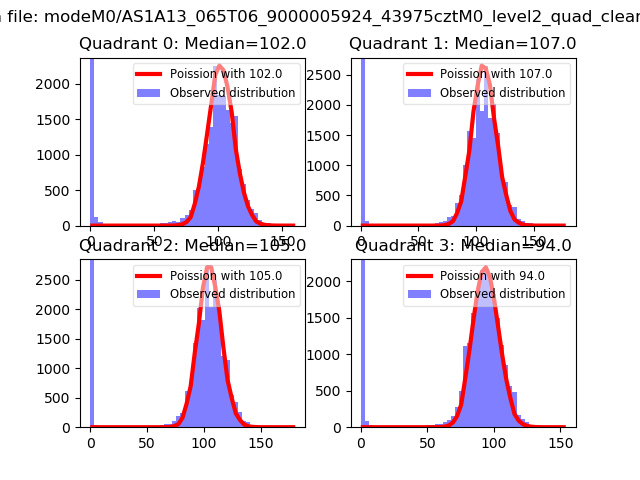 |
 |
| Quadrant-wise count rates Data is divided into 100 sec bins |
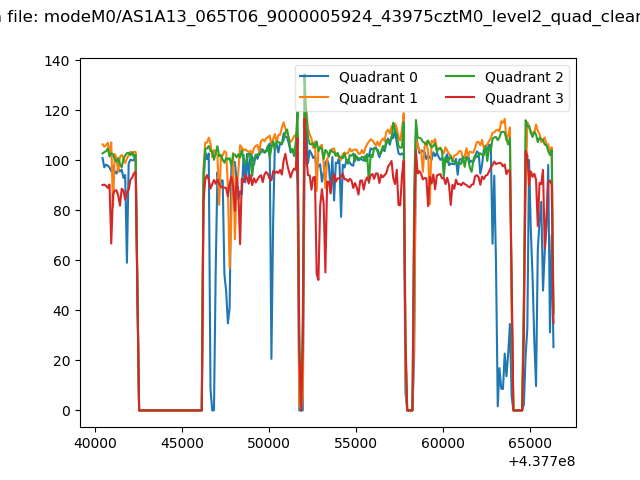 |
|
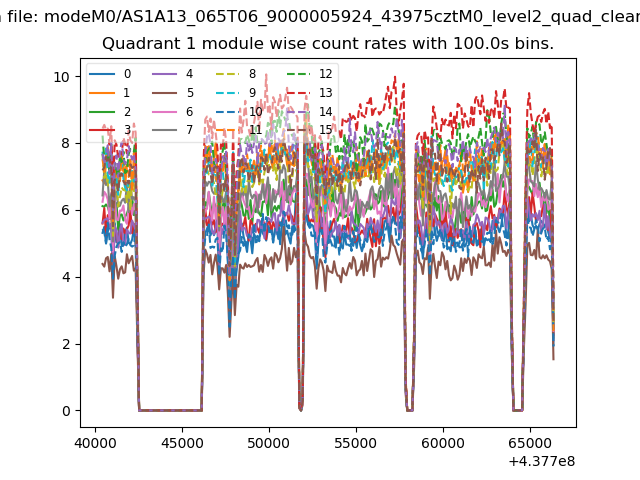
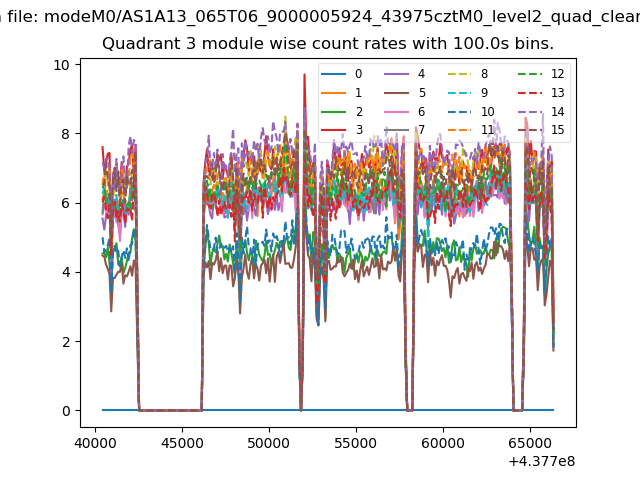
| Module-wise count rates for Quadrant A Data is divided into 100 sec bins |
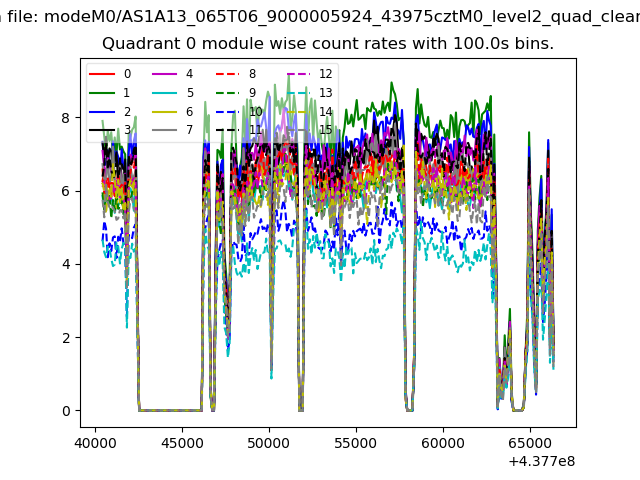 |
 |
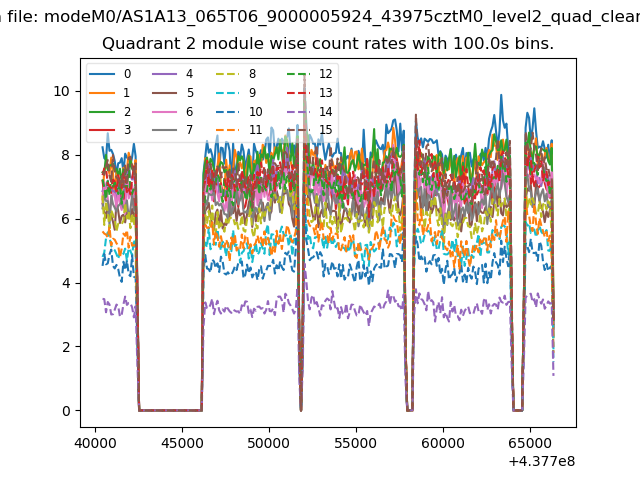
| Module-wise count rates for Quadrant B Data is divided into 100 sec bins |
 |
 |
| Module-wise count rates for Quadrant C Data is divided into 100 sec bins |
 |
 |
| Module-wise count rates for Quadrant D Data is divided into 100 sec bins |
 |
 |
| Parameter | Plot |
|---|---|
| CZT HV Monitor | 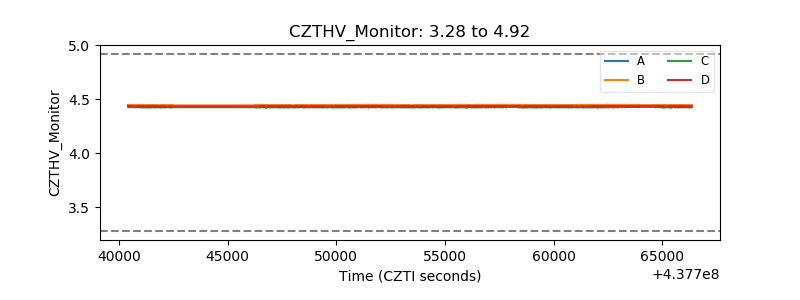 |
| D_VDD | 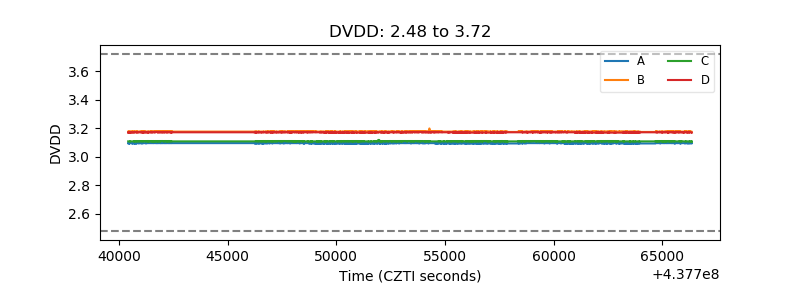 |
| Temperature 1 | 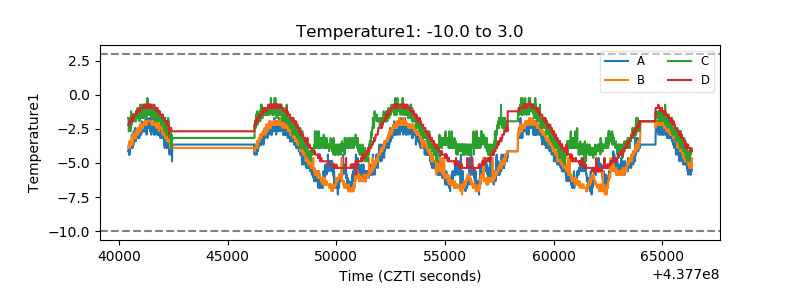 |
| Veto HV Monitor | 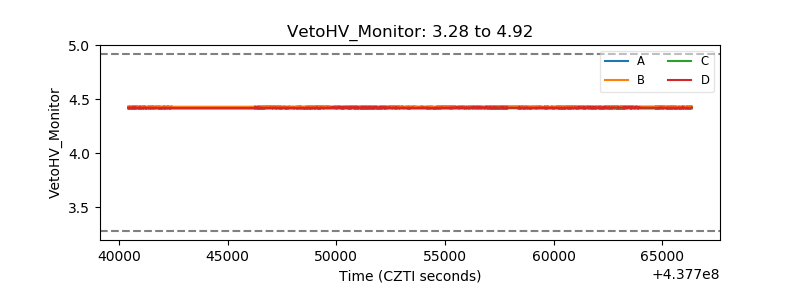 |
| Veto LLD | 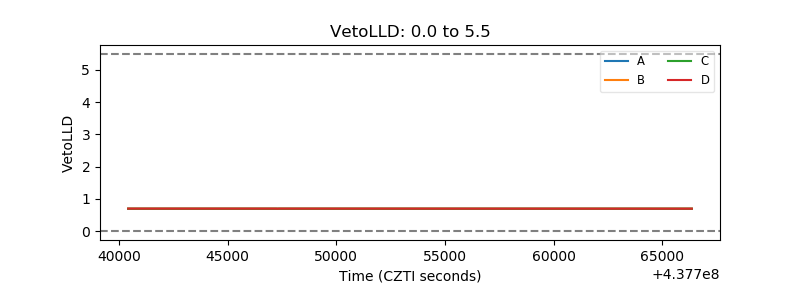 |
| Alpha Counter | 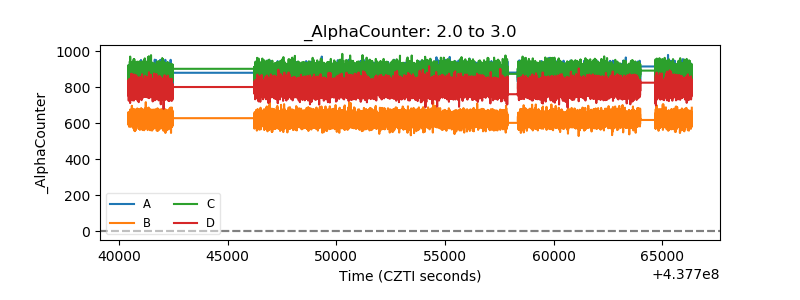 |
| _CPM_Rate | 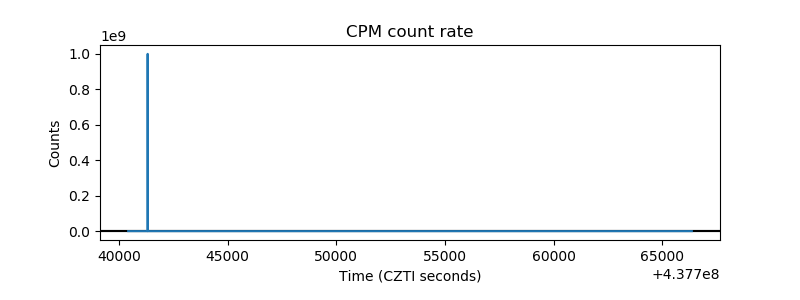 |
| CZT Counter | 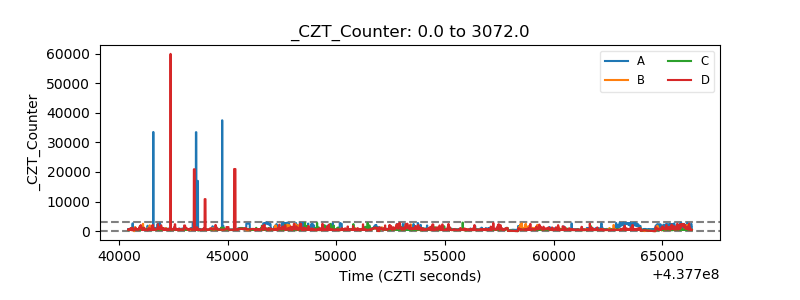 |
| +2.5 Volts monitor | 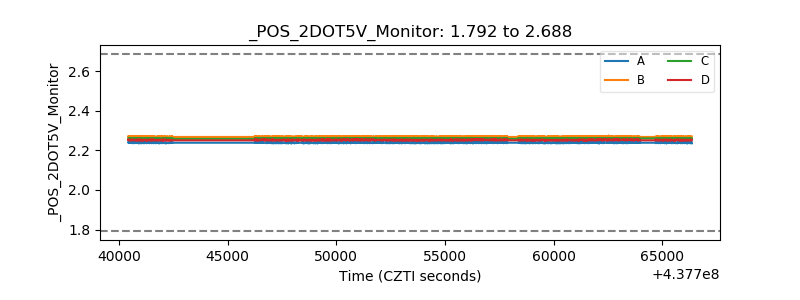 |
| +5 Volts monitor | 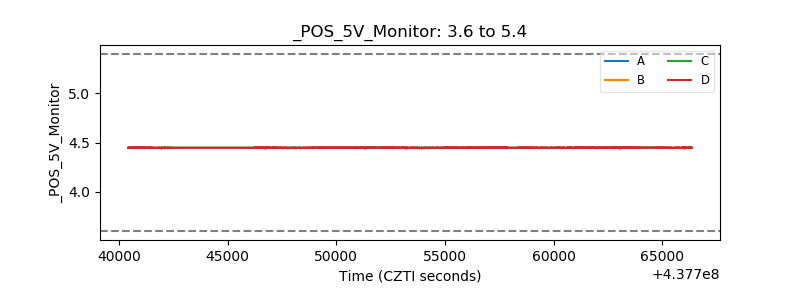 |
| _ROLL_ROT |  |
| _Roll_DEC | 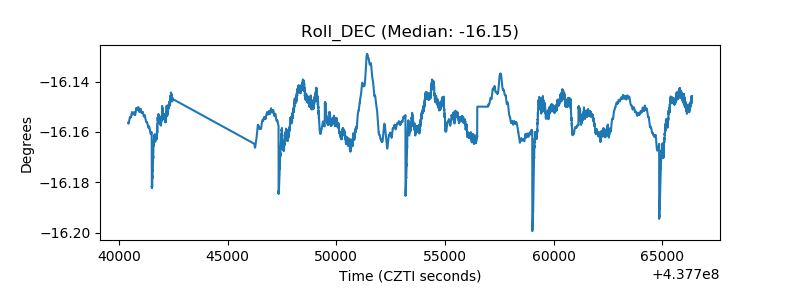 |
| _Roll_RA | 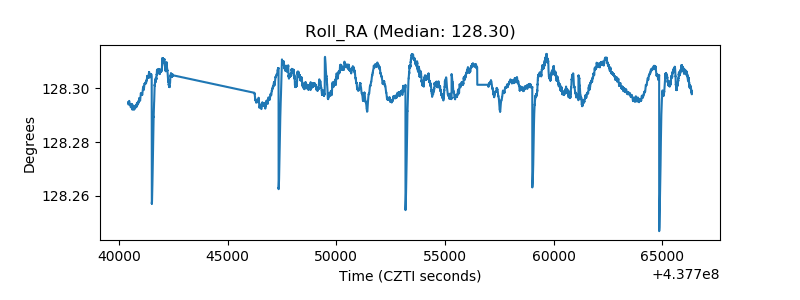 |
| Veto Counter |  |