| Param | Original file | Final file |
|---|---|---|
| Filename | modeM0/AS1A13_065T06_9000005924_43976cztM0_level2.fits | modeM0/AS1A13_065T06_9000005924_43976cztM0_level2_quad_clean.evt |
| Size (bytes) | 565,617,600 | 98,066,880 |
| Size | 539.4 MB | 93.5 MB |
| Events in quadrant A | 8,759,140 | 539,455 |
| Events in quadrant B | 3,310,042 | 700,063 |
| Events in quadrant C | 2,908,281 | 680,344 |
| Events in quadrant D | 5,463,395 | 602,784 |
| Mode SS | |||
|---|---|---|---|
| Quadrant | BADHDUFLAG | Total packets | Discarded packets |
| A | 0 | 130 | 0 |
| B | 0 | 130 | 0 |
| C | 0 | 130 | 0 |
| D | 0 | 130 | 0 |
| Mode M9 | |||
|---|---|---|---|
| Quadrant | BADHDUFLAG | Total packets | Discarded packets |
| A | 0 | 9 | 0 |
| B | 0 | 9 | 0 |
| C | 0 | 9 | 0 |
| D | 0 | 9 | 0 |
| Mode M0 | |||
|---|---|---|---|
| Quadrant | BADHDUFLAG | Total packets | Discarded packets |
| A | 0 | 30366 | 1 |
| B | 0 | 14082 | 1 |
| C | 0 | 13231 | 1 |
| D | 0 | 20822 | 1 |
| Quadrant | Total seconds | Saturated seconds | Saturation percentage |
|---|---|---|---|
| A | 6398 | 1692 | 26.445764% |
| B | 6398 | 132 | 2.063145% |
| C | 6399 | 31 | 0.484451% |
| D | 6399 | 405 | 6.329114% |
Noise dominated data is calculated using 1-second bins in cleaned event files. If a bin has >2000 counts, and if more than 50% of those come from <1% of pixels, then it is considered to be noise-dominated and hence unusable.
| Quadrant | # 1 sec bins | Bins with >0 counts | Bins with >2000 counts | High rate bins dominated by noise | Noise dominated (total time) | Noise dominated (detector-on time) | Marked lightcurve |
|---|---|---|---|---|---|---|---|
| A | 7278 | 6399 | 1254 | 1254 | 17.23% | 19.60% | 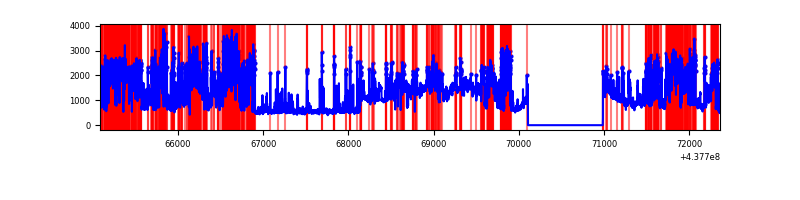 |
| B | 7278 | 6399 | 61 | 61 | 0.84% | 0.95% | 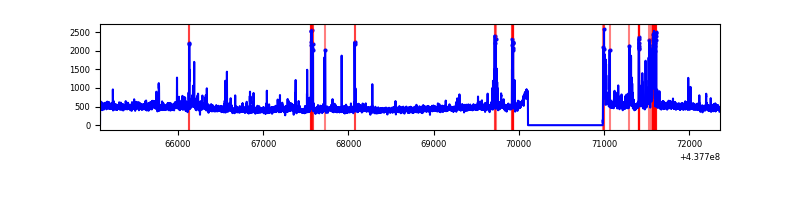 |
| C | 7279 | 6400 | 12 | 12 | 0.16% | 0.19% | 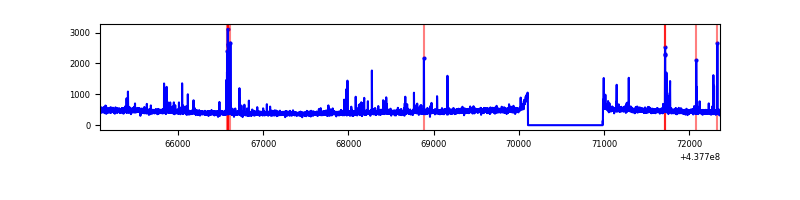 |
| D | 7279 | 6400 | 359 | 359 | 4.93% | 5.61% | 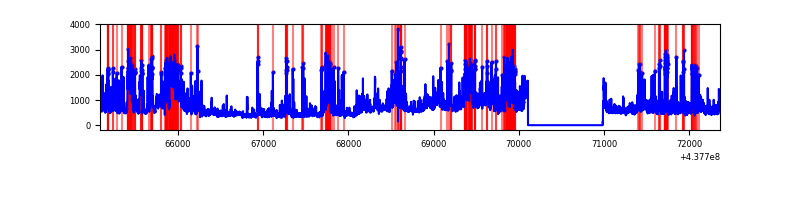 |
Top three noisy pixels from each quadrant. If the there are fewer than three noisy pixels in the level2.evt file, extra rows are filled as -1
| Pixel properties | Quadrant properties | ||||||
|---|---|---|---|---|---|---|---|
| Quadrant | DetID | PixID | Counts | Sigma | Mean | Median | Sigma |
| A | 15 | 223 | 4302153 | 32907.71 | 630 | 618 | 130.7 |
| A | 10 | 83 | 980502 | 7496.33 | 630 | 618 | 130.7 |
| A | 15 | 222 | 612434 | 4680.53 | 630 | 618 | 130.7 |
| B | 5 | 172 | 280726 | 1935.58 | 713 | 690 | 144.7 |
| B | 0 | 155 | 66470 | 454.67 | 713 | 690 | 144.7 |
| B | 0 | 200 | 38271 | 259.76 | 713 | 690 | 144.7 |
| C | 14 | 254 | 113332 | 678.14 | 702 | 705 | 166.1 |
| C | 3 | 233 | 21758 | 126.76 | 702 | 705 | 166.1 |
| C | 15 | 157 | 13174 | 75.08 | 702 | 705 | 166.1 |
| D | 12 | 17 | 1170557 | 6668.73 | 688 | 667 | 175.4 |
| D | 1 | 52 | 586229 | 3337.88 | 688 | 667 | 175.4 |
| D | 4 | 235 | 210648 | 1196.96 | 688 | 667 | 175.4 |
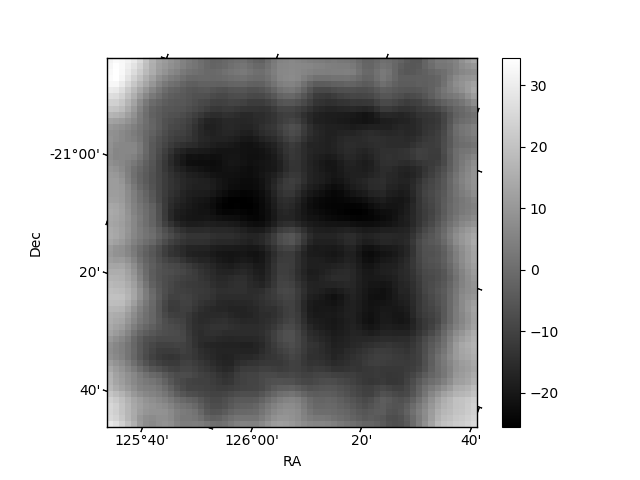
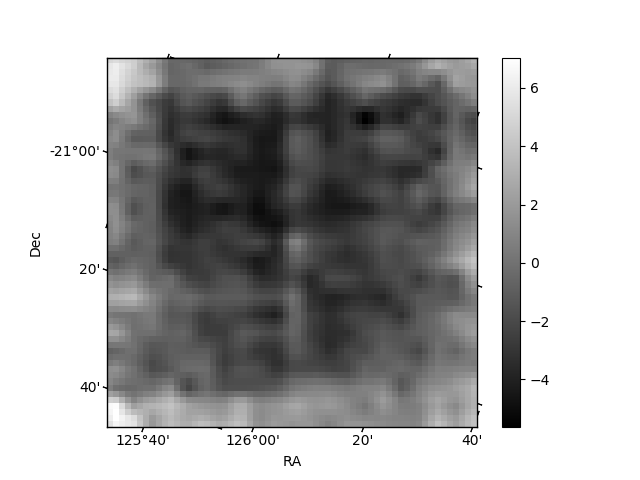
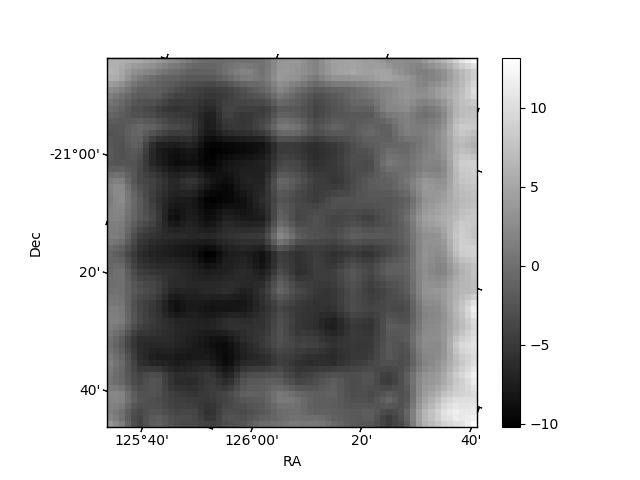
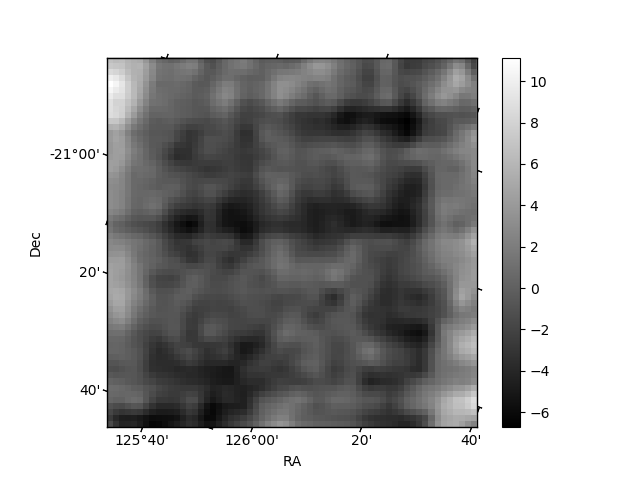
Histogram calculated using DETX and DETY for each event in the final _common_clean file
| Quadrant A | 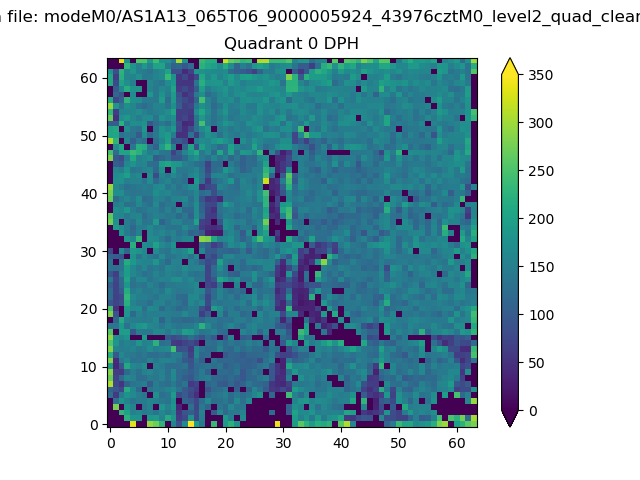 |
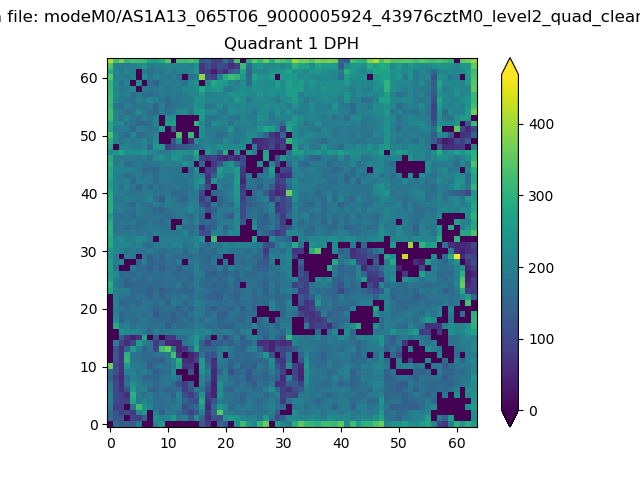 |
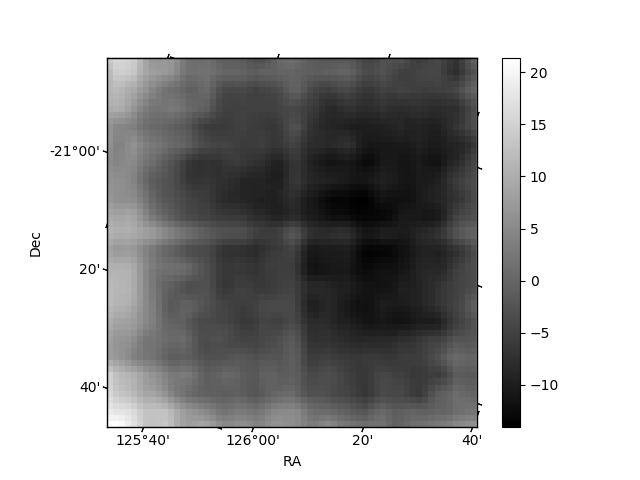
Quadrant B |
|---|---|---|---|
| Quadrant D | 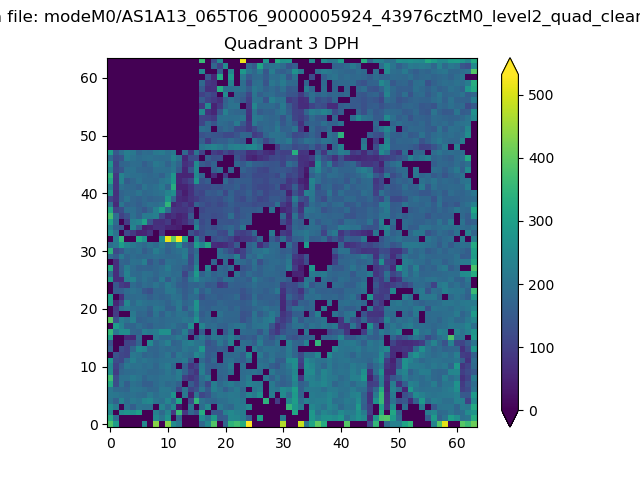 |
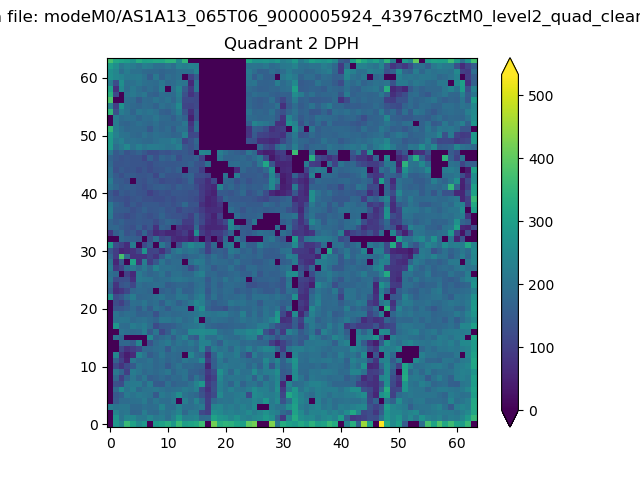 |
Quadrant C |
| Plot type | Count rate plots | Images |
|---|---|---|
| Comparison with Poisson distribution Blue bars denote a histogram of data divided into 1 sec bins. Red curve is a Poisson curve with rate = median count rate of data. |
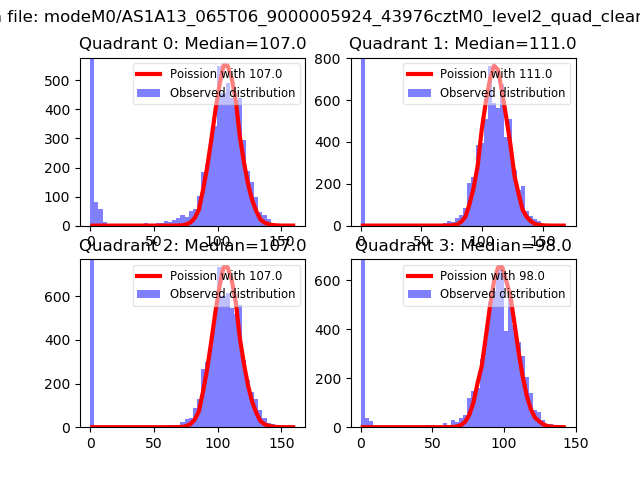 |
 |
| Quadrant-wise count rates Data is divided into 100 sec bins |
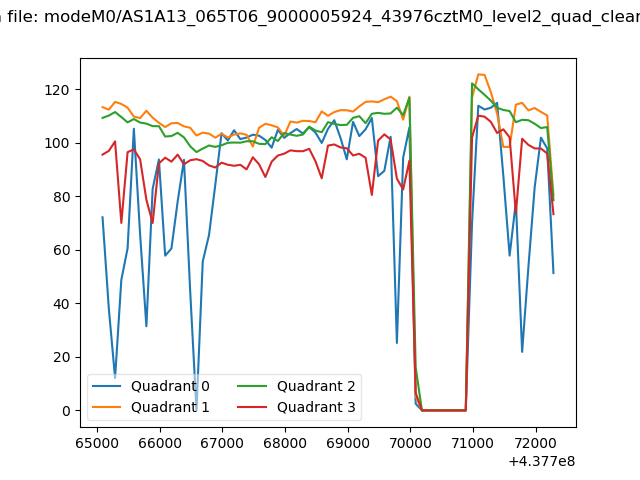 |
|
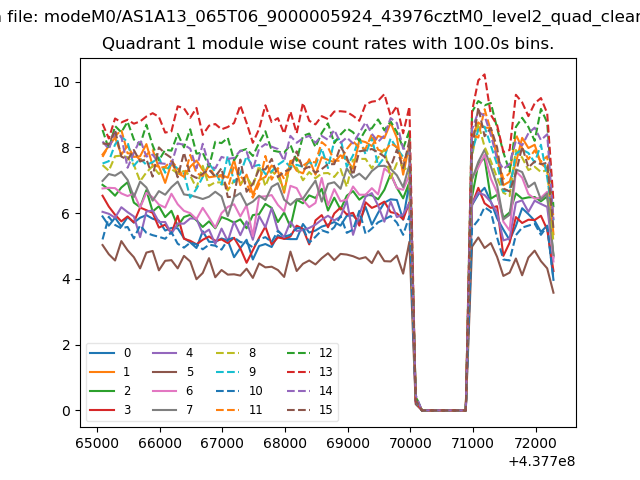
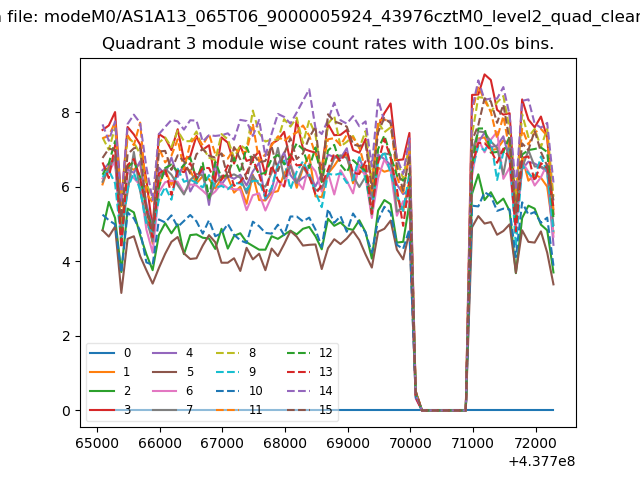
| Module-wise count rates for Quadrant A Data is divided into 100 sec bins |
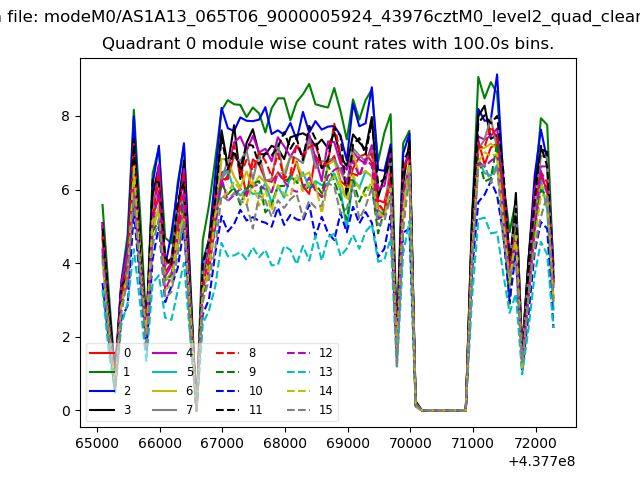 |
 |
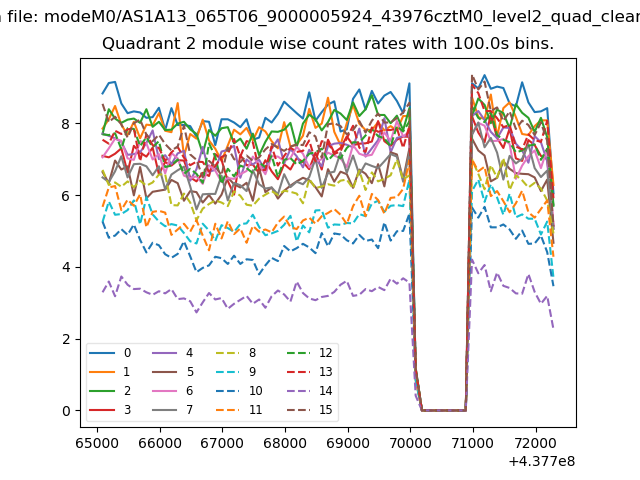
| Module-wise count rates for Quadrant B Data is divided into 100 sec bins |
 |
 |
| Module-wise count rates for Quadrant C Data is divided into 100 sec bins |
 |
 |
| Module-wise count rates for Quadrant D Data is divided into 100 sec bins |
 |
 |
| Parameter | Plot |
|---|---|
| CZT HV Monitor | 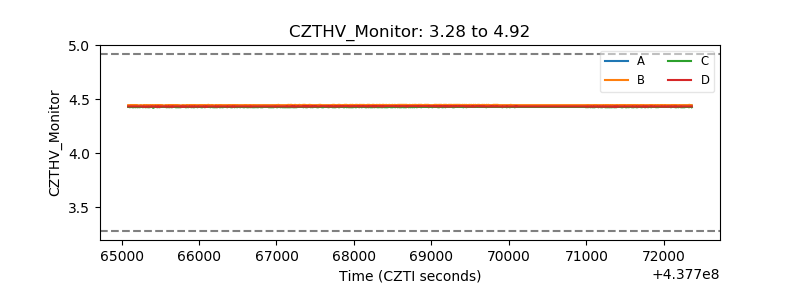 |
| D_VDD | 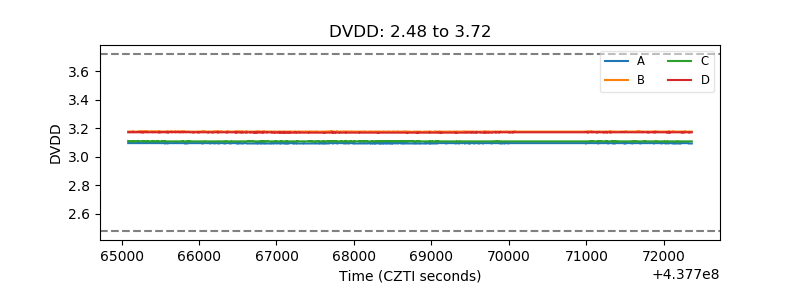 |
| Temperature 1 | 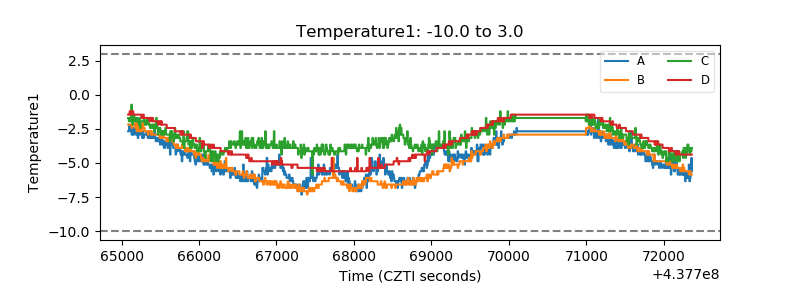 |
| Veto HV Monitor | 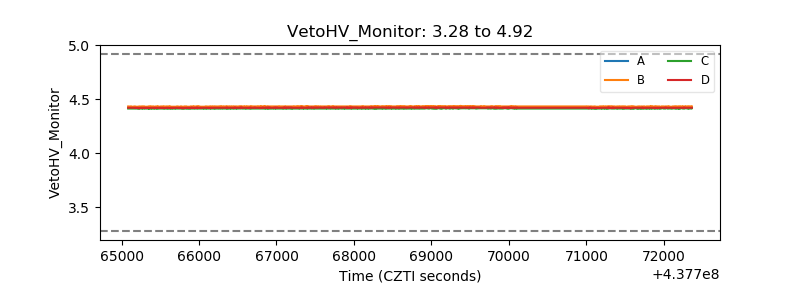 |
| Veto LLD | 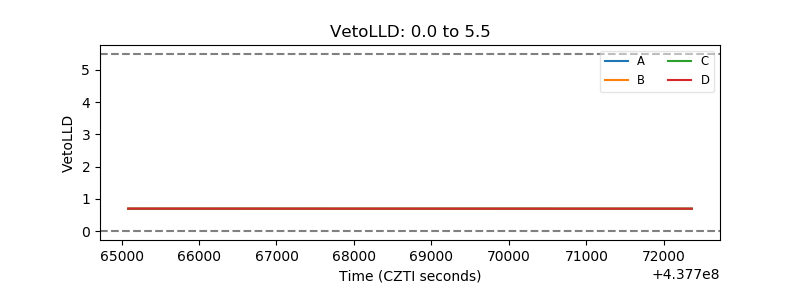 |
| Alpha Counter | 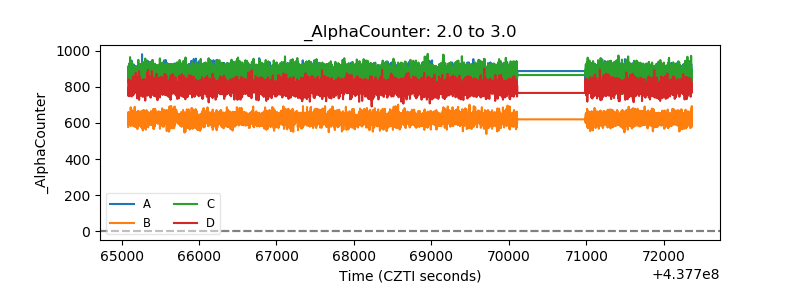 |
| _CPM_Rate | 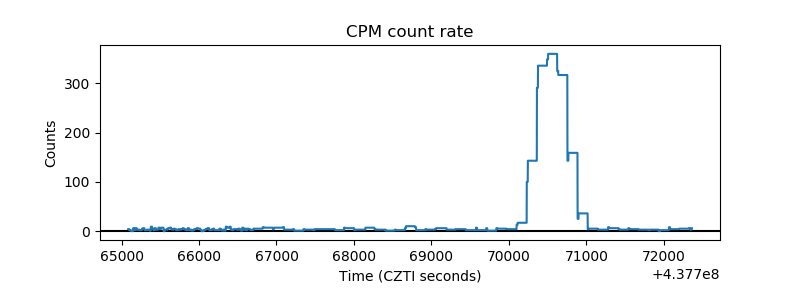 |
| CZT Counter | 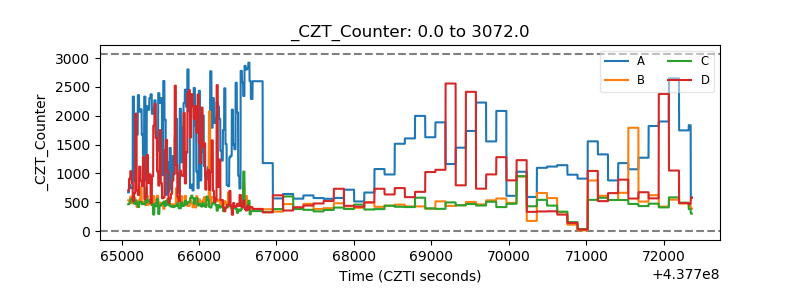 |
| +2.5 Volts monitor | 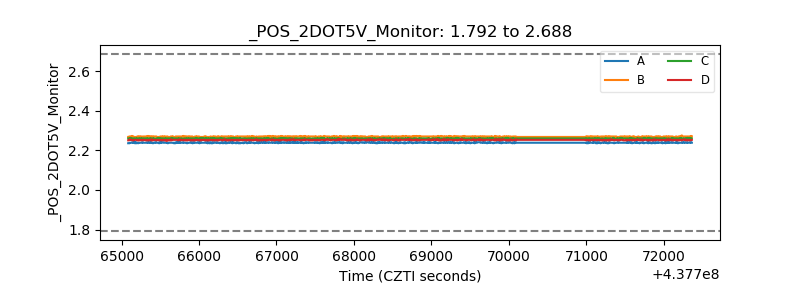 |
| +5 Volts monitor | 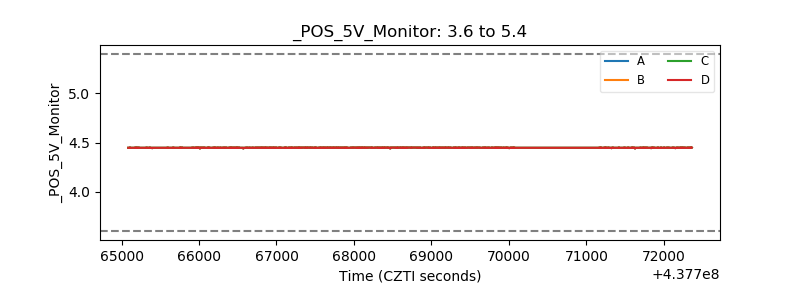 |
| _ROLL_ROT | 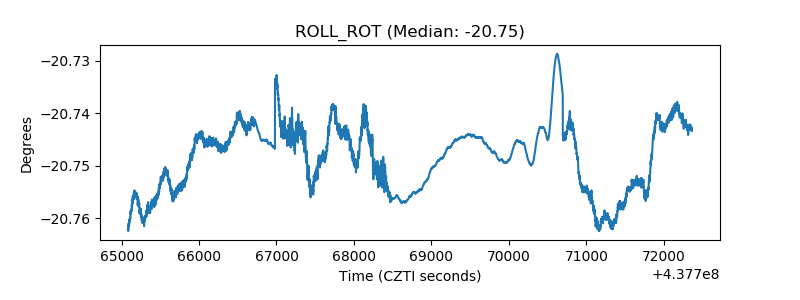 |
| _Roll_DEC | 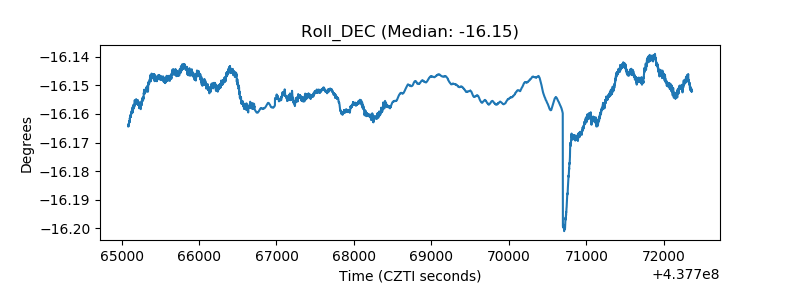 |
| _Roll_RA | 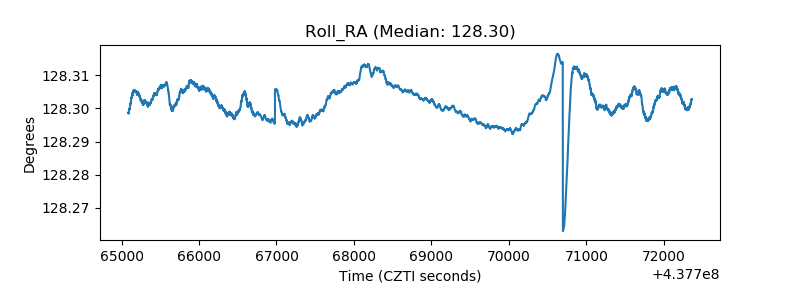 |
| Veto Counter | 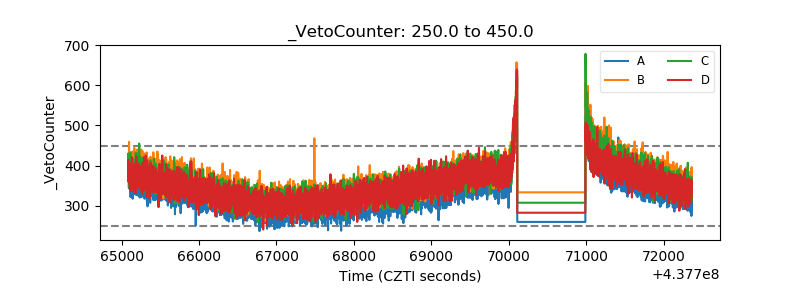 |