| Param | Original file | Final file |
|---|---|---|
| Filename | modeM0/AS1A13_065T06_9000005924_43978cztM0_level2.fits | modeM0/AS1A13_065T06_9000005924_43978cztM0_level2_quad_clean.evt |
| Size (bytes) | 621,437,760 | 95,958,720 |
| Size | 592.6 MB | 91.5 MB |
| Events in quadrant A | 11,286,805 | 346,545 |
| Events in quadrant B | 3,595,533 | 734,363 |
| Events in quadrant C | 3,047,619 | 718,013 |
| Events in quadrant D | 4,558,573 | 644,420 |
| Mode SS | |||
|---|---|---|---|
| Quadrant | BADHDUFLAG | Total packets | Discarded packets |
| A | 0 | 136 | 0 |
| B | 0 | 136 | 0 |
| C | 0 | 136 | 0 |
| D | 0 | 136 | 0 |
| Mode M9 | |||
|---|---|---|---|
| Quadrant | BADHDUFLAG | Total packets | Discarded packets |
| A | 0 | 10 | 0 |
| B | 0 | 11 | 0 |
| C | 0 | 11 | 0 |
| D | 0 | 11 | 0 |
| Mode M0 | |||
|---|---|---|---|
| Quadrant | BADHDUFLAG | Total packets | Discarded packets |
| A | 0 | 38128 | 2 |
| B | 0 | 15242 | 2 |
| C | 0 | 13789 | 2 |
| D | 0 | 18191 | 2 |
| Quadrant | Total seconds | Saturated seconds | Saturation percentage |
|---|---|---|---|
| A | 6621 | 3840 | 57.997281% |
| B | 6621 | 239 | 3.609727% |
| C | 6620 | 49 | 0.740181% |
| D | 6620 | 241 | 3.640483% |
Noise dominated data is calculated using 1-second bins in cleaned event files. If a bin has >2000 counts, and if more than 50% of those come from <1% of pixels, then it is considered to be noise-dominated and hence unusable.
| Quadrant | # 1 sec bins | Bins with >0 counts | Bins with >2000 counts | High rate bins dominated by noise | Noise dominated (total time) | Noise dominated (detector-on time) | Marked lightcurve |
|---|---|---|---|---|---|---|---|
| A | 7606 | 6622 | 2629 | 2629 | 34.56% | 39.70% | 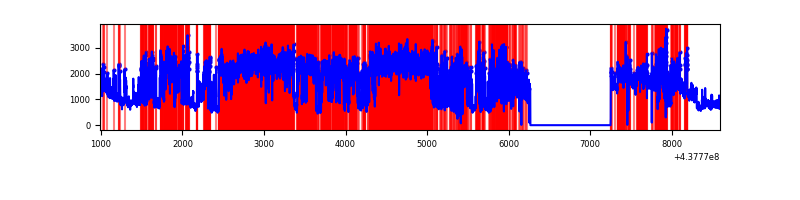 |
| B | 7606 | 6622 | 108 | 108 | 1.42% | 1.63% | 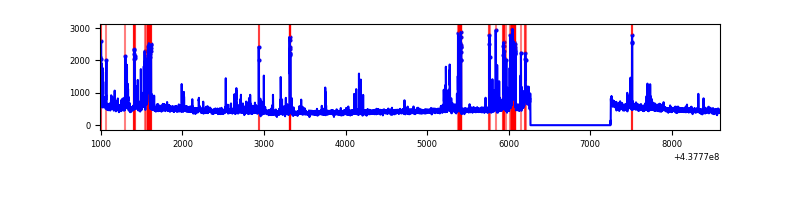 |
| C | 7605 | 6621 | 12 | 12 | 0.16% | 0.18% | 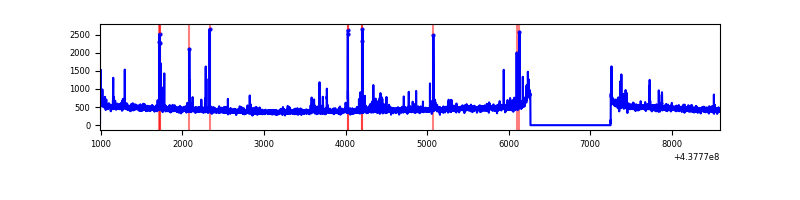 |
| D | 7605 | 6621 | 178 | 178 | 2.34% | 2.69% |  |
Top three noisy pixels from each quadrant. If the there are fewer than three noisy pixels in the level2.evt file, extra rows are filled as -1
| Pixel properties | Quadrant properties | ||||||
|---|---|---|---|---|---|---|---|
| Quadrant | DetID | PixID | Counts | Sigma | Mean | Median | Sigma |
| A | 15 | 223 | 8100308 | 79941.24 | 484 | 474 | 101.3 |
| A | 10 | 83 | 874563 | 8626.81 | 484 | 474 | 101.3 |
| A | 15 | 222 | 289361 | 2851.17 | 484 | 474 | 101.3 |
| B | 5 | 172 | 488849 | 3267.87 | 747 | 725 | 149.4 |
| B | 0 | 200 | 43613 | 287.12 | 747 | 725 | 149.4 |
| B | 0 | 183 | 27312 | 177.99 | 747 | 725 | 149.4 |
| C | 14 | 254 | 114256 | 646.45 | 742 | 745 | 175.6 |
| C | 2 | 14 | 14508 | 78.38 | 742 | 745 | 175.6 |
| C | 3 | 233 | 13964 | 75.28 | 742 | 745 | 175.6 |
| D | 1 | 52 | 638772 | 3402.03 | 731 | 708 | 187.6 |
| D | 4 | 222 | 290279 | 1543.94 | 731 | 708 | 187.6 |
| D | 12 | 17 | 230061 | 1222.86 | 731 | 708 | 187.6 |
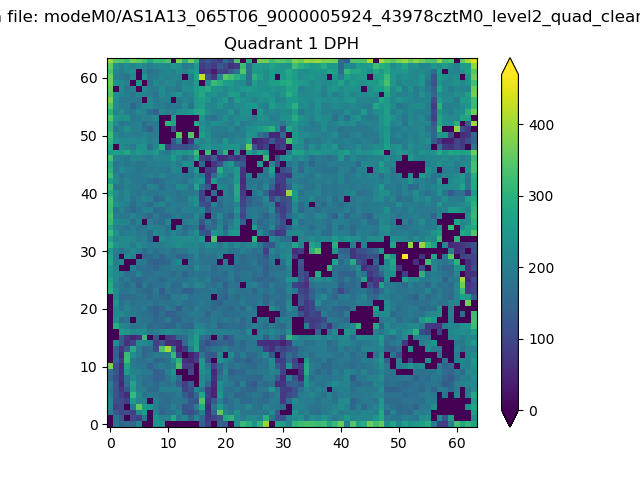
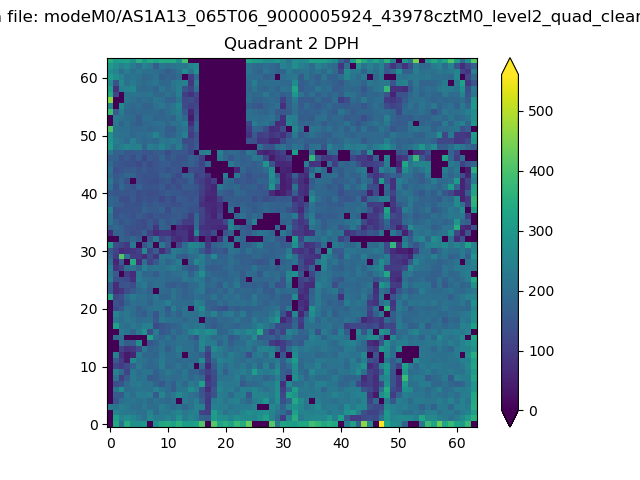
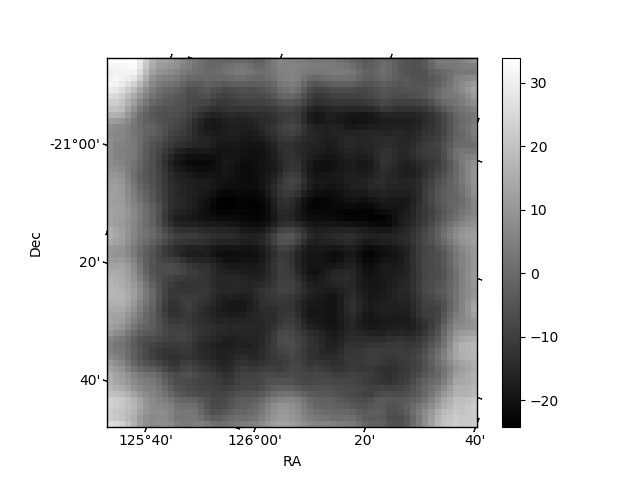
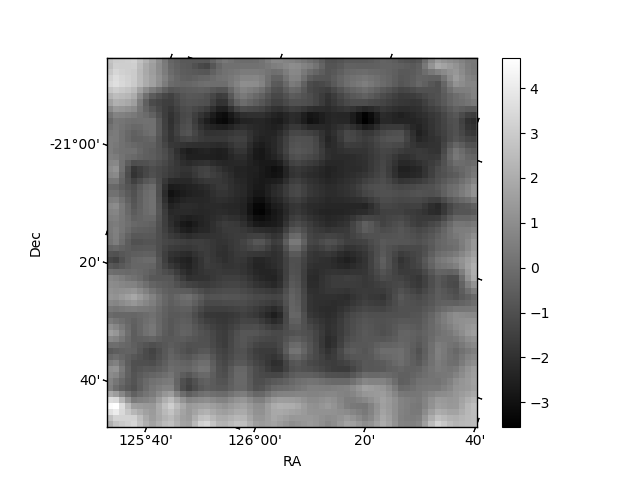
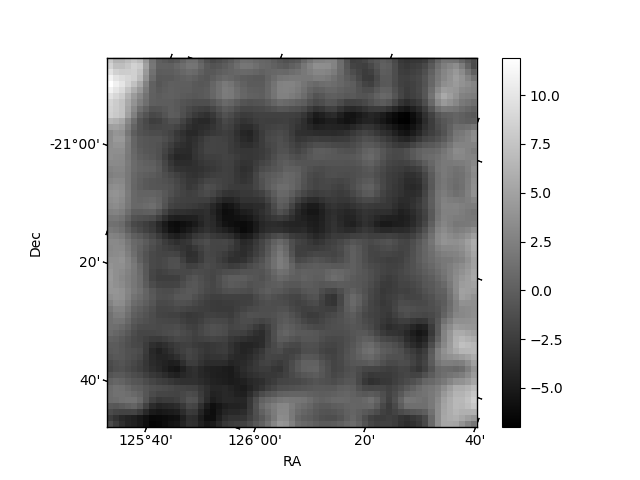
Histogram calculated using DETX and DETY for each event in the final _common_clean file
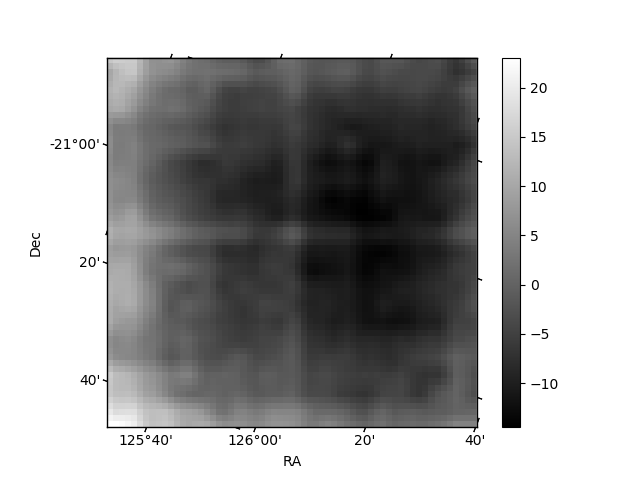
| Quadrant A | 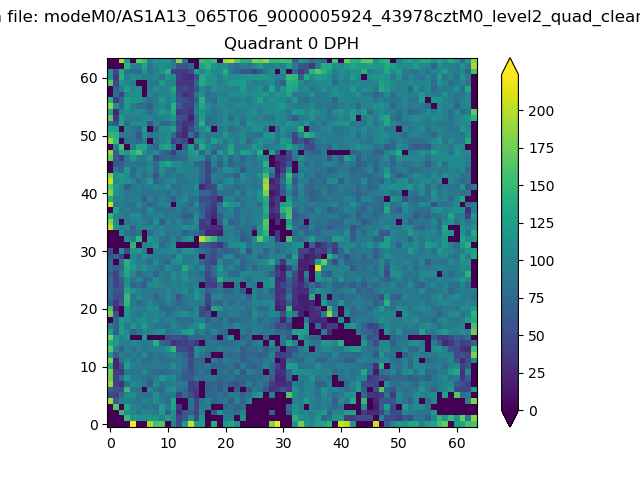 |
 |
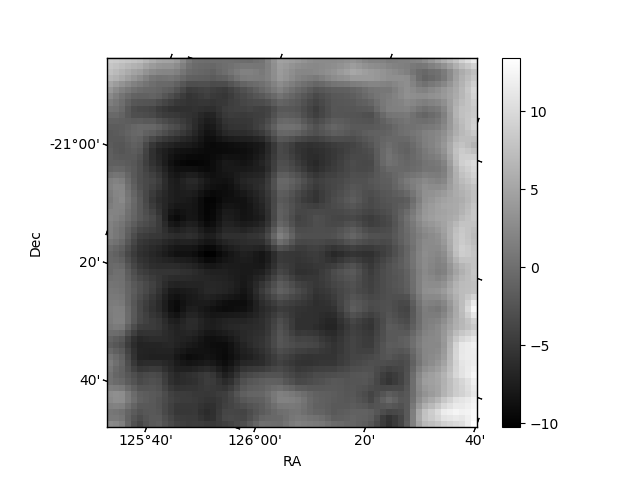
Quadrant B |
|---|---|---|---|
| Quadrant D | 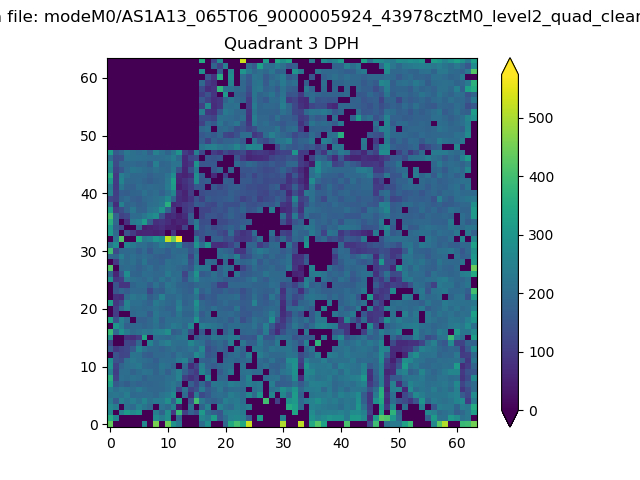 |
 |
Quadrant C |
| Plot type | Count rate plots | Images |
|---|---|---|
| Comparison with Poisson distribution Blue bars denote a histogram of data divided into 1 sec bins. Red curve is a Poisson curve with rate = median count rate of data. |
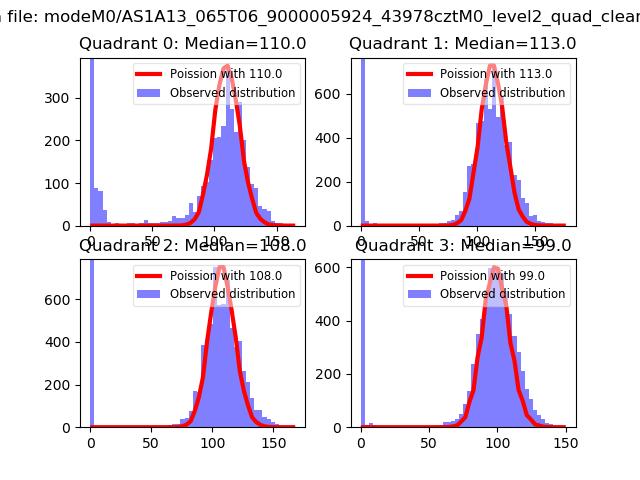 |
 |
| Quadrant-wise count rates Data is divided into 100 sec bins |
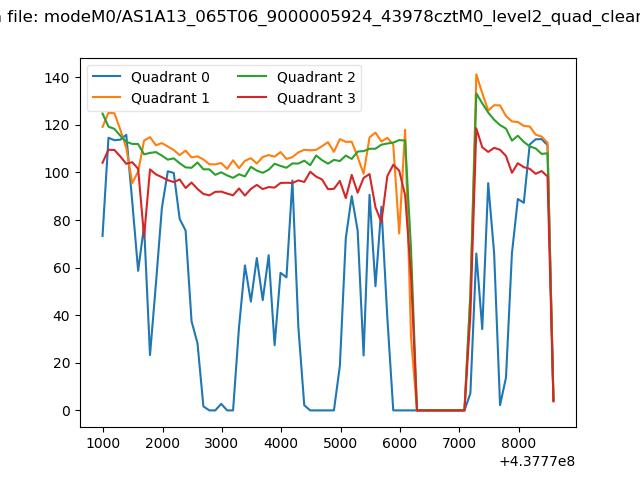 |
|
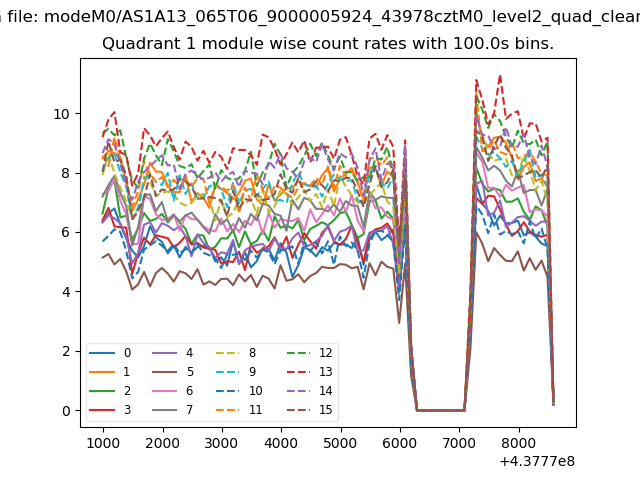
| Module-wise count rates for Quadrant A Data is divided into 100 sec bins |
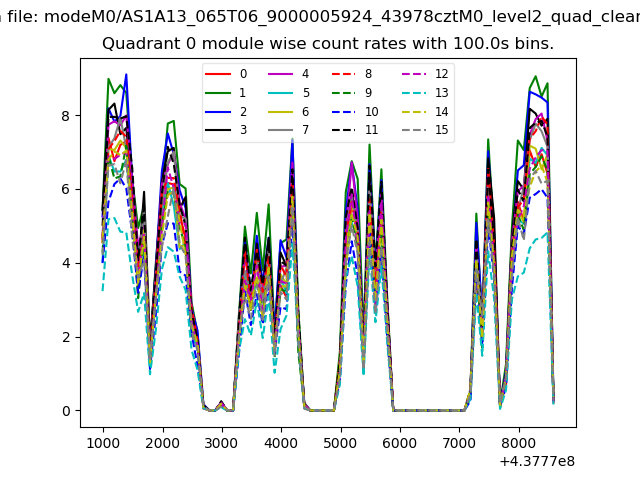 |
 |
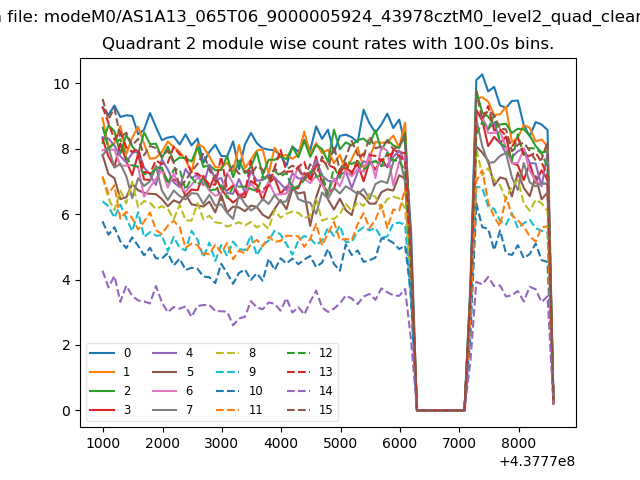
| Module-wise count rates for Quadrant B Data is divided into 100 sec bins |
 |
 |
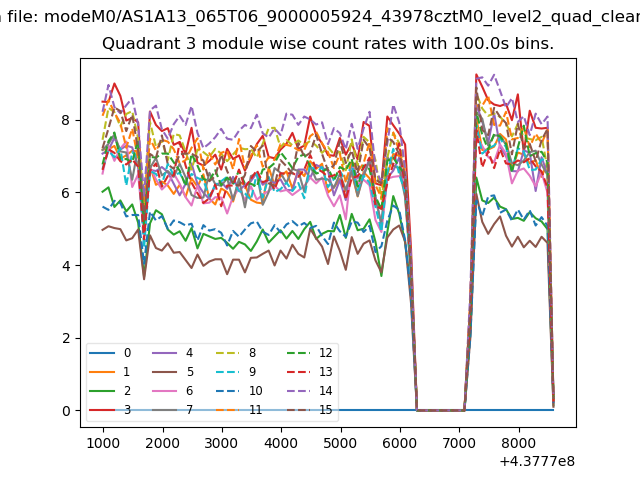
| Module-wise count rates for Quadrant C Data is divided into 100 sec bins |
 |
 |
| Module-wise count rates for Quadrant D Data is divided into 100 sec bins |
 |
 |
| Parameter | Plot |
|---|---|
| CZT HV Monitor | 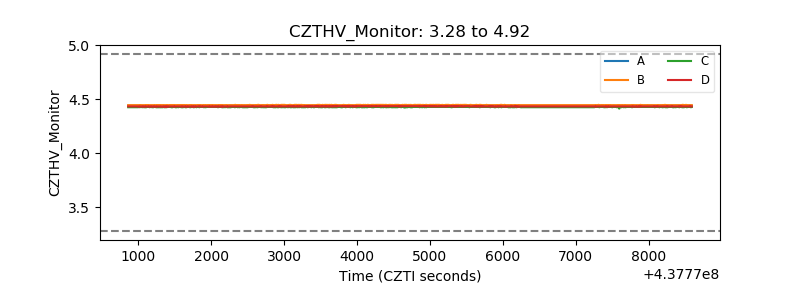 |
| D_VDD | 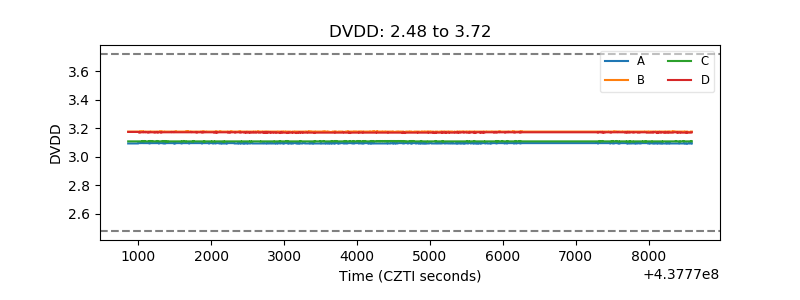 |
| Temperature 1 | 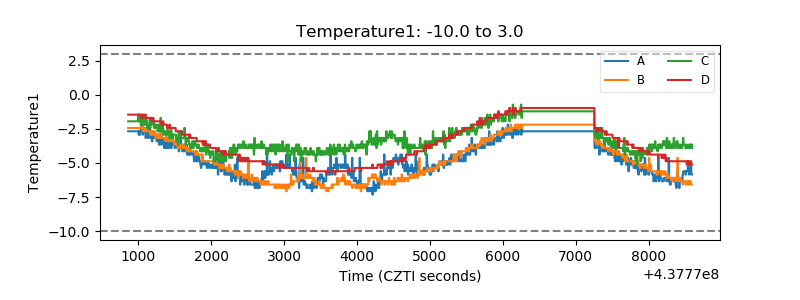 |
| Veto HV Monitor | 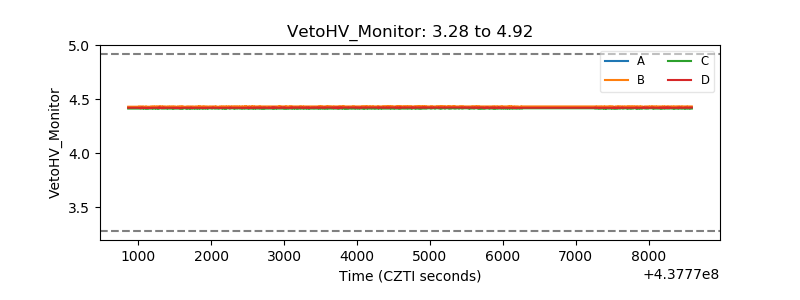 |
| Veto LLD | 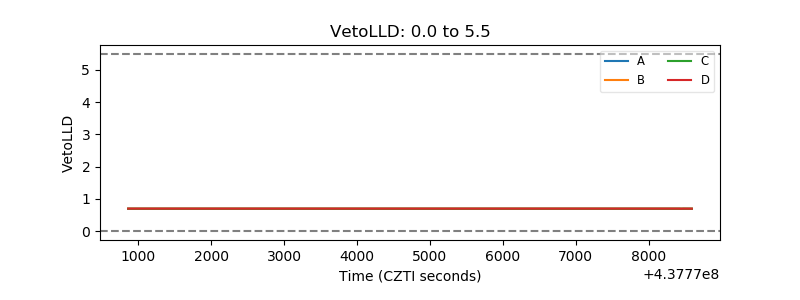 |
| Alpha Counter | 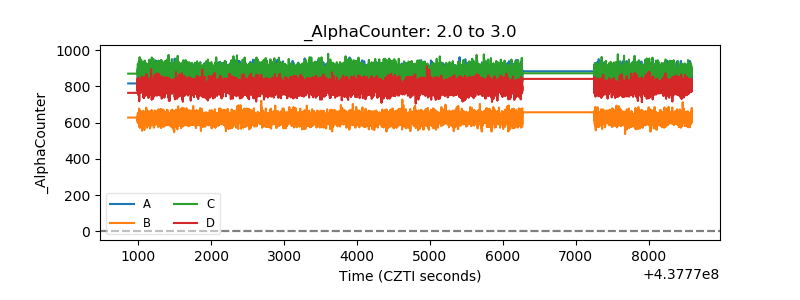 |
| _CPM_Rate | 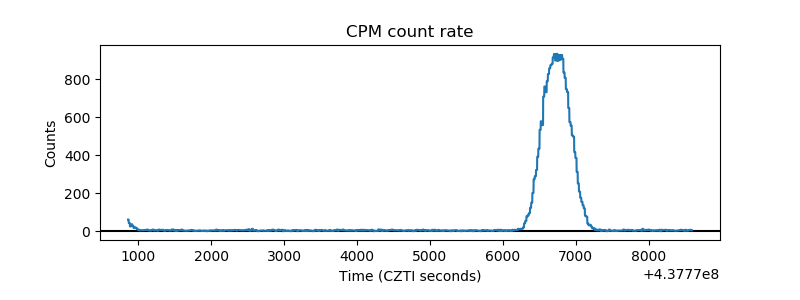 |
| CZT Counter | 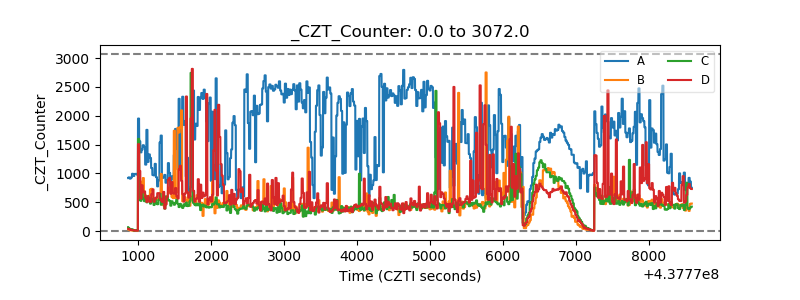 |
| +2.5 Volts monitor | 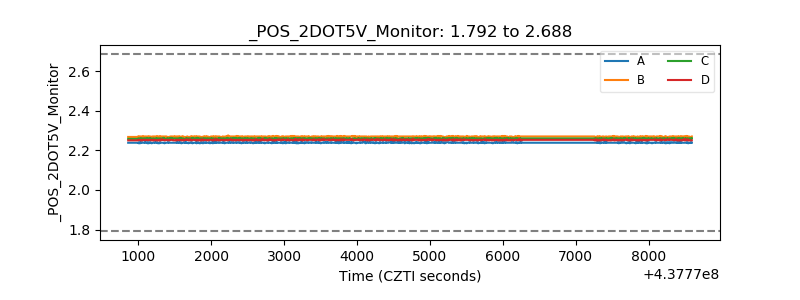 |
| +5 Volts monitor | 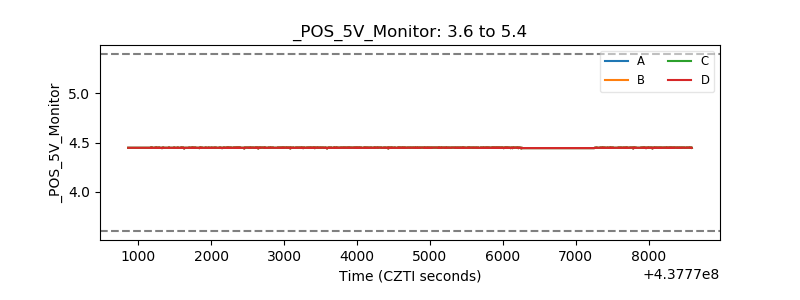 |
| _ROLL_ROT | 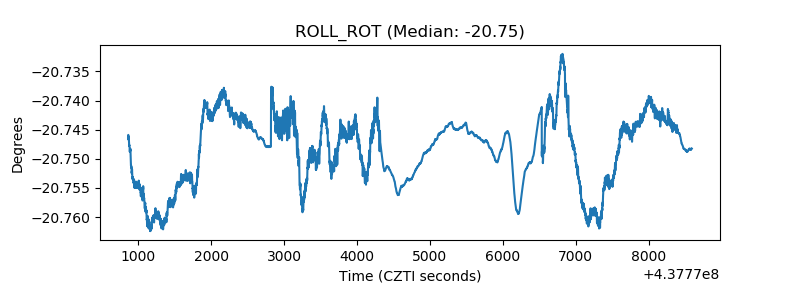 |
| _Roll_DEC | 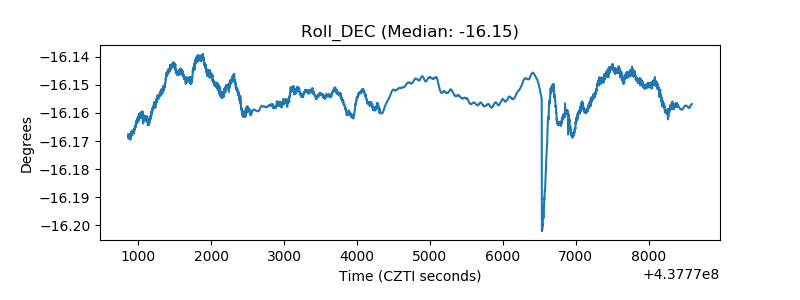 |
| _Roll_RA | 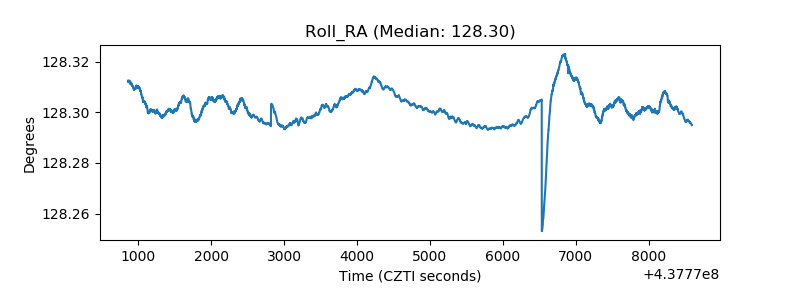 |
| Veto Counter | 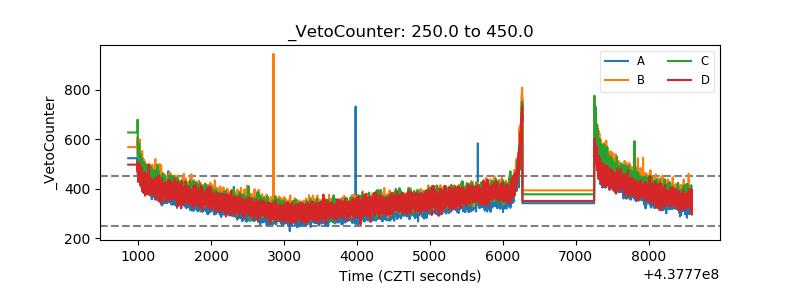 |