| Param | Original file | Final file |
|---|---|---|
| Filename | modeM0/AS1A13_065T06_9000005924_43979cztM0_level2.fits | modeM0/AS1A13_065T06_9000005924_43979cztM0_level2_quad_clean.evt |
| Size (bytes) | 662,863,680 | 98,219,520 |
| Size | 632.2 MB | 93.7 MB |
| Events in quadrant A | 12,459,328 | 256,412 |
| Events in quadrant B | 3,582,106 | 798,565 |
| Events in quadrant C | 3,238,566 | 762,509 |
| Events in quadrant D | 4,724,550 | 679,035 |
| Mode SS | |||
|---|---|---|---|
| Quadrant | BADHDUFLAG | Total packets | Discarded packets |
| A | 0 | 144 | 0 |
| B | 0 | 144 | 0 |
| C | 0 | 144 | 0 |
| D | 0 | 144 | 0 |
| Mode M9 | |||
|---|---|---|---|
| Quadrant | BADHDUFLAG | Total packets | Discarded packets |
| A | 0 | 20 | 0 |
| B | 0 | 20 | 0 |
| C | 0 | 20 | 0 |
| D | 0 | 20 | 0 |
| Mode M0 | |||
|---|---|---|---|
| Quadrant | BADHDUFLAG | Total packets | Discarded packets |
| A | 0 | 41782 | 2 |
| B | 0 | 15362 | 2 |
| C | 0 | 14401 | 2 |
| D | 0 | 18923 | 2 |
| Quadrant | Total seconds | Saturated seconds | Saturation percentage |
|---|---|---|---|
| A | 6840 | 4682 | 68.450292% |
| B | 6840 | 180 | 2.631579% |
| C | 6841 | 46 | 0.672416% |
| D | 6841 | 326 | 4.765385% |
Noise dominated data is calculated using 1-second bins in cleaned event files. If a bin has >2000 counts, and if more than 50% of those come from <1% of pixels, then it is considered to be noise-dominated and hence unusable.
| Quadrant | # 1 sec bins | Bins with >0 counts | Bins with >2000 counts | High rate bins dominated by noise | Noise dominated (total time) | Noise dominated (detector-on time) | Marked lightcurve |
|---|---|---|---|---|---|---|---|
| A | 8970 | 6842 | 3387 | 3387 | 37.76% | 49.50% | 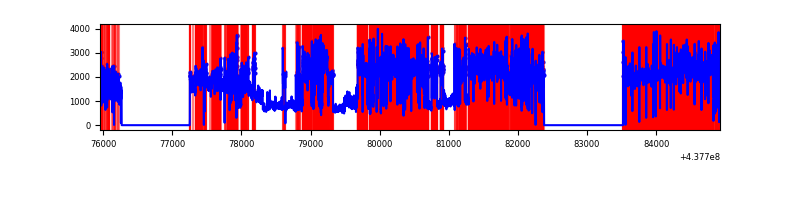 |
| B | 8970 | 6842 | 60 | 60 | 0.67% | 0.88% | 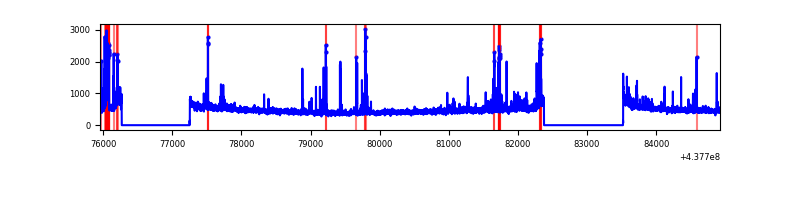 |
| C | 8971 | 6843 | 5 | 5 | 0.06% | 0.07% | 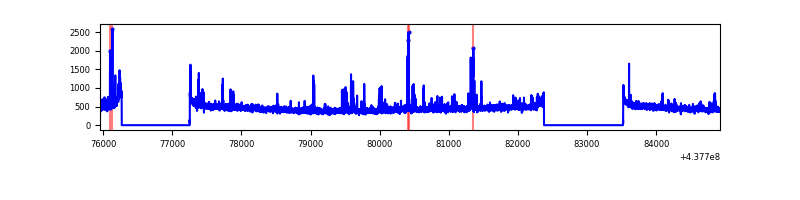 |
| D | 8971 | 6843 | 211 | 211 | 2.35% | 3.08% | 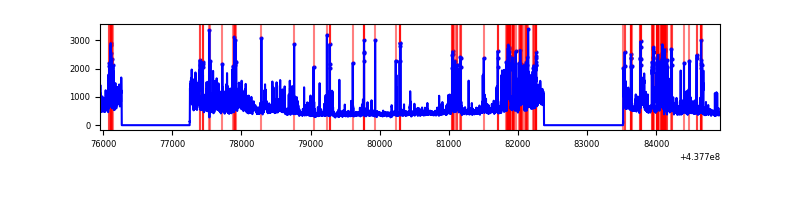 |
Top three noisy pixels from each quadrant. If the there are fewer than three noisy pixels in the level2.evt file, extra rows are filled as -1
| Pixel properties | Quadrant properties | ||||||
|---|---|---|---|---|---|---|---|
| Quadrant | DetID | PixID | Counts | Sigma | Mean | Median | Sigma |
| A | 15 | 223 | 10513852 | 154432.35 | 328 | 322 | 68.1 |
| A | 10 | 83 | 552023 | 8103.89 | 328 | 322 | 68.1 |
| A | 14 | 238 | 106371 | 1557.74 | 328 | 322 | 68.1 |
| B | 5 | 172 | 326391 | 2070.34 | 792 | 767 | 157.3 |
| B | 0 | 213 | 28688 | 177.52 | 792 | 767 | 157.3 |
| B | 0 | 200 | 22649 | 139.13 | 792 | 767 | 157.3 |
| C | 14 | 254 | 107016 | 574.26 | 782 | 788 | 185.0 |
| C | 2 | 14 | 25392 | 133.01 | 782 | 788 | 185.0 |
| C | 15 | 157 | 23330 | 121.86 | 782 | 788 | 185.0 |
| D | 5 | 235 | 509739 | 2669.95 | 763 | 743 | 190.6 |
| D | 4 | 222 | 427381 | 2237.94 | 763 | 743 | 190.6 |
| D | 1 | 52 | 260053 | 1360.21 | 763 | 743 | 190.6 |
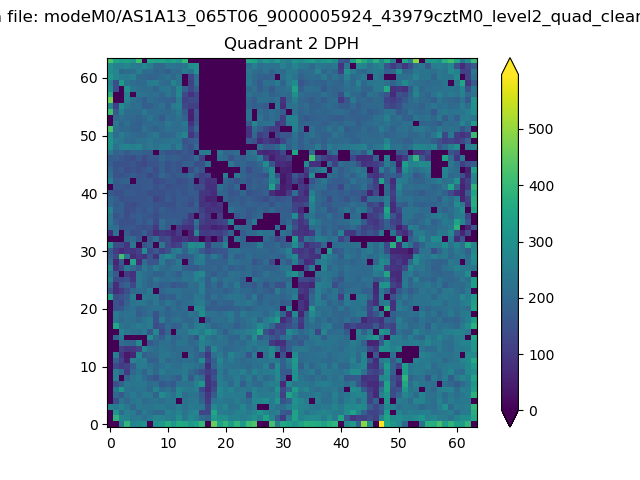
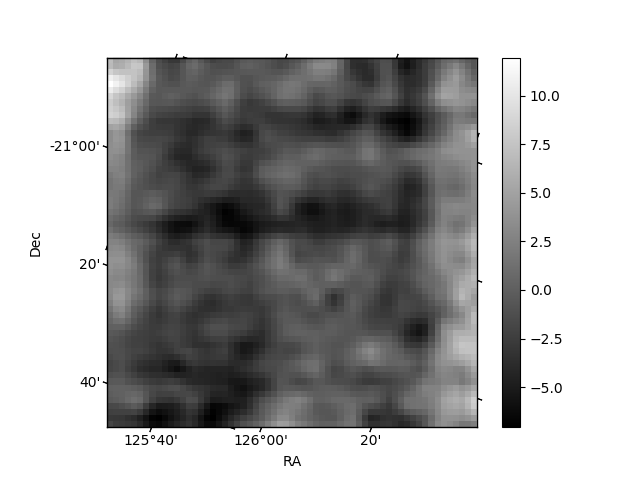
Histogram calculated using DETX and DETY for each event in the final _common_clean file
| Quadrant A | 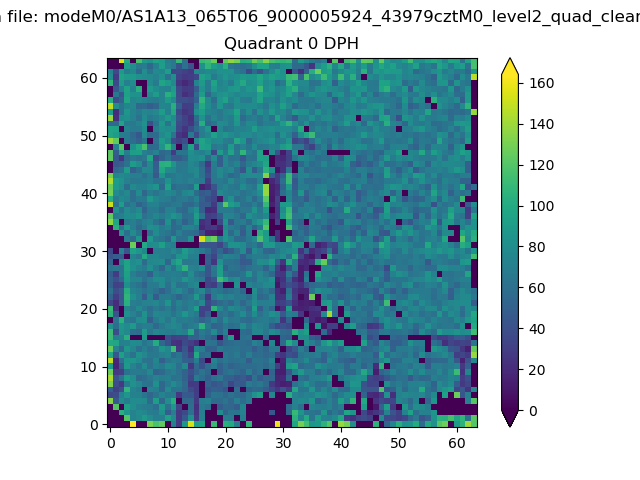 |
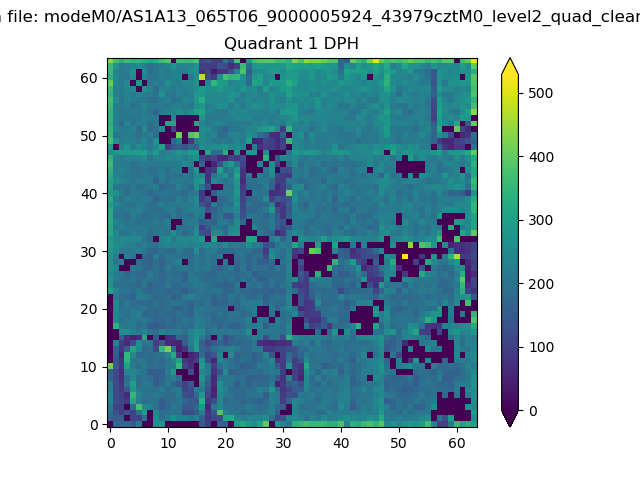 |
Quadrant B |
|---|---|---|---|
| Quadrant D | 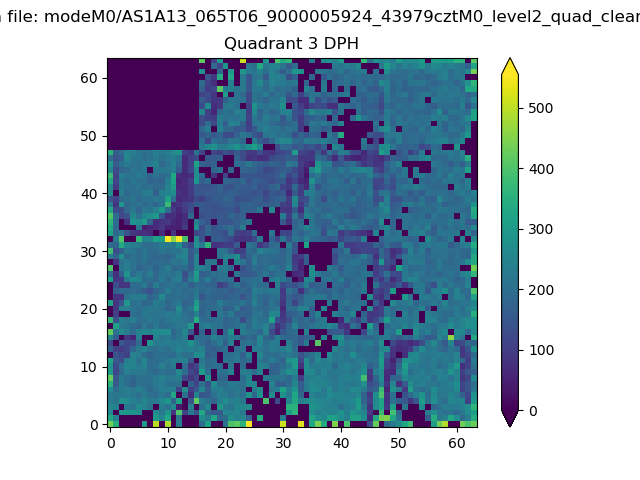 |
 |
Quadrant C |
| Plot type | Count rate plots | Images |
|---|---|---|
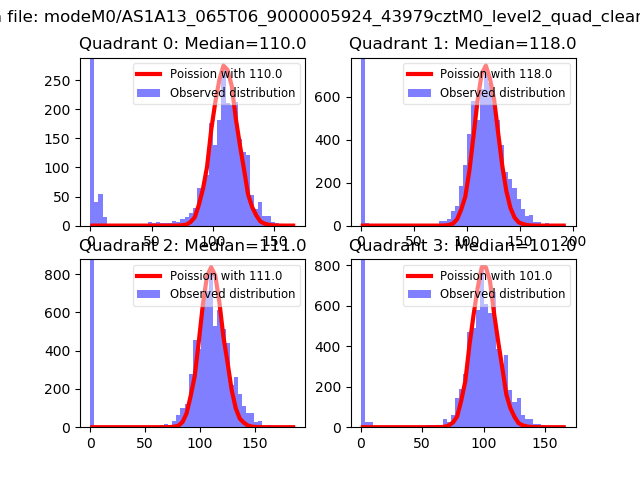
| Comparison with Poisson distribution Blue bars denote a histogram of data divided into 1 sec bins. Red curve is a Poisson curve with rate = median count rate of data. |
 |
 |
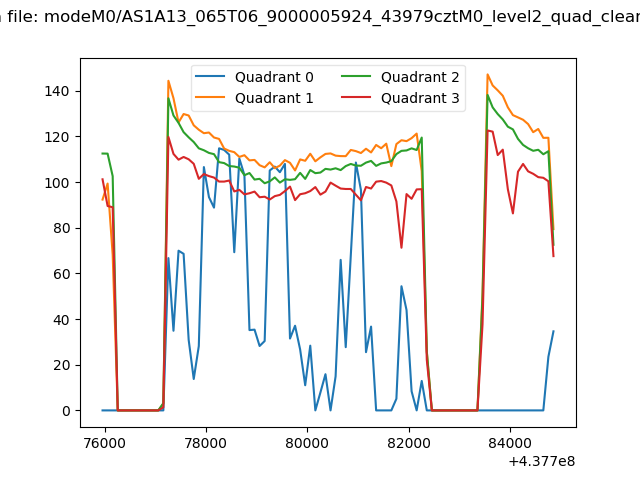
| Quadrant-wise count rates Data is divided into 100 sec bins |
 |
|
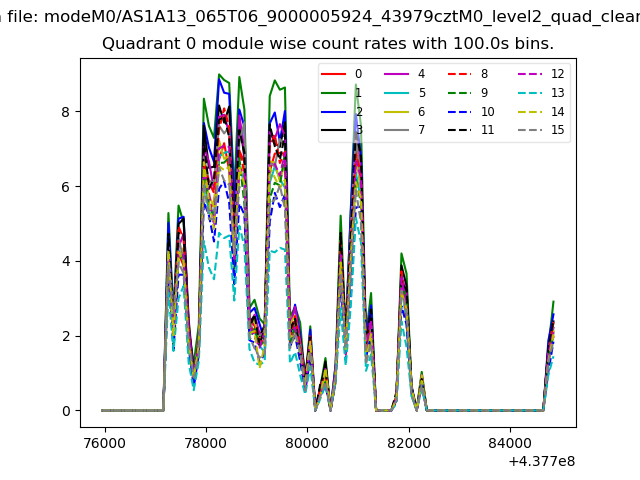
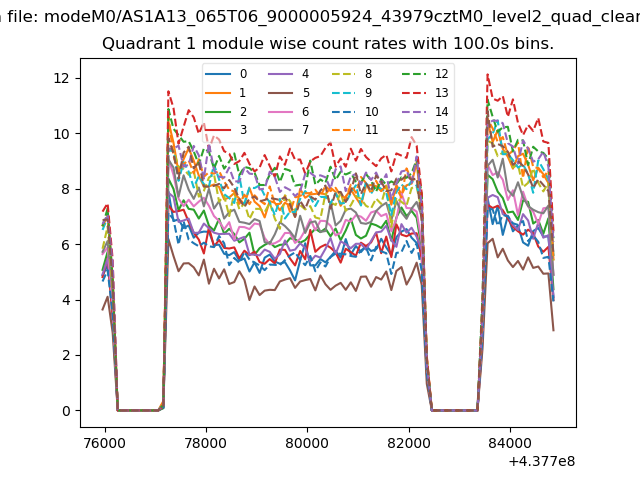
| Module-wise count rates for Quadrant A Data is divided into 100 sec bins |
 |
 |
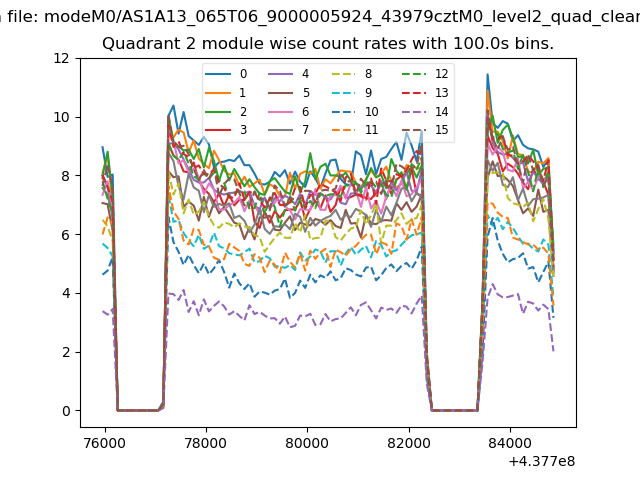
| Module-wise count rates for Quadrant B Data is divided into 100 sec bins |
 |
 |
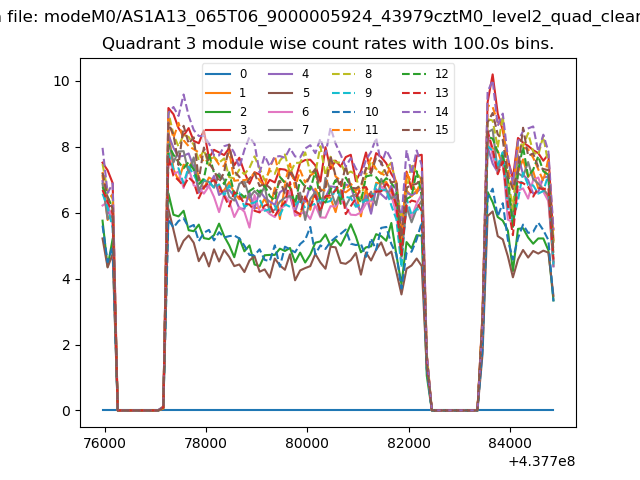
| Module-wise count rates for Quadrant C Data is divided into 100 sec bins |
 |
 |
| Module-wise count rates for Quadrant D Data is divided into 100 sec bins |
 |
 |
| Parameter | Plot |
|---|---|
| CZT HV Monitor | 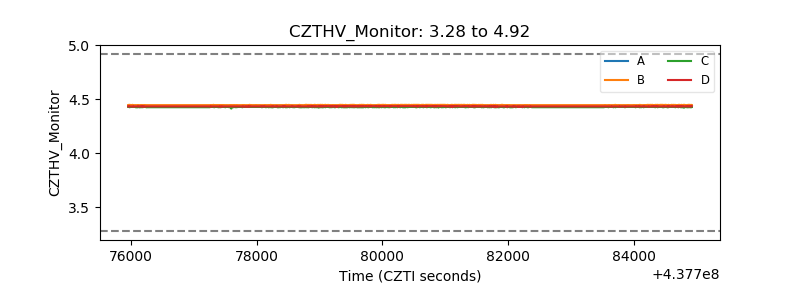 |
| D_VDD | 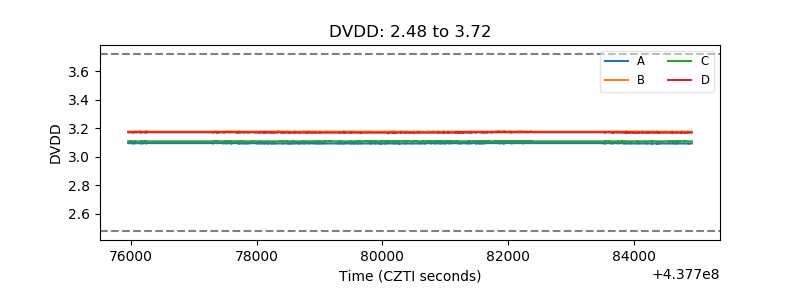 |
| Temperature 1 | 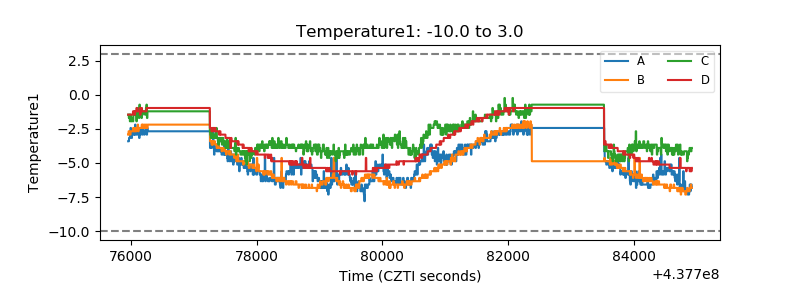 |
| Veto HV Monitor |  |
| Veto LLD | 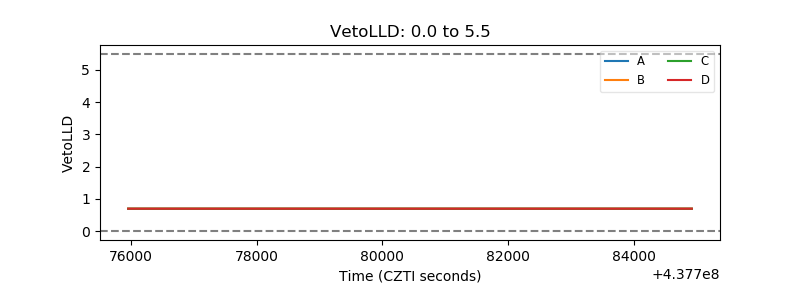 |
| Alpha Counter | 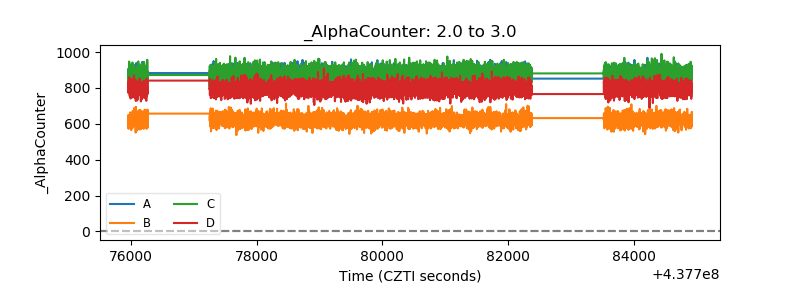 |
| _CPM_Rate | 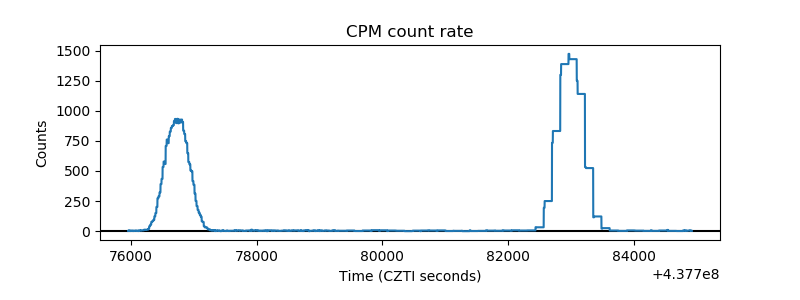 |
| CZT Counter | 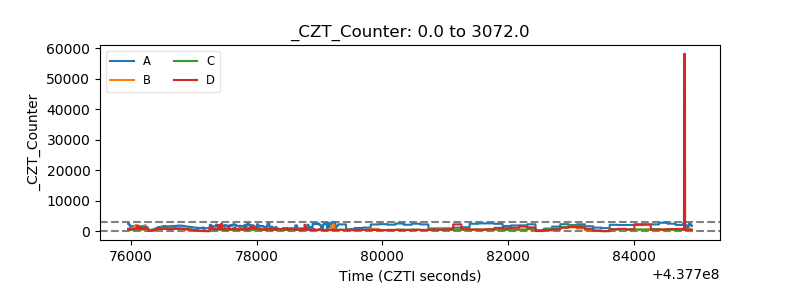 |
| +2.5 Volts monitor | 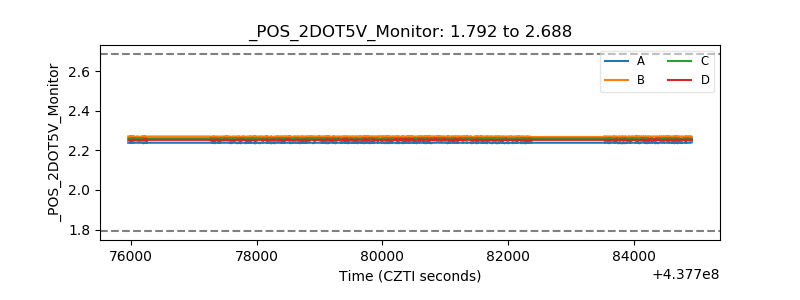 |
| +5 Volts monitor | 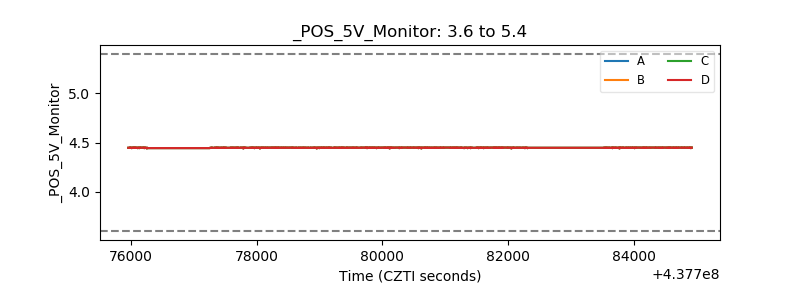 |
| _ROLL_ROT | 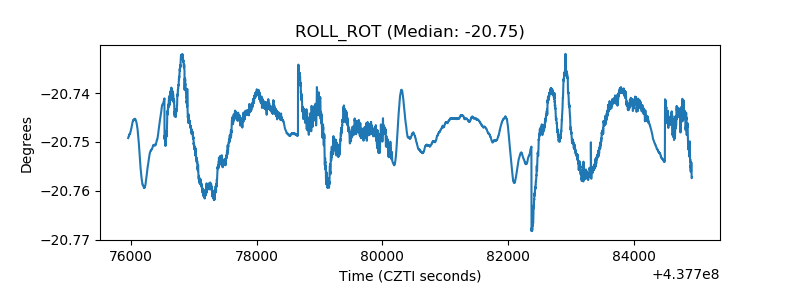 |
| _Roll_DEC | 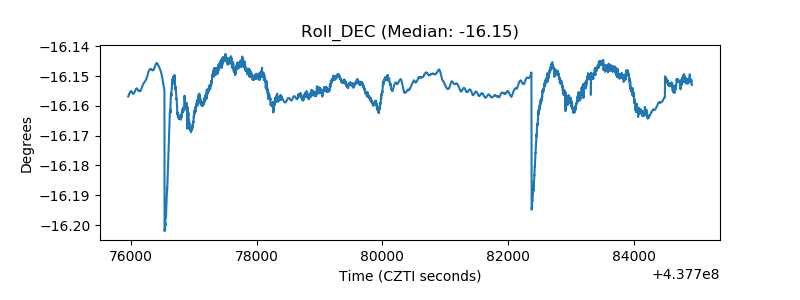 |
| _Roll_RA | 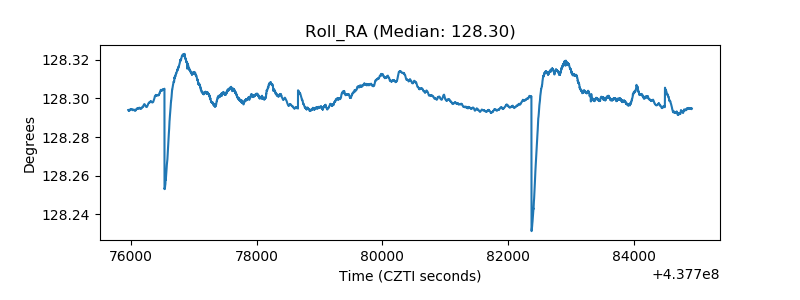 |
| Veto Counter | 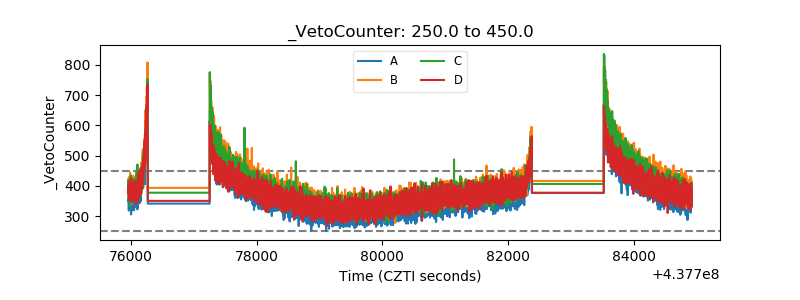 |