| Param | Original file | Final file |
|---|---|---|
| Filename | modeM0/AS1A13_065T06_9000005924_43980cztM0_level2.fits | modeM0/AS1A13_065T06_9000005924_43980cztM0_level2_quad_clean.evt |
| Size (bytes) | 766,203,840 | 88,801,920 |
| Size | 730.7 MB | 84.7 MB |
| Events in quadrant A | 14,089,642 | 27,972 |
| Events in quadrant B | 3,938,927 | 809,296 |
| Events in quadrant C | 3,161,052 | 792,201 |
| Events in quadrant D | 6,641,636 | 584,062 |
| Mode SS | |||
|---|---|---|---|
| Quadrant | BADHDUFLAG | Total packets | Discarded packets |
| A | 0 | 140 | 0 |
| B | 0 | 140 | 0 |
| C | 0 | 140 | 0 |
| D | 0 | 140 | 0 |
| Mode M9 | |||
|---|---|---|---|
| Quadrant | BADHDUFLAG | Total packets | Discarded packets |
| A | 0 | 14 | 0 |
| B | 0 | 15 | 0 |
| C | 0 | 15 | 0 |
| D | 0 | 15 | 0 |
| Mode M0 | |||
|---|---|---|---|
| Quadrant | BADHDUFLAG | Total packets | Discarded packets |
| A | 0 | 46553 | 2 |
| B | 0 | 16275 | 2 |
| C | 0 | 14097 | 2 |
| D | 0 | 24564 | 2 |
| Quadrant | Total seconds | Saturated seconds | Saturation percentage |
|---|---|---|---|
| A | 6816 | 6582 | 96.566901% |
| B | 6815 | 287 | 4.211299% |
| C | 6815 | 19 | 0.278797% |
| D | 6815 | 1297 | 19.031548% |
Noise dominated data is calculated using 1-second bins in cleaned event files. If a bin has >2000 counts, and if more than 50% of those come from <1% of pixels, then it is considered to be noise-dominated and hence unusable.
| Quadrant | # 1 sec bins | Bins with >0 counts | Bins with >2000 counts | High rate bins dominated by noise | Noise dominated (total time) | Noise dominated (detector-on time) | Marked lightcurve |
|---|---|---|---|---|---|---|---|
| A | 7986 | 6816 | 3974 | 3974 | 49.76% | 58.30% | 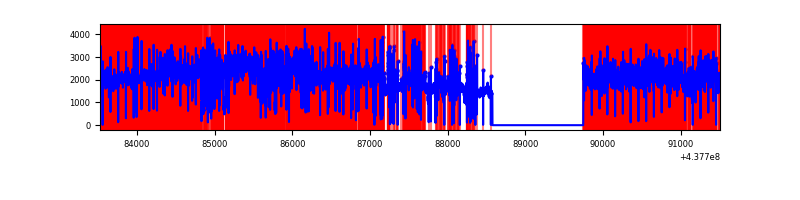 |
| B | 7985 | 6816 | 175 | 175 | 2.19% | 2.57% | 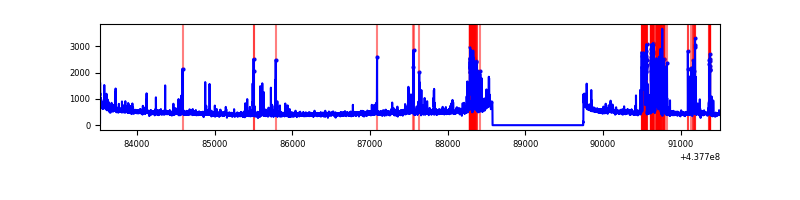 |
| C | 7985 | 6816 | 2 | 2 | 0.03% | 0.03% | 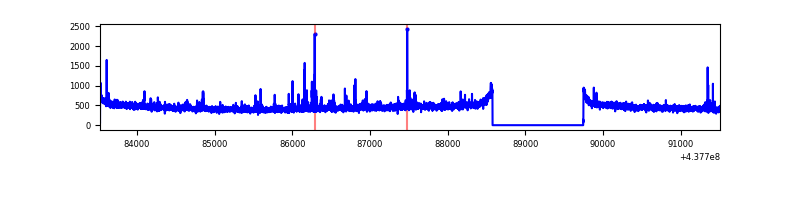 |
| D | 7985 | 6816 | 1176 | 1176 | 14.73% | 17.25% | 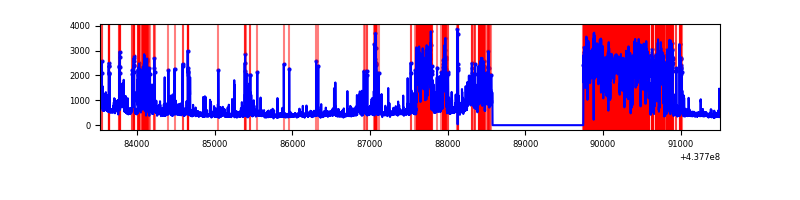 |
Top three noisy pixels from each quadrant. If the there are fewer than three noisy pixels in the level2.evt file, extra rows are filled as -1
| Pixel properties | Quadrant properties | ||||||
|---|---|---|---|---|---|---|---|
| Quadrant | DetID | PixID | Counts | Sigma | Mean | Median | Sigma |
| A | 15 | 223 | 13379739 | 713620.19 | 82 | 80 | 18.7 |
| A | 14 | 238 | 185005 | 9863.2 | 82 | 80 | 18.7 |
| A | 10 | 83 | 135822 | 7239.96 | 82 | 80 | 18.7 |
| B | 5 | 172 | 409484 | 2623.66 | 787 | 762 | 155.8 |
| B | 4 | 171 | 296787 | 1900.24 | 787 | 762 | 155.8 |
| B | 4 | 158 | 32293 | 202.4 | 787 | 762 | 155.8 |
| C | 15 | 157 | 45483 | 241.65 | 784 | 792 | 184.9 |
| C | 14 | 254 | 28200 | 148.2 | 784 | 792 | 184.9 |
| C | 3 | 233 | 23244 | 121.4 | 784 | 792 | 184.9 |
| D | 5 | 235 | 3136686 | 18017.57 | 689 | 669 | 174.1 |
| D | 1 | 52 | 255512 | 1464.17 | 689 | 669 | 174.1 |
| D | 4 | 222 | 123002 | 702.85 | 689 | 669 | 174.1 |
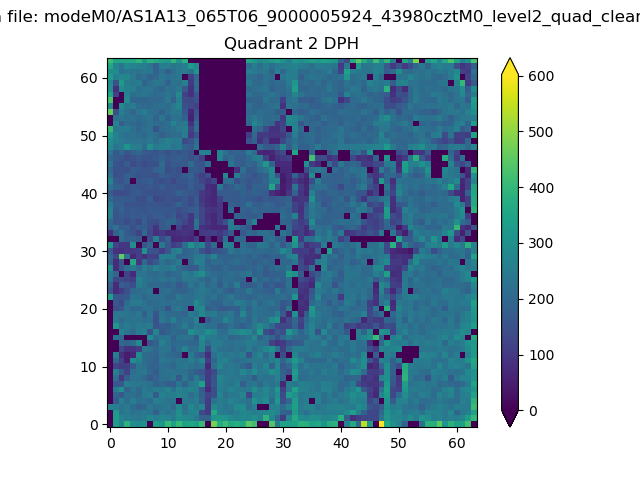
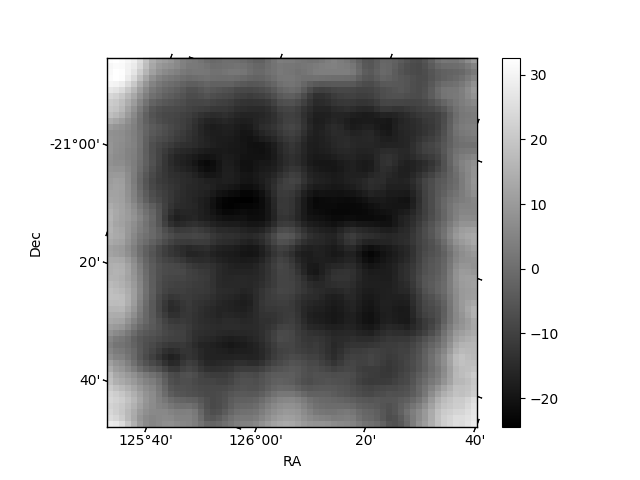
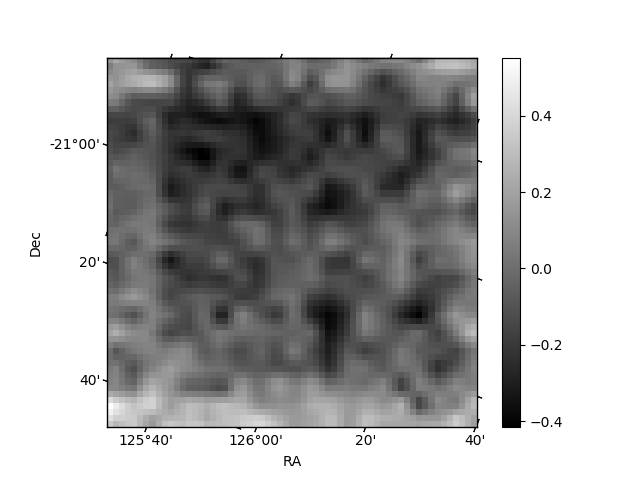
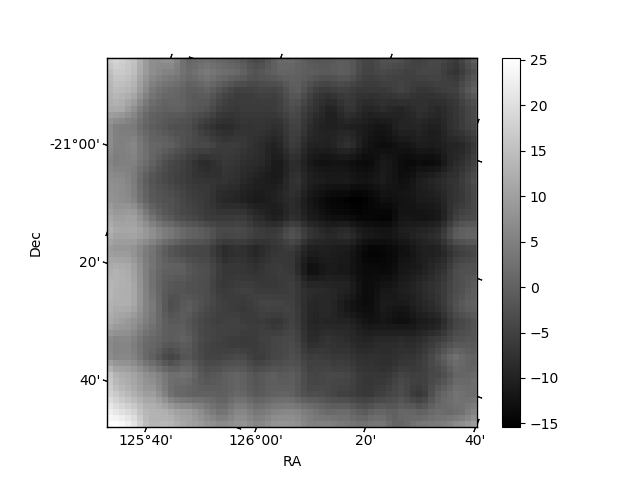
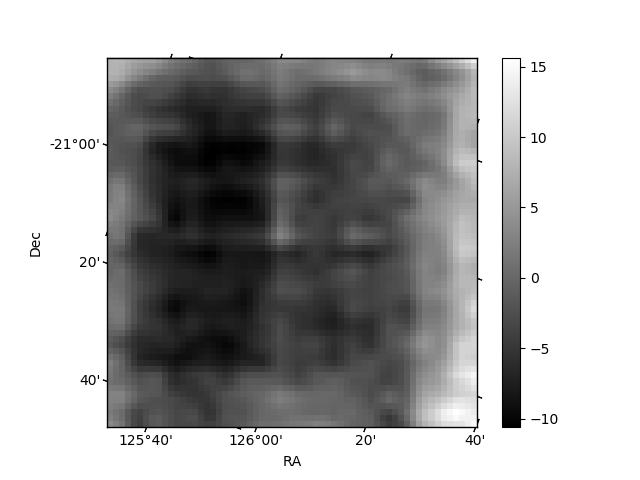
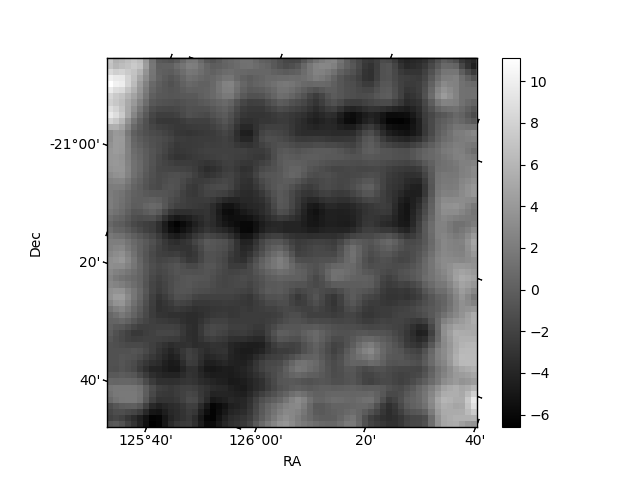
Histogram calculated using DETX and DETY for each event in the final _common_clean file
| Quadrant A | 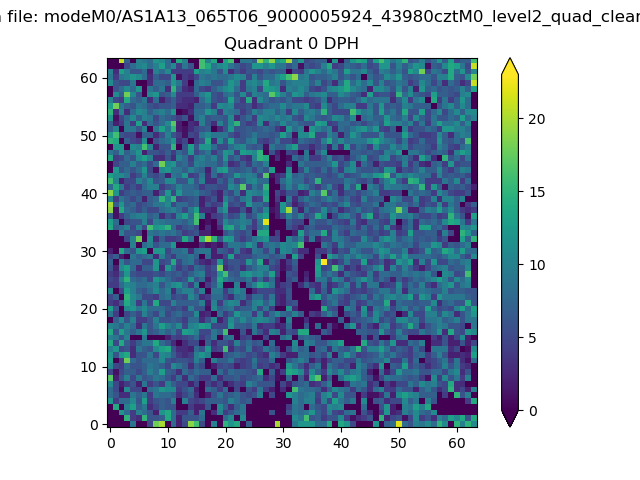 |
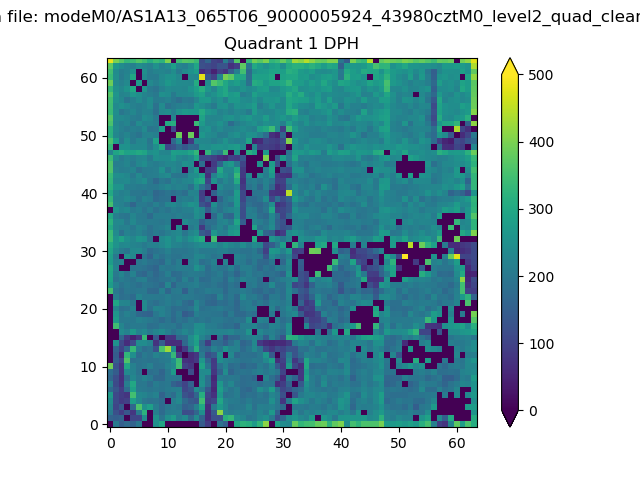 |
Quadrant B |
|---|---|---|---|
| Quadrant D | 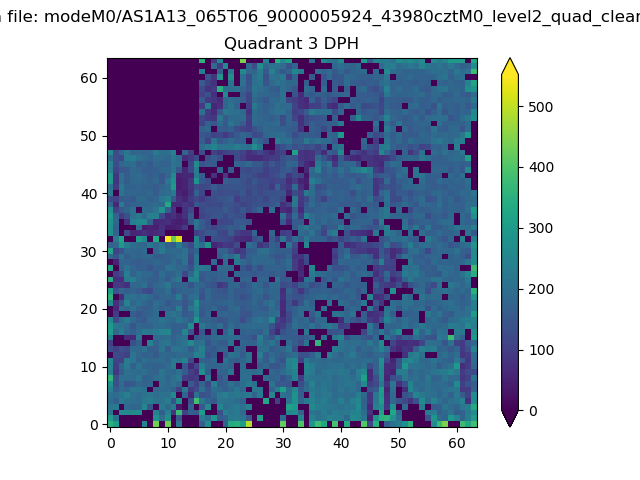 |
 |
Quadrant C |
| Plot type | Count rate plots | Images |
|---|---|---|
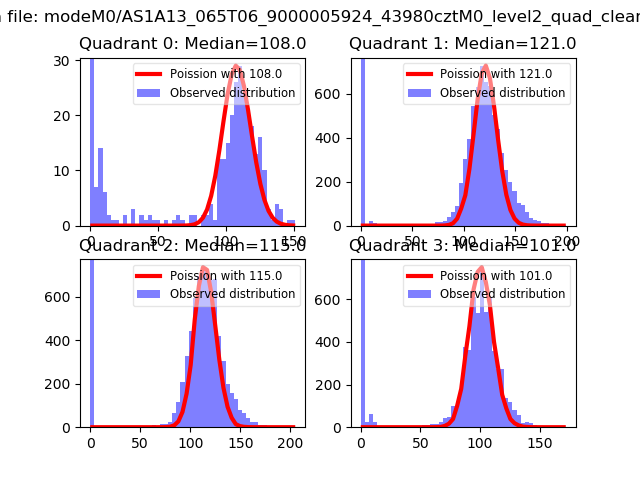
| Comparison with Poisson distribution Blue bars denote a histogram of data divided into 1 sec bins. Red curve is a Poisson curve with rate = median count rate of data. |
 |
 |
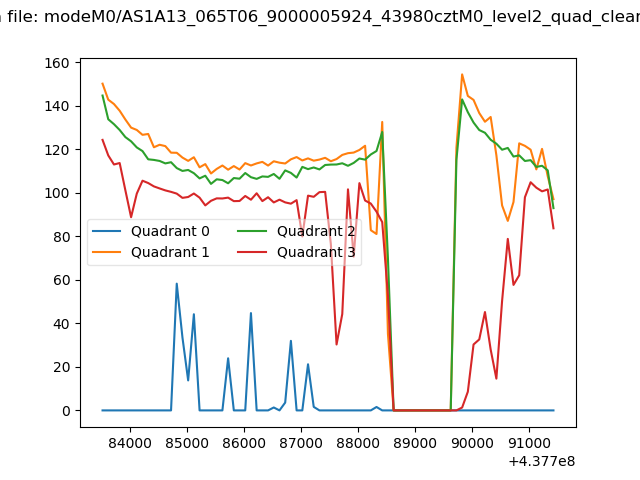
| Quadrant-wise count rates Data is divided into 100 sec bins |
 |
|
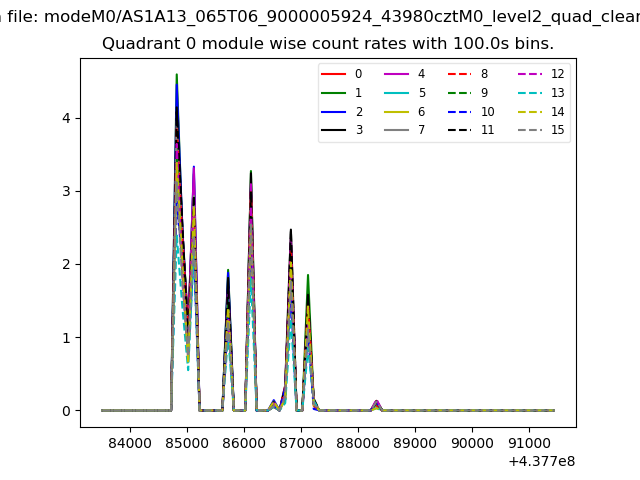
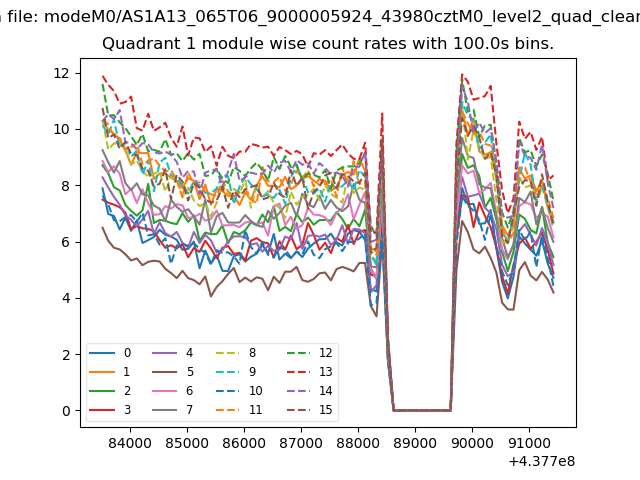
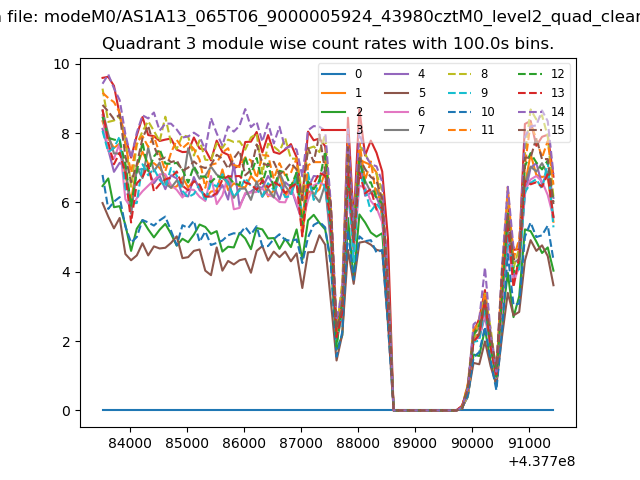
| Module-wise count rates for Quadrant A Data is divided into 100 sec bins |
 |
 |
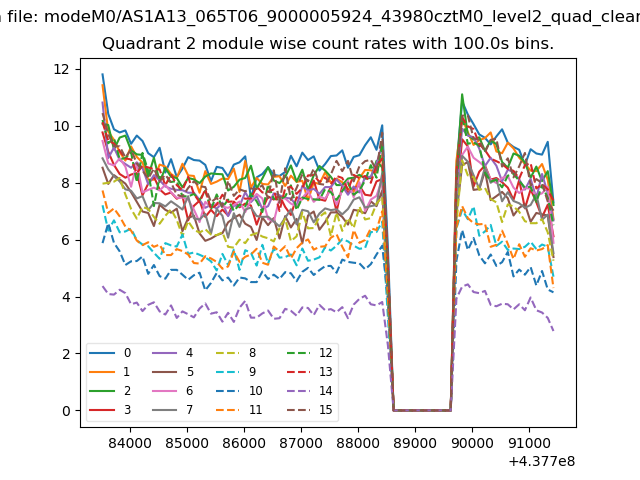
| Module-wise count rates for Quadrant B Data is divided into 100 sec bins |
 |
 |
| Module-wise count rates for Quadrant C Data is divided into 100 sec bins |
 |
 |
| Module-wise count rates for Quadrant D Data is divided into 100 sec bins |
 |
 |
| Parameter | Plot |
|---|---|
| CZT HV Monitor | 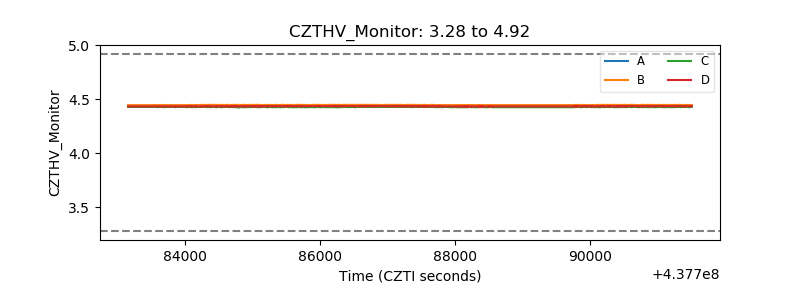 |
| D_VDD | 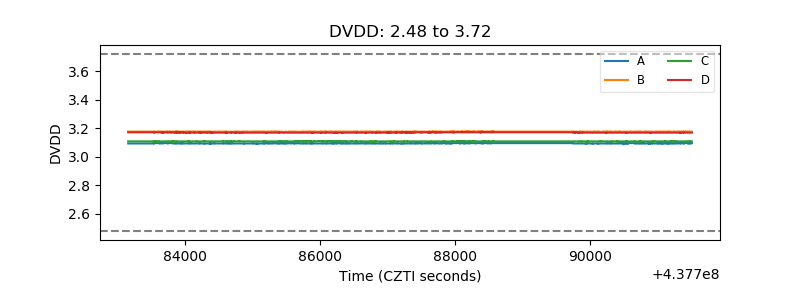 |
| Temperature 1 | 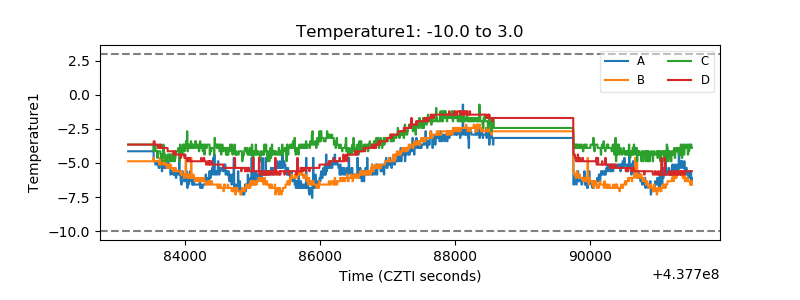 |
| Veto HV Monitor | 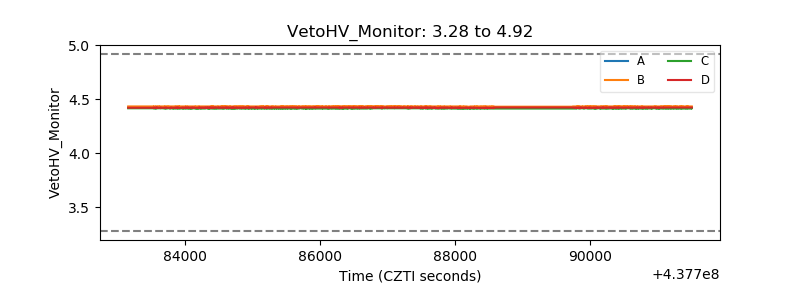 |
| Veto LLD | 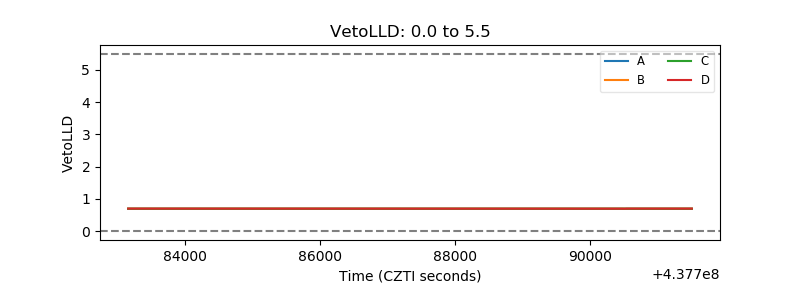 |
| Alpha Counter | 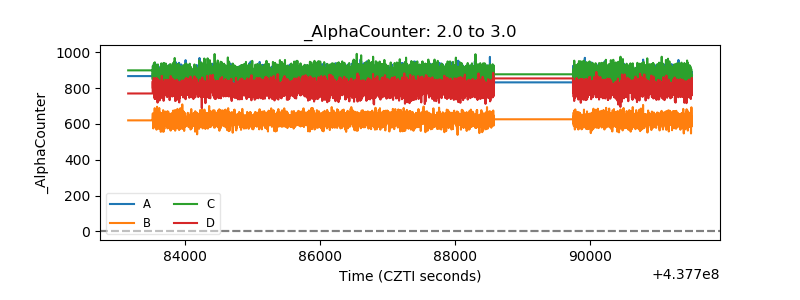 |
| _CPM_Rate | 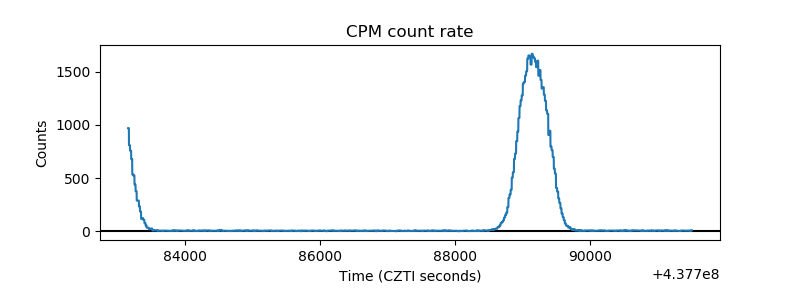 |
| CZT Counter | 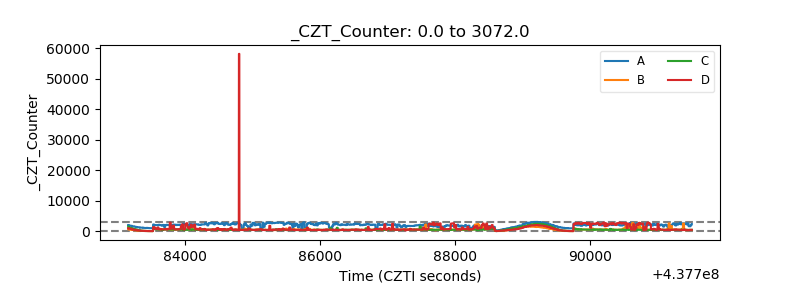 |
| +2.5 Volts monitor | 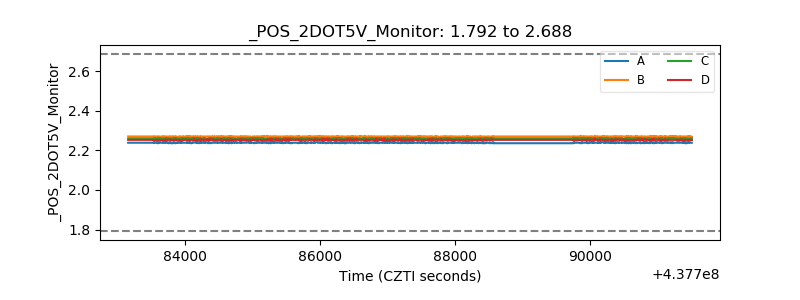 |
| +5 Volts monitor | 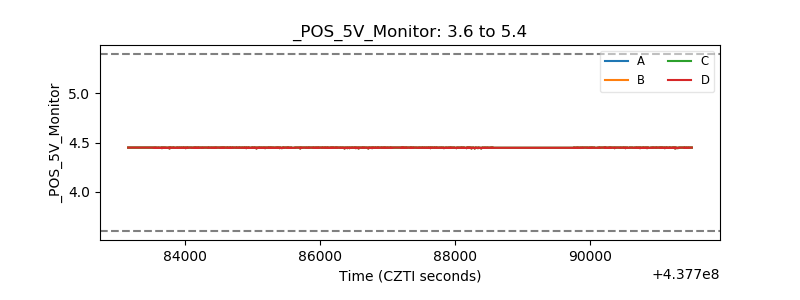 |
| _ROLL_ROT | 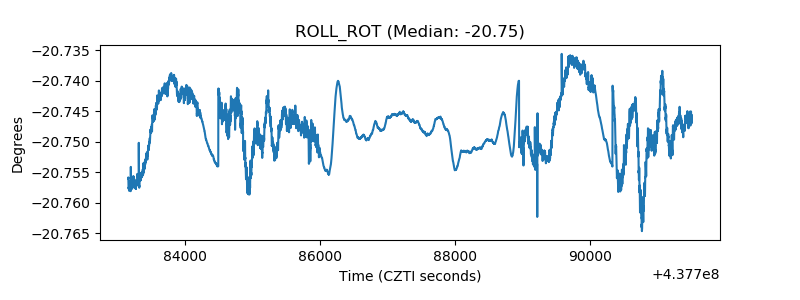 |
| _Roll_DEC | 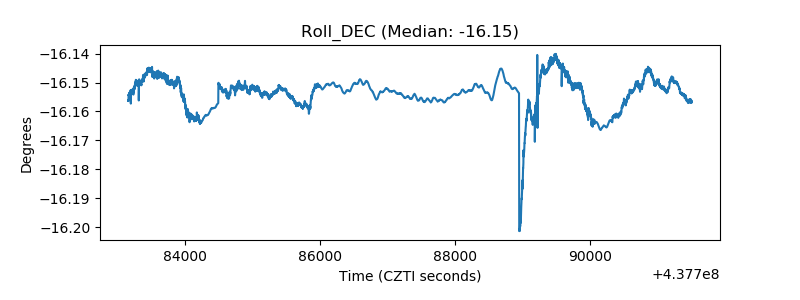 |
| _Roll_RA | 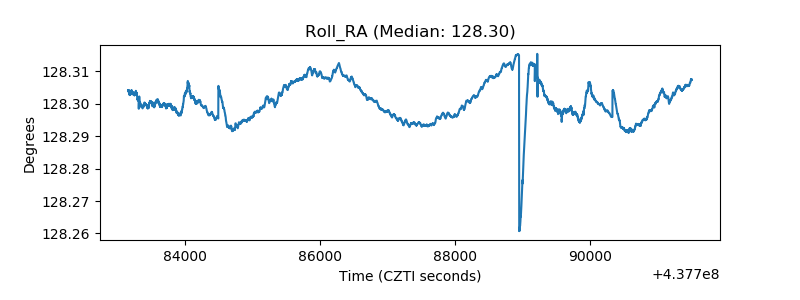 |
| Veto Counter | 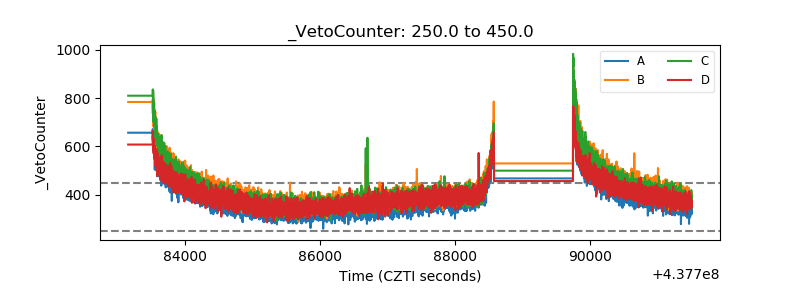 |