| Param | Original file | Final file |
|---|---|---|
| Filename | modeM0/AS1A13_065T06_9000005924_43981cztM0_level2.fits | modeM0/AS1A13_065T06_9000005924_43981cztM0_level2_quad_clean.evt |
| Size (bytes) | 781,018,560 | 87,756,480 |
| Size | 744.8 MB | 83.7 MB |
| Events in quadrant A | 14,787,140 | 29,850 |
| Events in quadrant B | 4,595,716 | 772,552 |
| Events in quadrant C | 3,153,492 | 785,641 |
| Events in quadrant D | 5,854,417 | 603,265 |
| Mode SS | |||
|---|---|---|---|
| Quadrant | BADHDUFLAG | Total packets | Discarded packets |
| A | 0 | 136 | 0 |
| B | 0 | 136 | 0 |
| C | 0 | 136 | 0 |
| D | 0 | 136 | 0 |
| Mode M9 | |||
|---|---|---|---|
| Quadrant | BADHDUFLAG | Total packets | Discarded packets |
| A | 0 | 14 | 0 |
| B | 0 | 15 | 0 |
| C | 0 | 15 | 0 |
| D | 0 | 15 | 0 |
| Mode M0 | |||
|---|---|---|---|
| Quadrant | BADHDUFLAG | Total packets | Discarded packets |
| A | 0 | 48482 | 2 |
| B | 0 | 18106 | 2 |
| C | 0 | 13912 | 2 |
| D | 0 | 22028 | 2 |
| Quadrant | Total seconds | Saturated seconds | Saturation percentage |
|---|---|---|---|
| A | 6681 | 6456 | 96.632241% |
| B | 6681 | 589 | 8.816046% |
| C | 6681 | 19 | 0.284389% |
| D | 6681 | 1020 | 15.267176% |
Noise dominated data is calculated using 1-second bins in cleaned event files. If a bin has >2000 counts, and if more than 50% of those come from <1% of pixels, then it is considered to be noise-dominated and hence unusable.
| Quadrant | # 1 sec bins | Bins with >0 counts | Bins with >2000 counts | High rate bins dominated by noise | Noise dominated (total time) | Noise dominated (detector-on time) | Marked lightcurve |
|---|---|---|---|---|---|---|---|
| A | 7885 | 6681 | 4878 | 4878 | 61.86% | 73.01% | 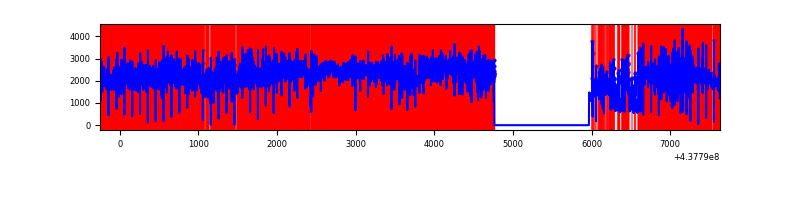 |
| B | 7886 | 6682 | 421 | 421 | 5.34% | 6.30% | 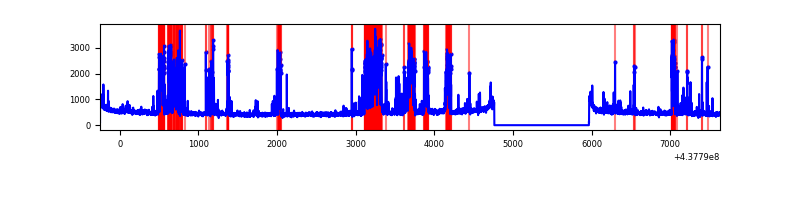 |
| C | 7886 | 6682 | 6 | 6 | 0.08% | 0.09% | 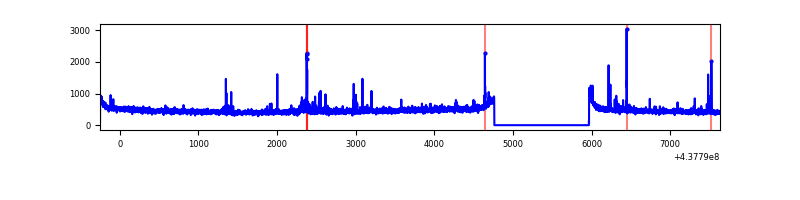 |
| D | 7886 | 6682 | 896 | 896 | 11.36% | 13.41% | 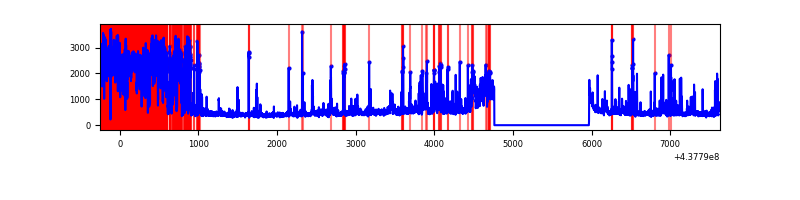 |
Top three noisy pixels from each quadrant. If the there are fewer than three noisy pixels in the level2.evt file, extra rows are filled as -1
| Pixel properties | Quadrant properties | ||||||
|---|---|---|---|---|---|---|---|
| Quadrant | DetID | PixID | Counts | Sigma | Mean | Median | Sigma |
| A | 15 | 223 | 13760881 | 483126.39 | 127 | 124 | 28.5 |
| A | 14 | 238 | 213183 | 7480.29 | 127 | 124 | 28.5 |
| A | 10 | 83 | 209564 | 7353.23 | 127 | 124 | 28.5 |
| B | 5 | 172 | 1168060 | 7775.02 | 762 | 739 | 150.1 |
| B | 4 | 171 | 348977 | 2319.46 | 762 | 739 | 150.1 |
| B | 12 | 111 | 18566 | 118.74 | 762 | 739 | 150.1 |
| C | 14 | 254 | 59351 | 319.71 | 778 | 784 | 183.2 |
| C | 2 | 14 | 21711 | 114.24 | 778 | 784 | 183.2 |
| C | 15 | 157 | 21197 | 111.43 | 778 | 784 | 183.2 |
| D | 5 | 235 | 2200827 | 12300.67 | 703 | 681 | 178.9 |
| D | 1 | 52 | 403737 | 2253.42 | 703 | 681 | 178.9 |
| D | 4 | 222 | 141440 | 786.96 | 703 | 681 | 178.9 |
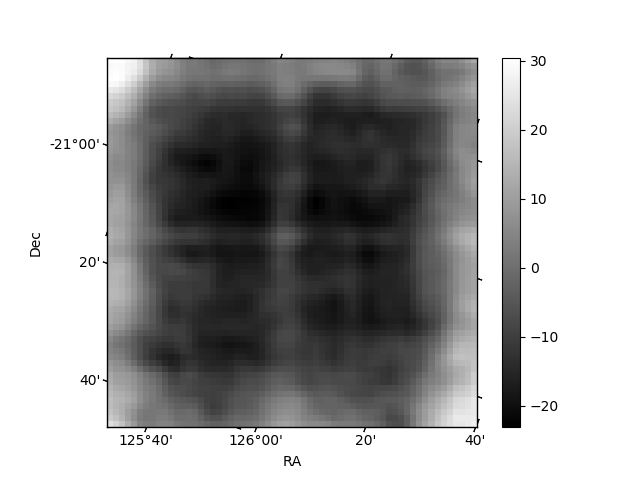
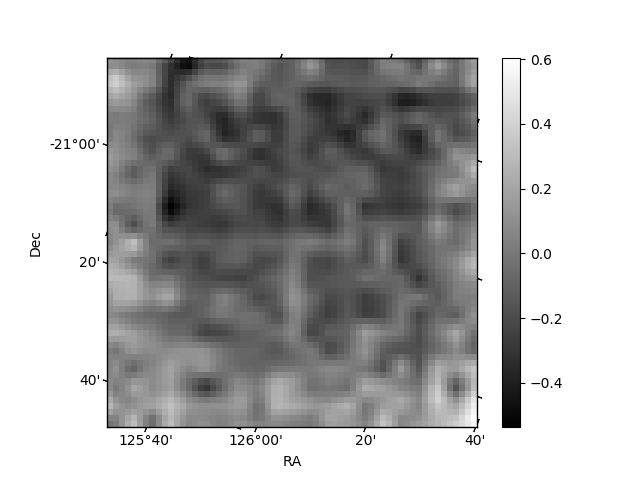
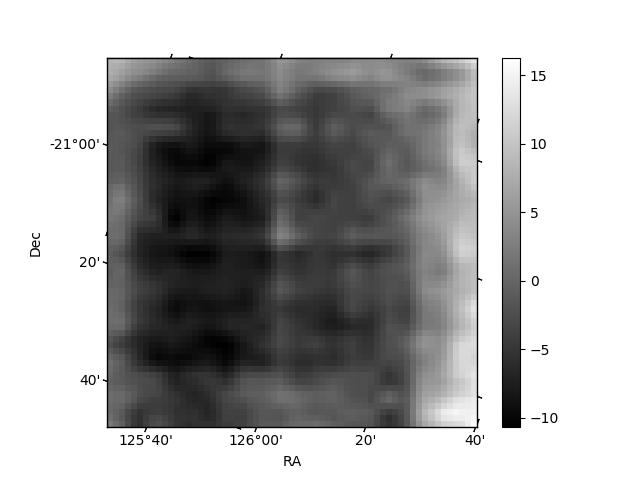
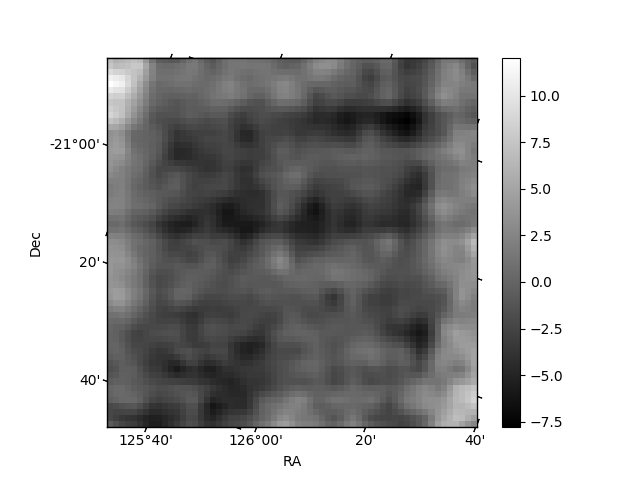
Histogram calculated using DETX and DETY for each event in the final _common_clean file
| Quadrant A | 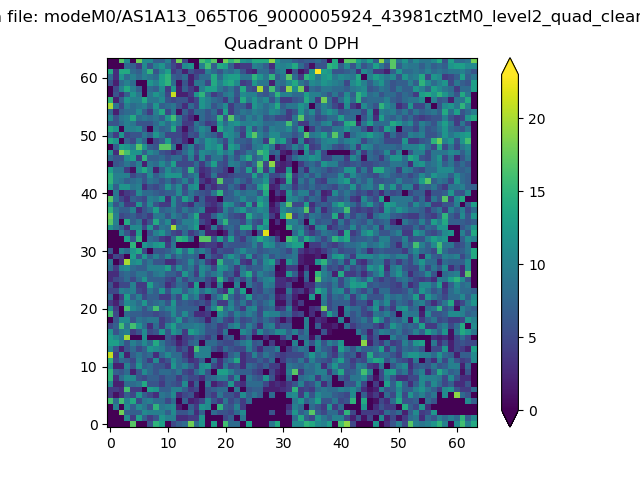 |
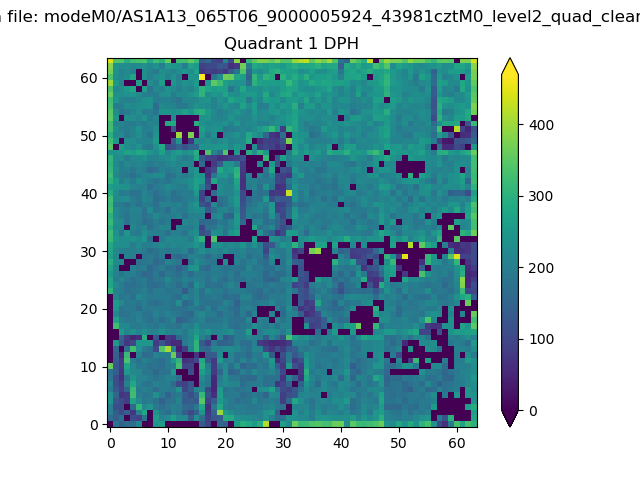 |
Quadrant B |
|---|---|---|---|
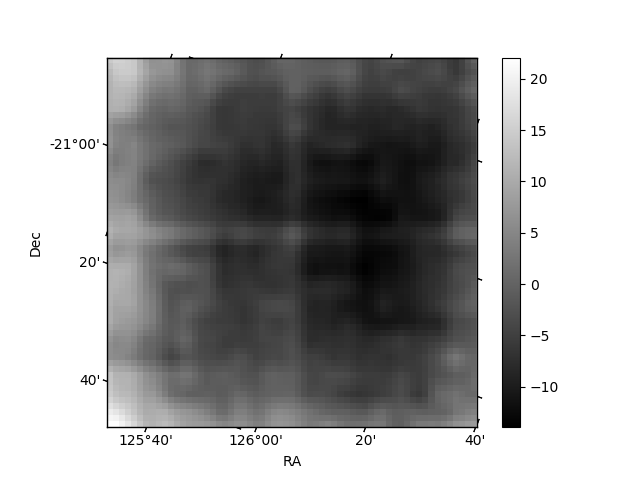
| Quadrant D | 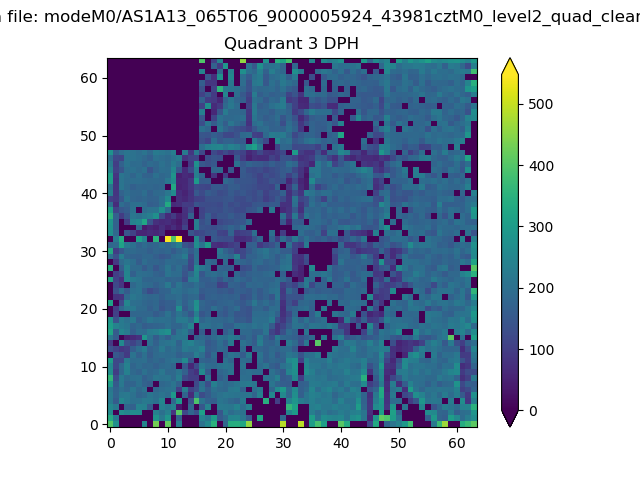 |
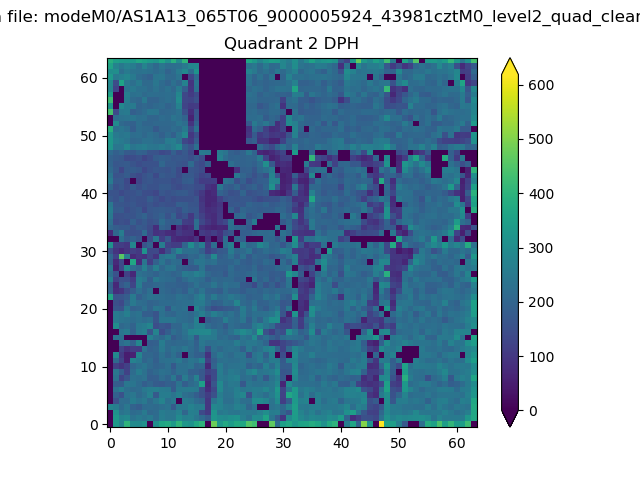 |
Quadrant C |
| Plot type | Count rate plots | Images |
|---|---|---|
| Comparison with Poisson distribution Blue bars denote a histogram of data divided into 1 sec bins. Red curve is a Poisson curve with rate = median count rate of data. |
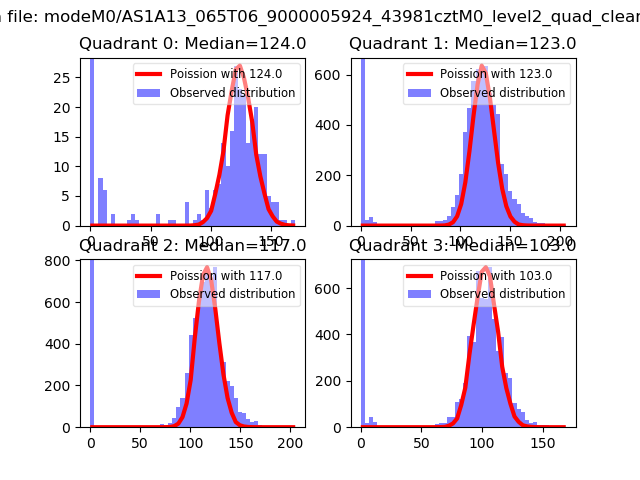 |
 |
| Quadrant-wise count rates Data is divided into 100 sec bins |
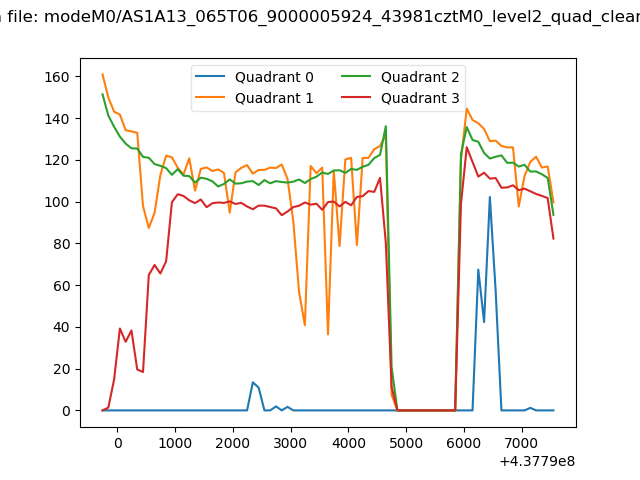 |
|
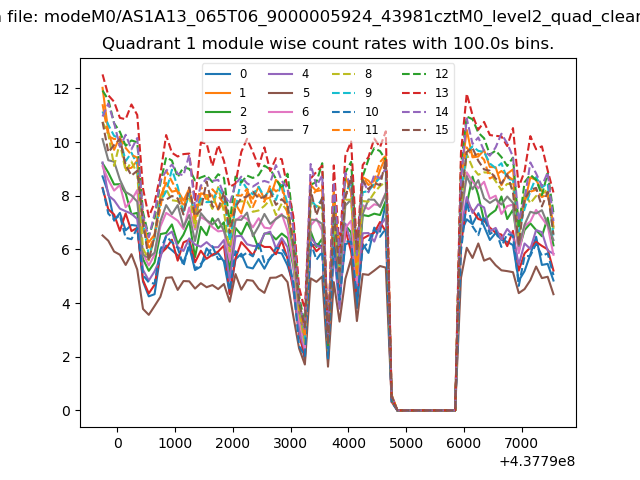
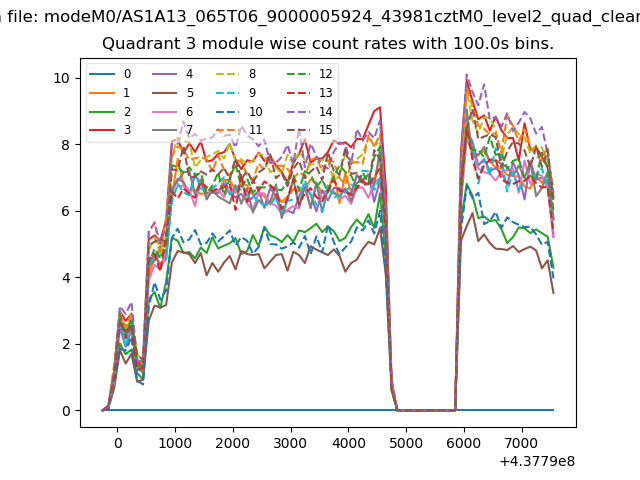
| Module-wise count rates for Quadrant A Data is divided into 100 sec bins |
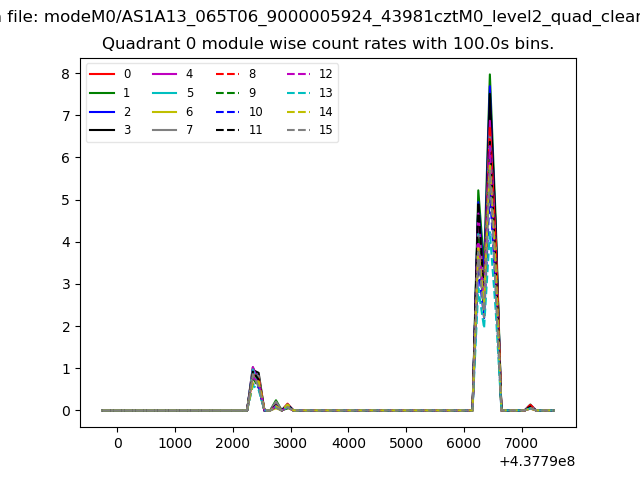 |
 |
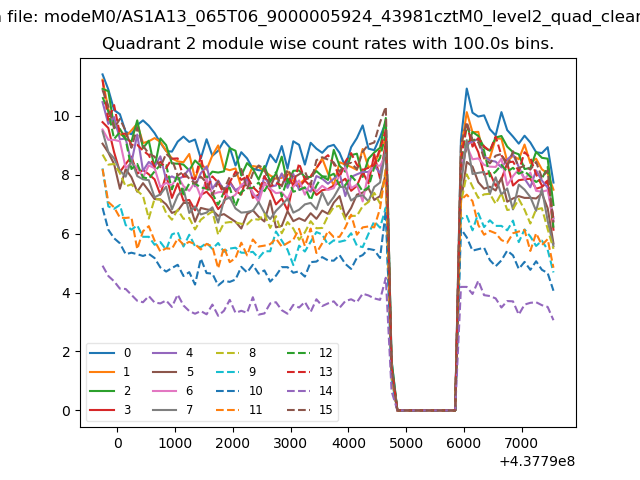
| Module-wise count rates for Quadrant B Data is divided into 100 sec bins |
 |
 |
| Module-wise count rates for Quadrant C Data is divided into 100 sec bins |
 |
 |
| Module-wise count rates for Quadrant D Data is divided into 100 sec bins |
 |
 |
| Parameter | Plot |
|---|---|
| CZT HV Monitor | 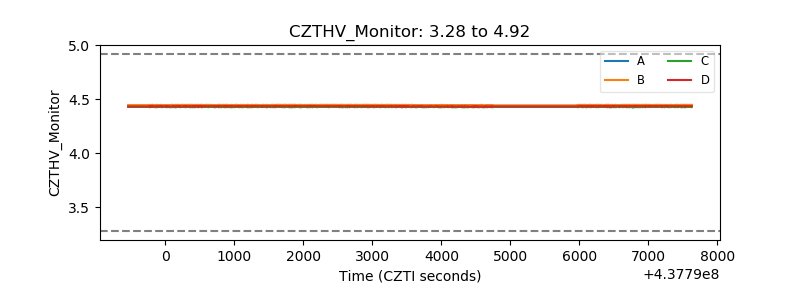 |
| D_VDD | 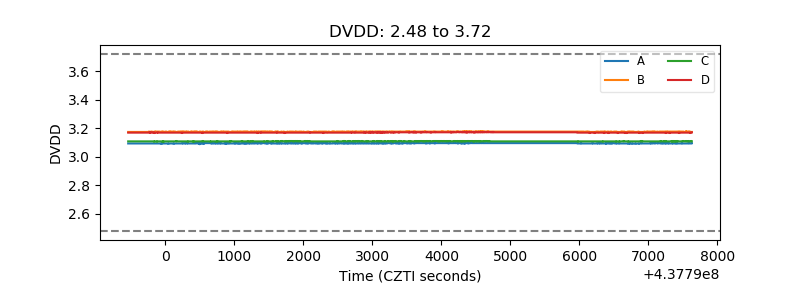 |
| Temperature 1 | 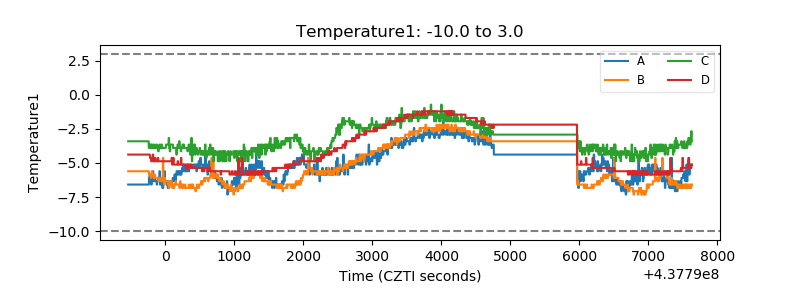 |
| Veto HV Monitor | 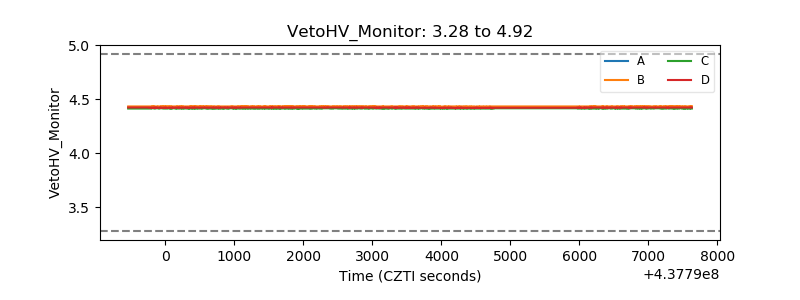 |
| Veto LLD | 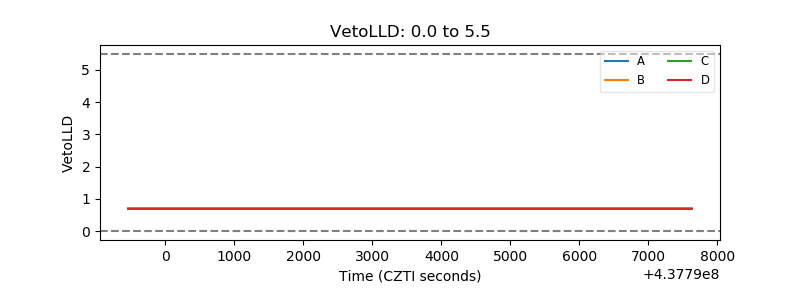 |
| Alpha Counter | 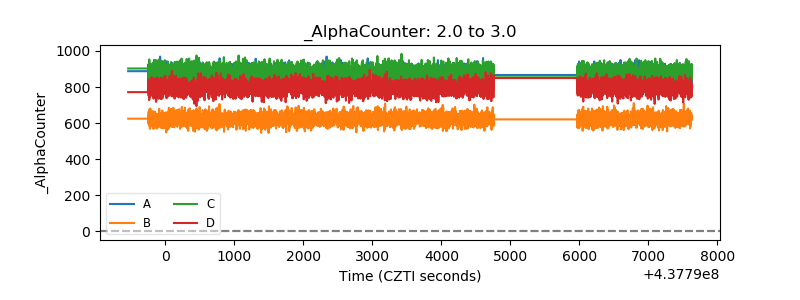 |
| _CPM_Rate | 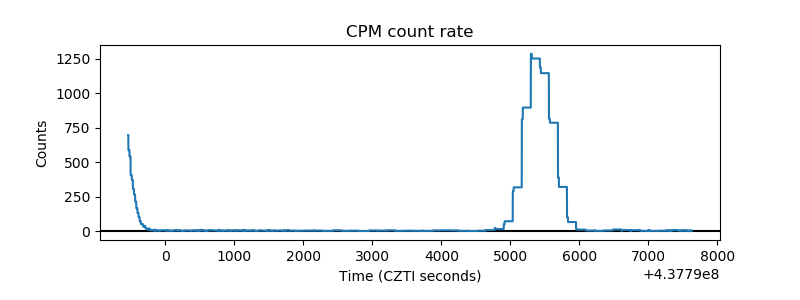 |
| CZT Counter | 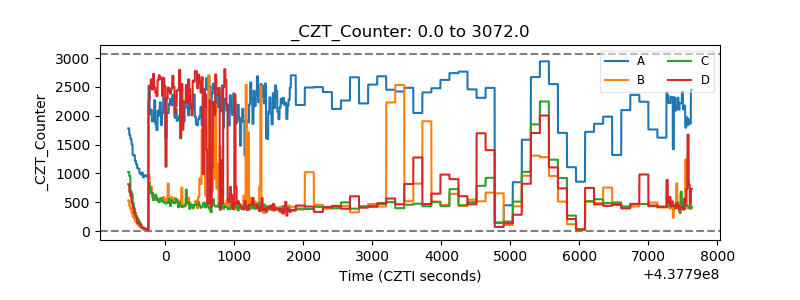 |
| +2.5 Volts monitor | 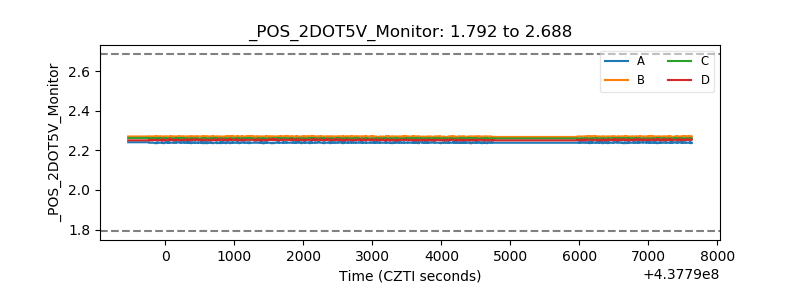 |
| +5 Volts monitor | 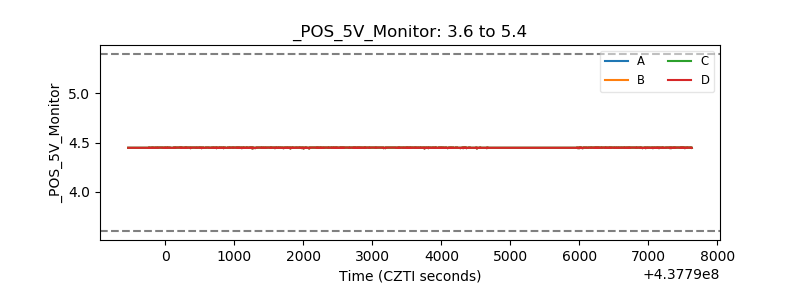 |
| _ROLL_ROT | 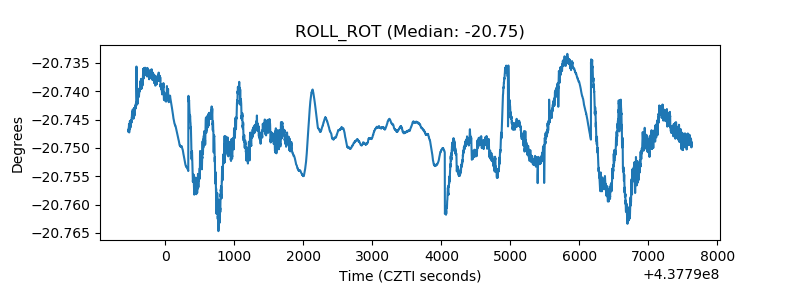 |
| _Roll_DEC | 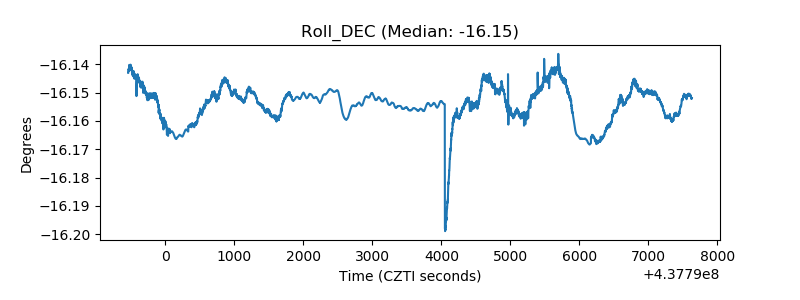 |
| _Roll_RA | 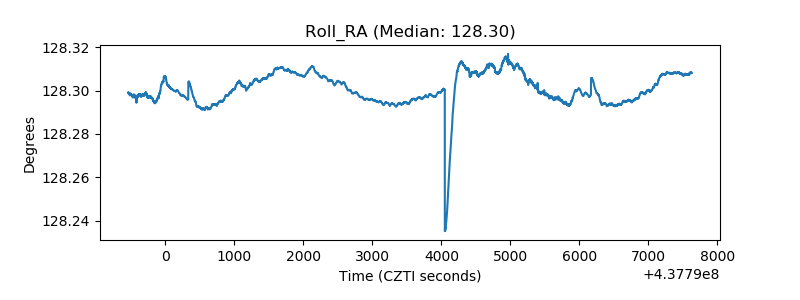 |
| Veto Counter | 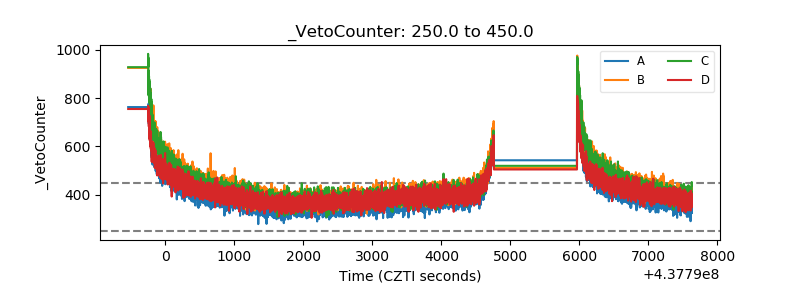 |