| Param | Original file | Final file |
|---|---|---|
| Filename | modeM0/AS1A13_065T06_9000005924_43982cztM0_level2.fits | modeM0/AS1A13_065T06_9000005924_43982cztM0_level2_quad_clean.evt |
| Size (bytes) | 646,326,720 | 98,369,280 |
| Size | 616.4 MB | 93.8 MB |
| Events in quadrant A | 11,896,085 | 213,427 |
| Events in quadrant B | 4,116,058 | 792,372 |
| Events in quadrant C | 3,196,705 | 789,005 |
| Events in quadrant D | 4,186,250 | 710,711 |
| Mode SS | |||
|---|---|---|---|
| Quadrant | BADHDUFLAG | Total packets | Discarded packets |
| A | 0 | 136 | 0 |
| B | 0 | 136 | 0 |
| C | 0 | 136 | 0 |
| D | 0 | 136 | 0 |
| Mode M9 | |||
|---|---|---|---|
| Quadrant | BADHDUFLAG | Total packets | Discarded packets |
| A | 0 | 18 | 0 |
| B | 0 | 19 | 0 |
| C | 0 | 19 | 0 |
| D | 0 | 19 | 0 |
| Mode M0 | |||
|---|---|---|---|
| Quadrant | BADHDUFLAG | Total packets | Discarded packets |
| A | 0 | 40068 | 2 |
| B | 0 | 16759 | 2 |
| C | 0 | 14175 | 2 |
| D | 0 | 17214 | 2 |
| Quadrant | Total seconds | Saturated seconds | Saturation percentage |
|---|---|---|---|
| A | 6796 | 5050 | 74.308417% |
| B | 6796 | 396 | 5.826957% |
| C | 6796 | 18 | 0.264862% |
| D | 6796 | 151 | 2.221895% |
Noise dominated data is calculated using 1-second bins in cleaned event files. If a bin has >2000 counts, and if more than 50% of those come from <1% of pixels, then it is considered to be noise-dominated and hence unusable.
| Quadrant | # 1 sec bins | Bins with >0 counts | Bins with >2000 counts | High rate bins dominated by noise | Noise dominated (total time) | Noise dominated (detector-on time) | Marked lightcurve |
|---|---|---|---|---|---|---|---|
| A | 7931 | 6796 | 2995 | 2995 | 37.76% | 44.07% | 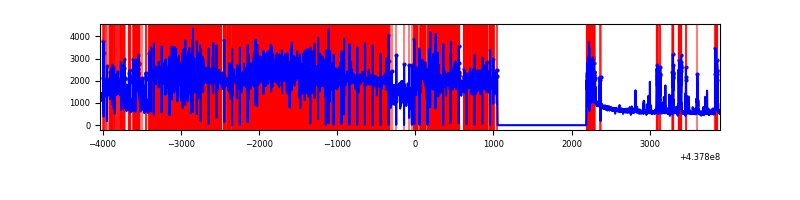 |
| B | 7931 | 6797 | 235 | 235 | 2.96% | 3.46% | 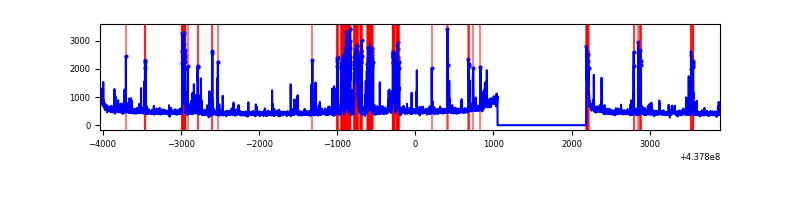 |
| C | 7931 | 6797 | 3 | 3 | 0.04% | 0.04% | 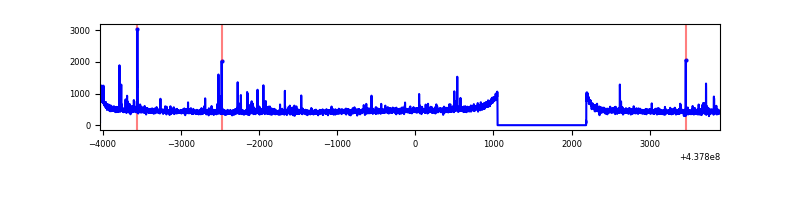 |
| D | 7931 | 6797 | 116 | 116 | 1.46% | 1.71% | 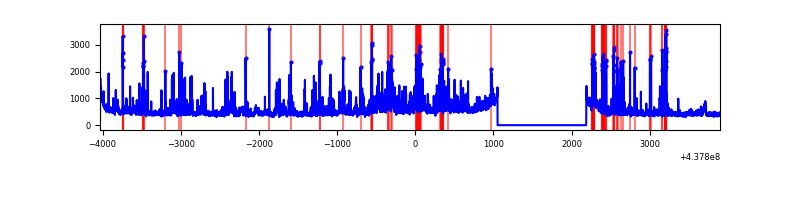 |
Top three noisy pixels from each quadrant. If the there are fewer than three noisy pixels in the level2.evt file, extra rows are filled as -1
| Pixel properties | Quadrant properties | ||||||
|---|---|---|---|---|---|---|---|
| Quadrant | DetID | PixID | Counts | Sigma | Mean | Median | Sigma |
| A | 15 | 223 | 10053085 | 185841.14 | 255 | 250 | 54.1 |
| A | 10 | 83 | 464021 | 8573.47 | 255 | 250 | 54.1 |
| A | 14 | 238 | 381396 | 7046.02 | 255 | 250 | 54.1 |
| B | 5 | 172 | 850619 | 5489.91 | 784 | 760 | 154.8 |
| B | 4 | 171 | 130621 | 838.87 | 784 | 760 | 154.8 |
| B | 12 | 111 | 19387 | 120.33 | 784 | 760 | 154.8 |
| C | 14 | 254 | 60877 | 321.06 | 790 | 796 | 187.1 |
| C | 15 | 157 | 23454 | 121.08 | 790 | 796 | 187.1 |
| C | 3 | 233 | 22243 | 114.61 | 790 | 796 | 187.1 |
| D | 1 | 52 | 367881 | 1854.15 | 780 | 758 | 198.0 |
| D | 5 | 222 | 297801 | 1500.21 | 780 | 758 | 198.0 |
| D | 4 | 222 | 119595 | 600.18 | 780 | 758 | 198.0 |
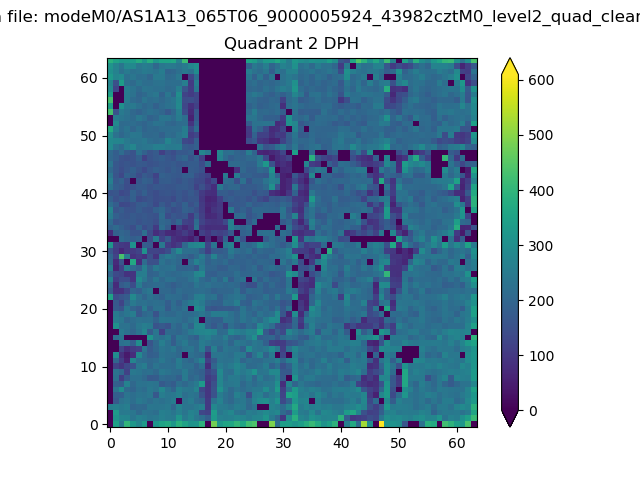
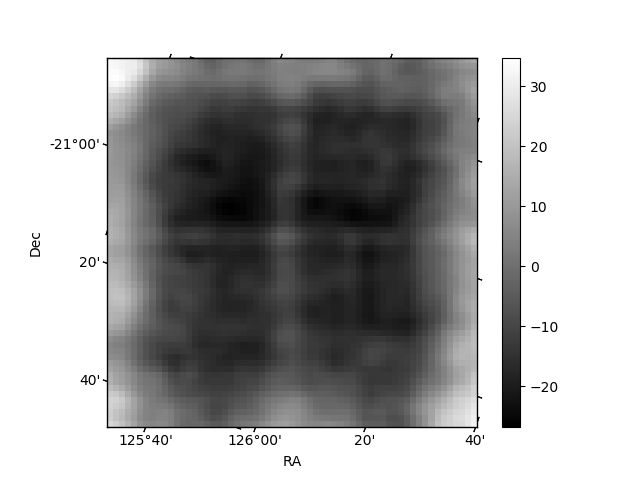
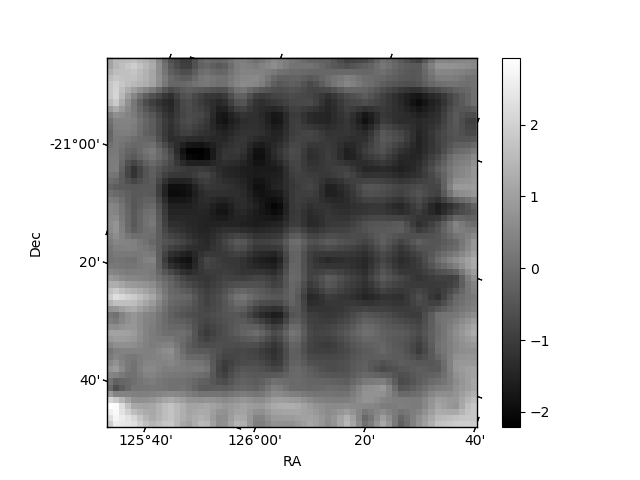
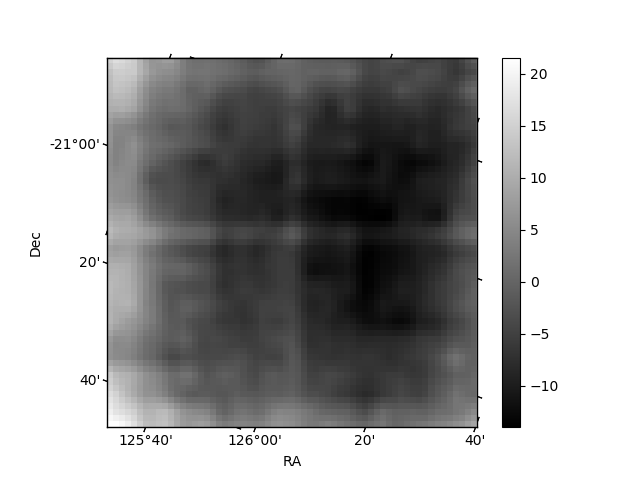
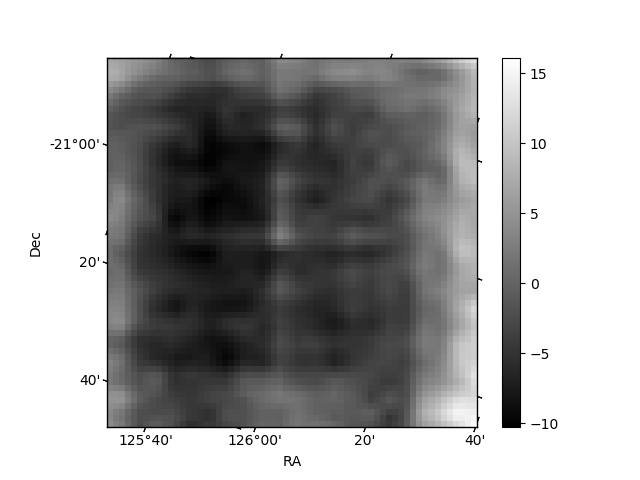
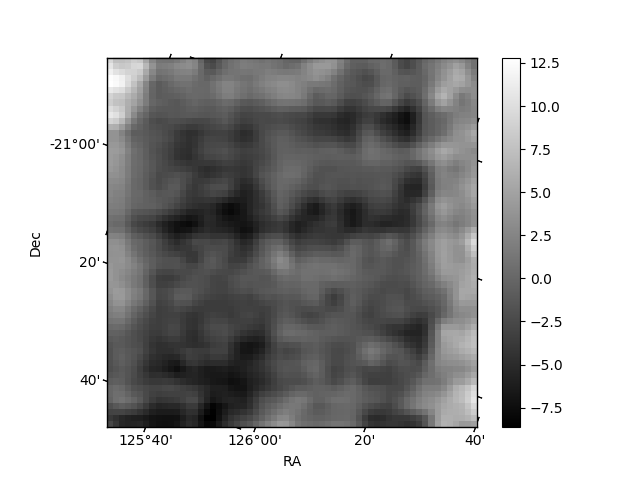
Histogram calculated using DETX and DETY for each event in the final _common_clean file
| Quadrant A | 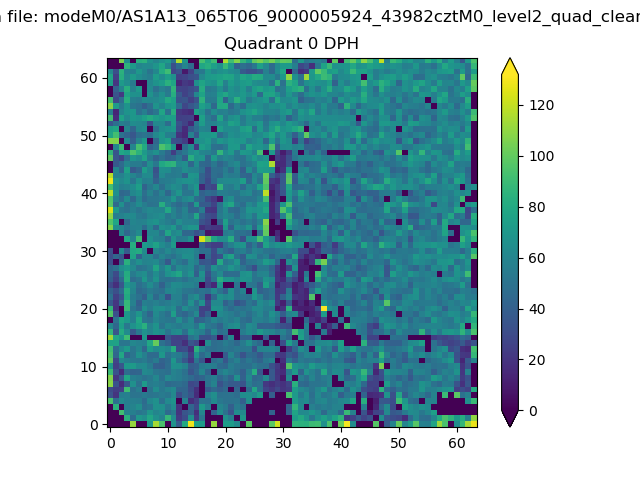 |
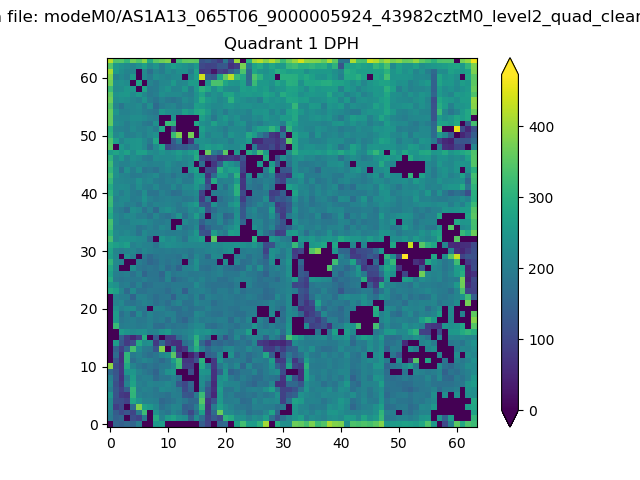 |
Quadrant B |
|---|---|---|---|
| Quadrant D | 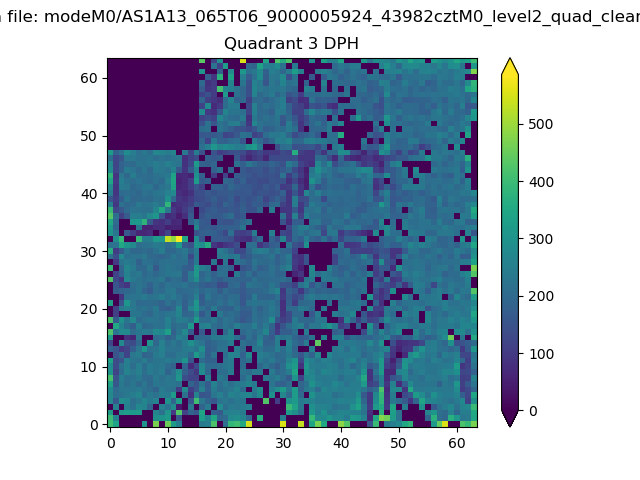 |
 |
Quadrant C |
| Plot type | Count rate plots | Images |
|---|---|---|
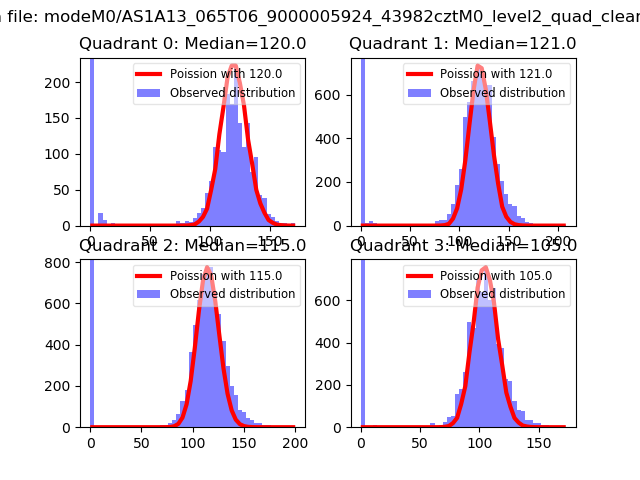
| Comparison with Poisson distribution Blue bars denote a histogram of data divided into 1 sec bins. Red curve is a Poisson curve with rate = median count rate of data. |
 |
 |
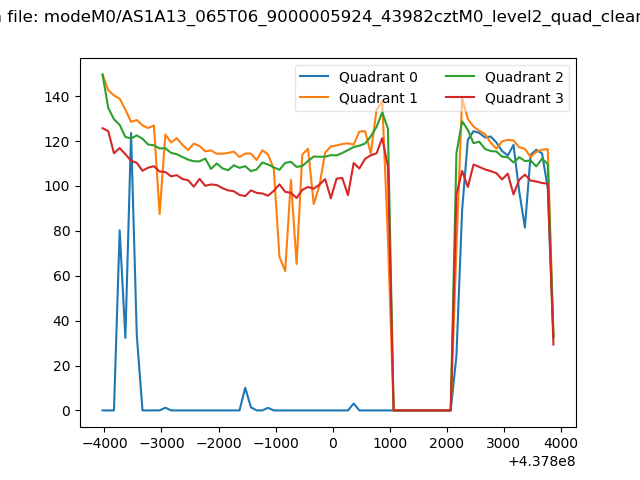
| Quadrant-wise count rates Data is divided into 100 sec bins |
 |
|
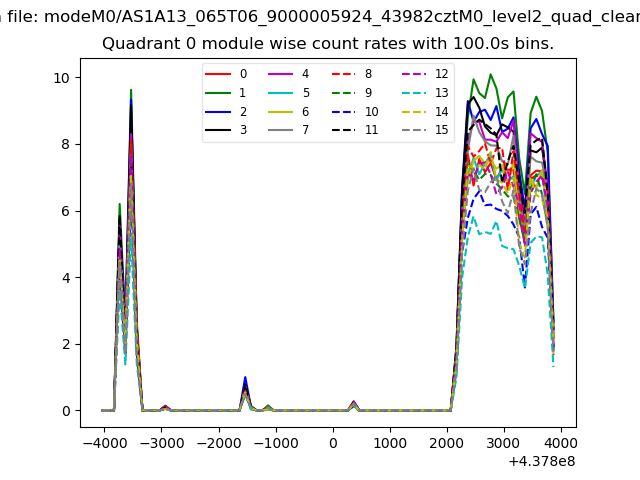
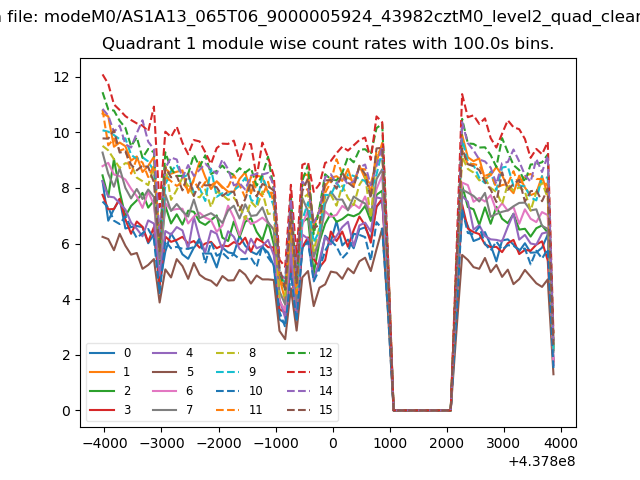
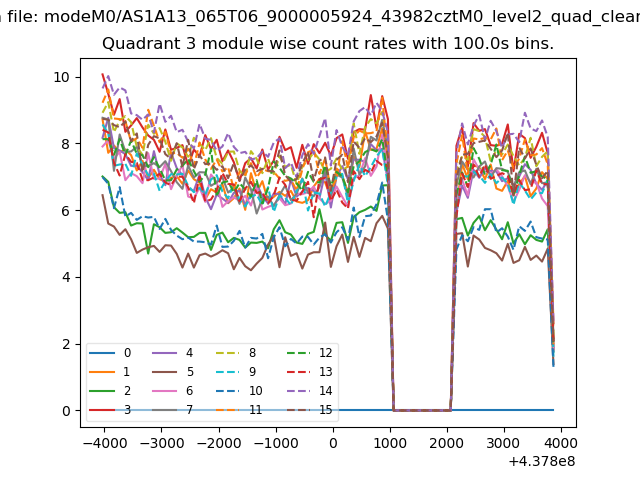
| Module-wise count rates for Quadrant A Data is divided into 100 sec bins |
 |
 |
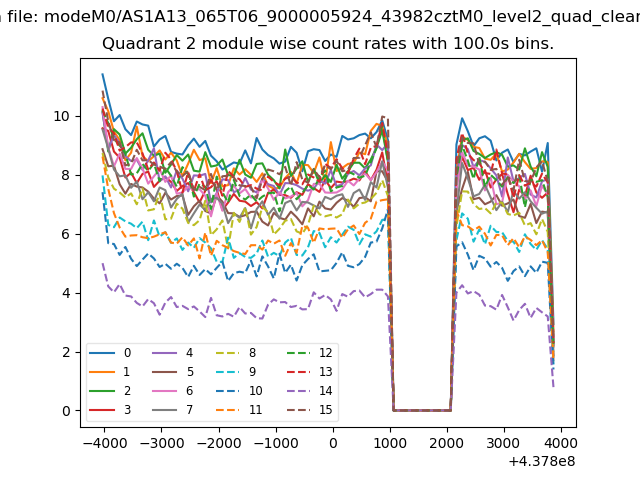
| Module-wise count rates for Quadrant B Data is divided into 100 sec bins |
 |
 |
| Module-wise count rates for Quadrant C Data is divided into 100 sec bins |
 |
 |
| Module-wise count rates for Quadrant D Data is divided into 100 sec bins |
 |
 |
| Parameter | Plot |
|---|---|
| CZT HV Monitor | 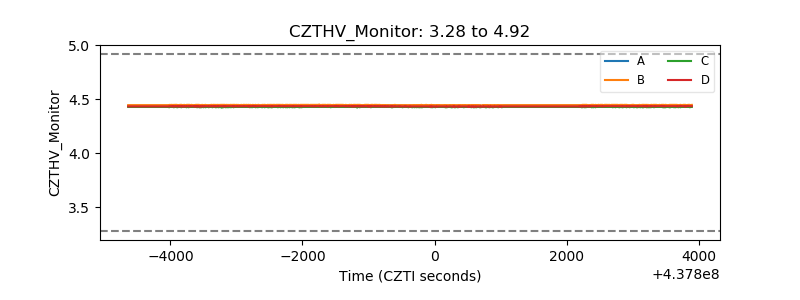 |
| D_VDD | 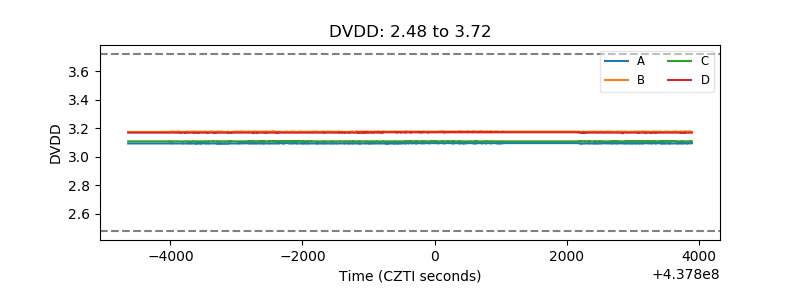 |
| Temperature 1 | 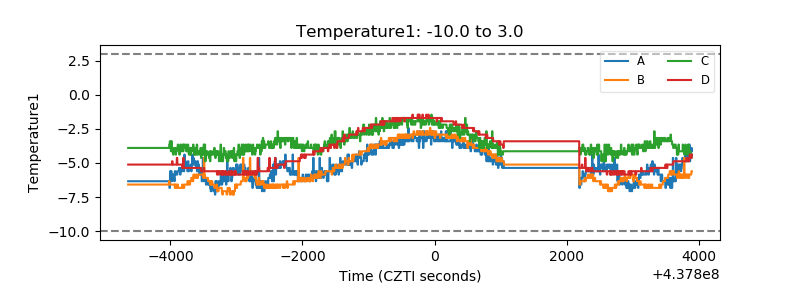 |
| Veto HV Monitor | 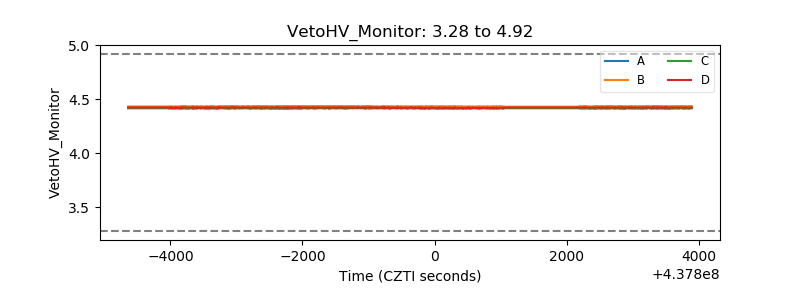 |
| Veto LLD | 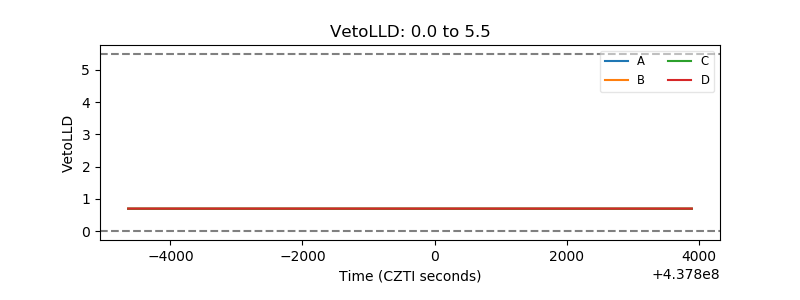 |
| Alpha Counter | 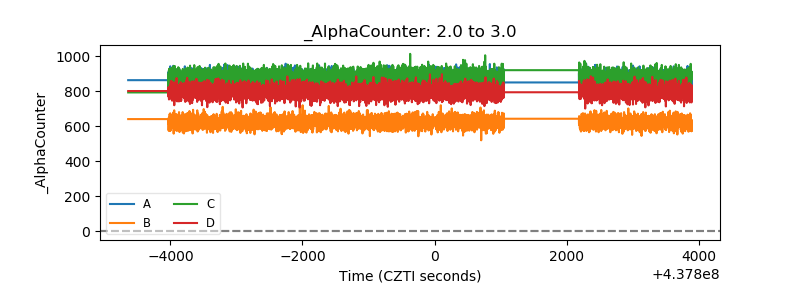 |
| _CPM_Rate | 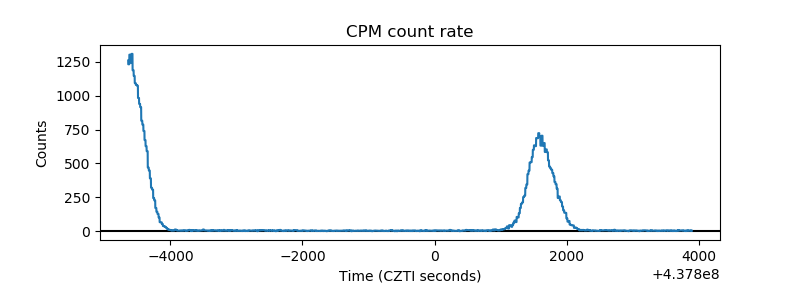 |
| CZT Counter | 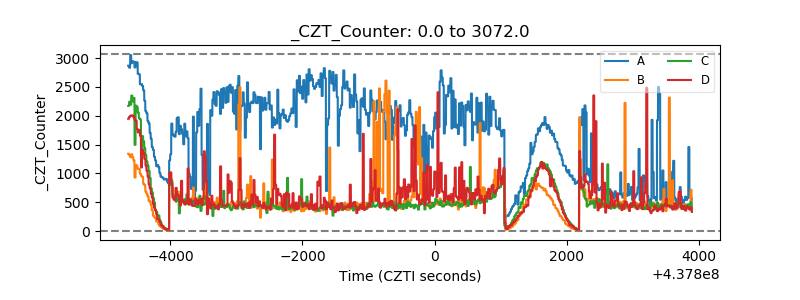 |
| +2.5 Volts monitor | 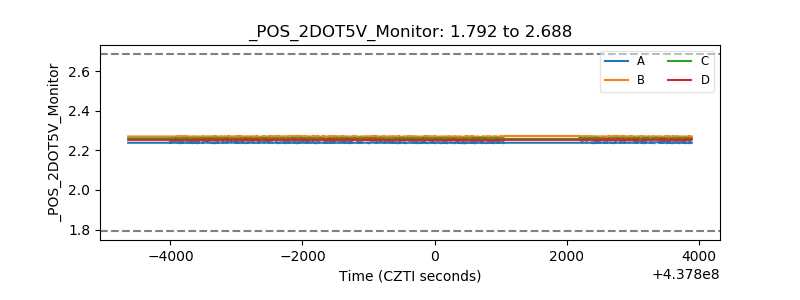 |
| +5 Volts monitor | 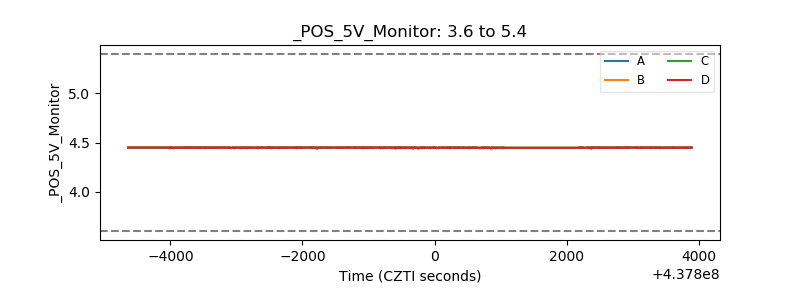 |
| _ROLL_ROT | 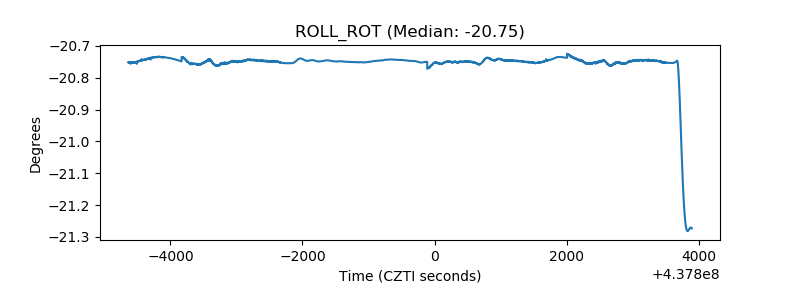 |
| _Roll_DEC | 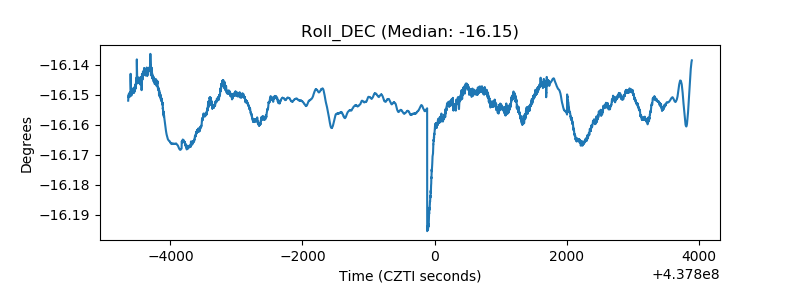 |
| _Roll_RA | 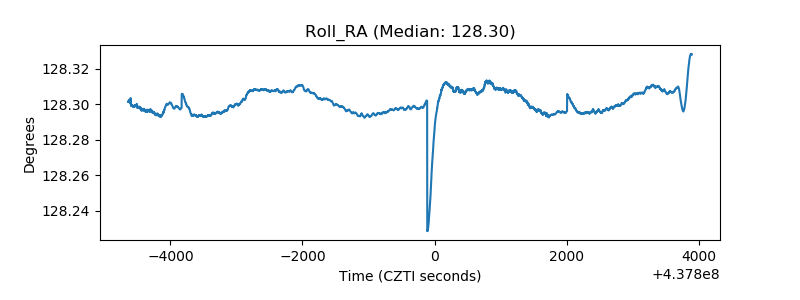 |
| Veto Counter | 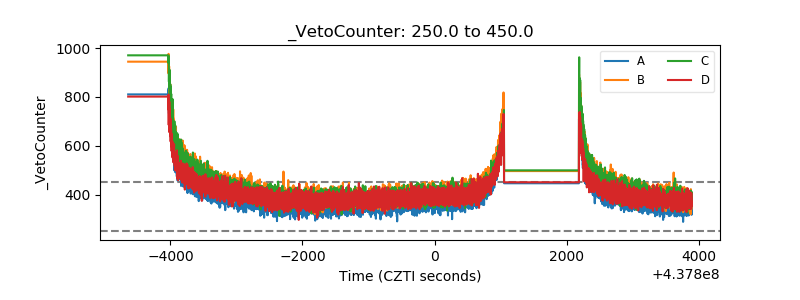 |