| Param | Original file | Final file |
|---|---|---|
| Filename | modeM0/AS1A13_065T06_9000005924_43984cztM0_level2.fits | modeM0/AS1A13_065T06_9000005924_43984cztM0_level2_quad_clean.evt |
| Size (bytes) | 636,805,440 | 90,855,360 |
| Size | 607.3 MB | 86.6 MB |
| Events in quadrant A | 11,782,104 | 143,377 |
| Events in quadrant B | 3,706,429 | 743,284 |
| Events in quadrant C | 3,143,562 | 733,281 |
| Events in quadrant D | 4,407,991 | 655,519 |
| Mode SS | |||
|---|---|---|---|
| Quadrant | BADHDUFLAG | Total packets | Discarded packets |
| A | 0 | 140 | 0 |
| B | 0 | 140 | 0 |
| C | 0 | 140 | 0 |
| D | 0 | 140 | 0 |
| Mode M9 | |||
|---|---|---|---|
| Quadrant | BADHDUFLAG | Total packets | Discarded packets |
| A | 0 | 5 | 0 |
| B | 0 | 5 | 0 |
| C | 0 | 5 | 0 |
| D | 0 | 5 | 0 |
| Mode M0 | |||
|---|---|---|---|
| Quadrant | BADHDUFLAG | Total packets | Discarded packets |
| A | 0 | 39783 | 3 |
| B | 0 | 15725 | 2 |
| C | 0 | 14181 | 2 |
| D | 0 | 17725 | 2 |
| Quadrant | Total seconds | Saturated seconds | Saturation percentage |
|---|---|---|---|
| A | 6819 | 5637 | 82.666080% |
| B | 6820 | 299 | 4.384164% |
| C | 6820 | 79 | 1.158358% |
| D | 6820 | 265 | 3.885630% |
Noise dominated data is calculated using 1-second bins in cleaned event files. If a bin has >2000 counts, and if more than 50% of those come from <1% of pixels, then it is considered to be noise-dominated and hence unusable.
| Quadrant | # 1 sec bins | Bins with >0 counts | Bins with >2000 counts | High rate bins dominated by noise | Noise dominated (total time) | Noise dominated (detector-on time) | Marked lightcurve |
|---|---|---|---|---|---|---|---|
| A | 7408 | 6818 | 2539 | 2539 | 34.27% | 37.24% | 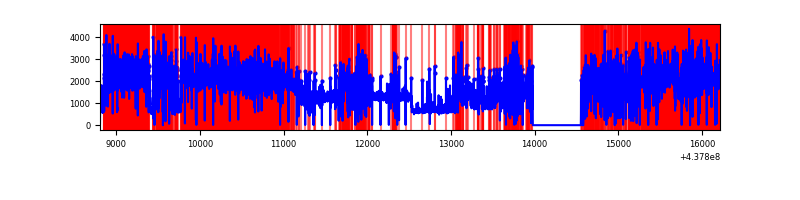 |
| B | 7410 | 6822 | 126 | 126 | 1.70% | 1.85% | 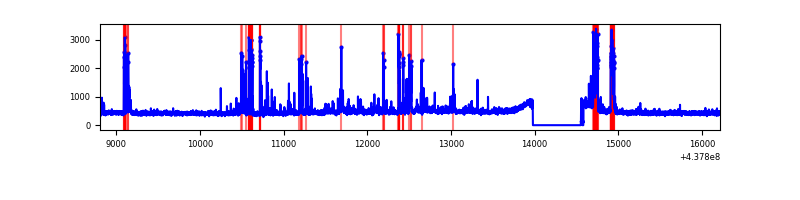 |
| C | 7410 | 6822 | 3 | 3 | 0.04% | 0.04% | 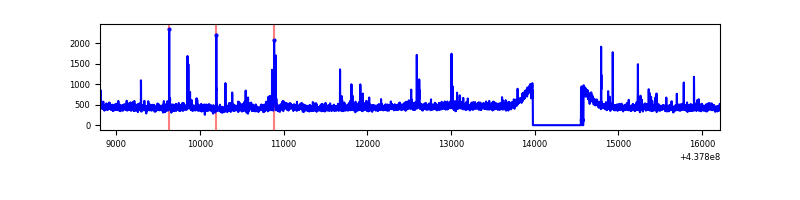 |
| D | 7410 | 6822 | 153 | 153 | 2.06% | 2.24% | 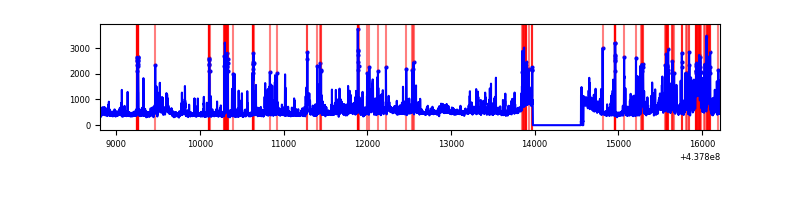 |
Top three noisy pixels from each quadrant. If the there are fewer than three noisy pixels in the level2.evt file, extra rows are filled as -1
| Pixel properties | Quadrant properties | ||||||
|---|---|---|---|---|---|---|---|
| Quadrant | DetID | PixID | Counts | Sigma | Mean | Median | Sigma |
| A | 15 | 223 | 10417170 | 216448.31 | 225 | 221 | 48.1 |
| A | 10 | 83 | 321228 | 6670.04 | 225 | 221 | 48.1 |
| A | 14 | 238 | 140027 | 2904.96 | 225 | 221 | 48.1 |
| B | 5 | 172 | 540681 | 3525.26 | 764 | 740 | 153.2 |
| B | 4 | 171 | 40763 | 261.31 | 764 | 740 | 153.2 |
| B | 4 | 173 | 27912 | 177.41 | 764 | 740 | 153.2 |
| C | 9 | 237 | 51028 | 275.07 | 770 | 774 | 182.7 |
| C | 14 | 254 | 50401 | 271.63 | 770 | 774 | 182.7 |
| C | 3 | 233 | 17025 | 88.95 | 770 | 774 | 182.7 |
| D | 1 | 52 | 635141 | 3276.49 | 764 | 742 | 193.6 |
| D | 7 | 80 | 297746 | 1533.94 | 764 | 742 | 193.6 |
| D | 10 | 118 | 96295 | 493.5 | 764 | 742 | 193.6 |
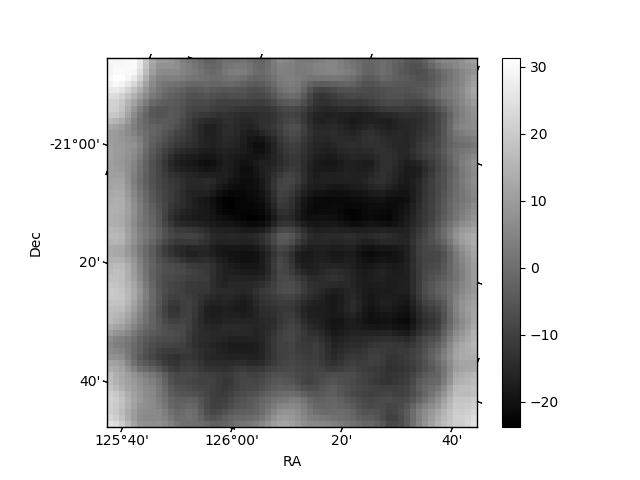
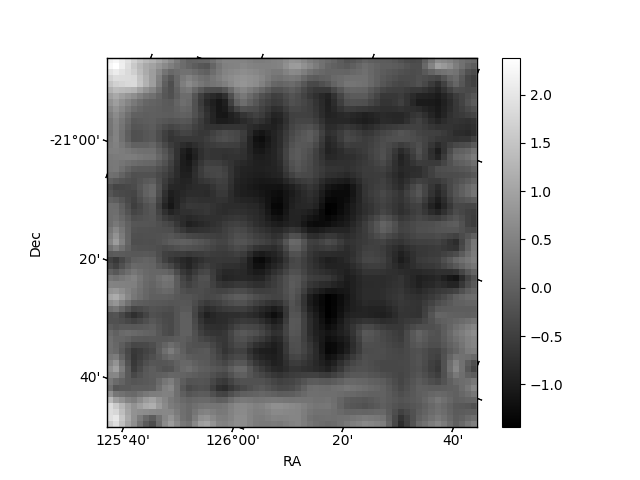
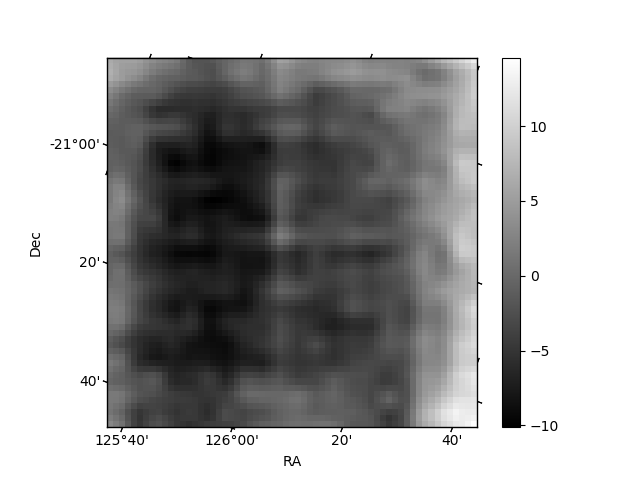
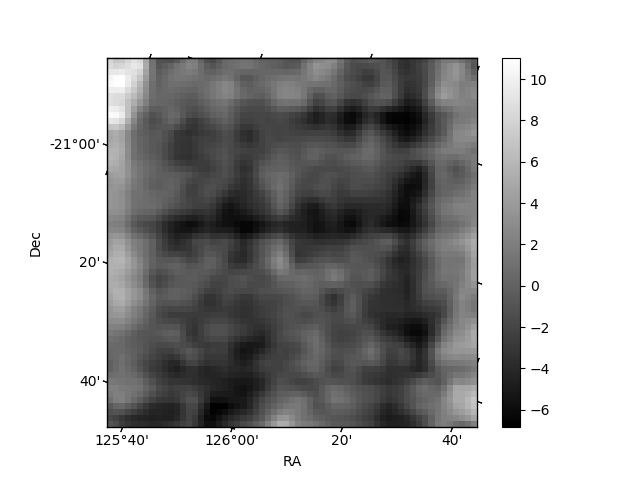
Histogram calculated using DETX and DETY for each event in the final _common_clean file
| Quadrant A | 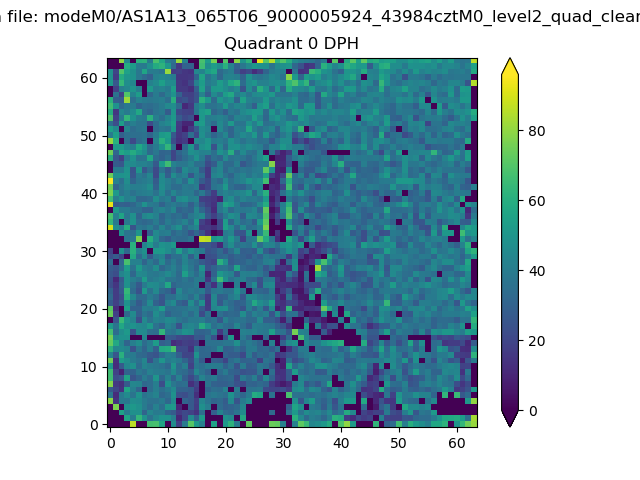 |
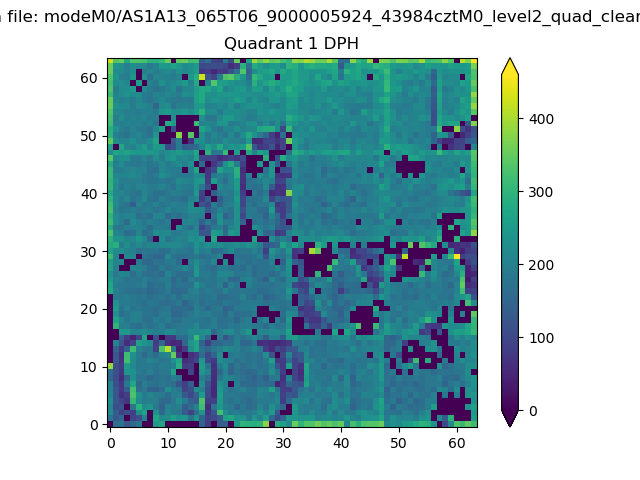 |
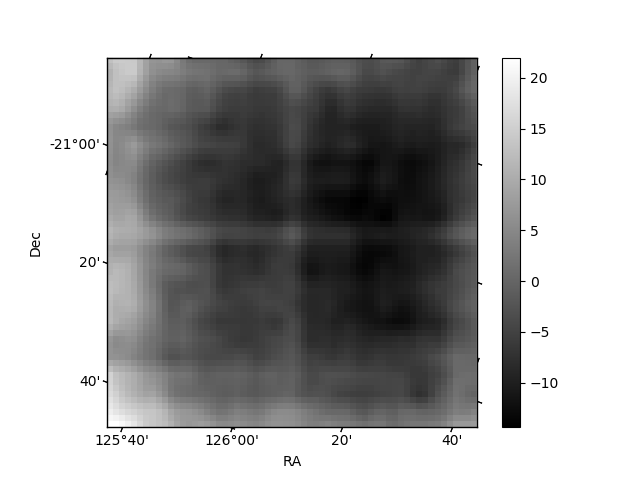
Quadrant B |
|---|---|---|---|
| Quadrant D | 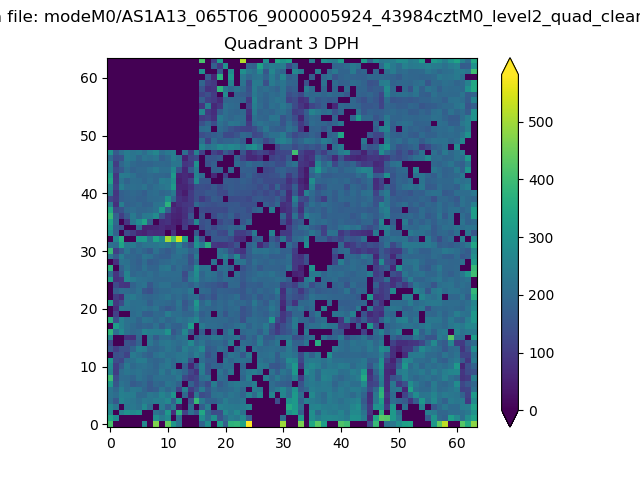 |
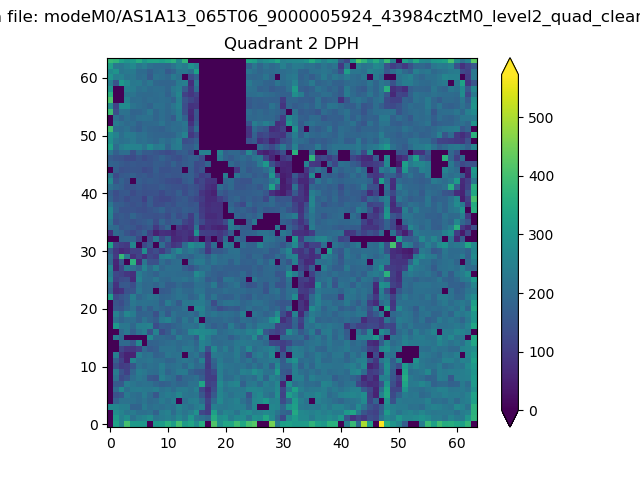 |
Quadrant C |
| Plot type | Count rate plots | Images |
|---|---|---|
| Comparison with Poisson distribution Blue bars denote a histogram of data divided into 1 sec bins. Red curve is a Poisson curve with rate = median count rate of data. |
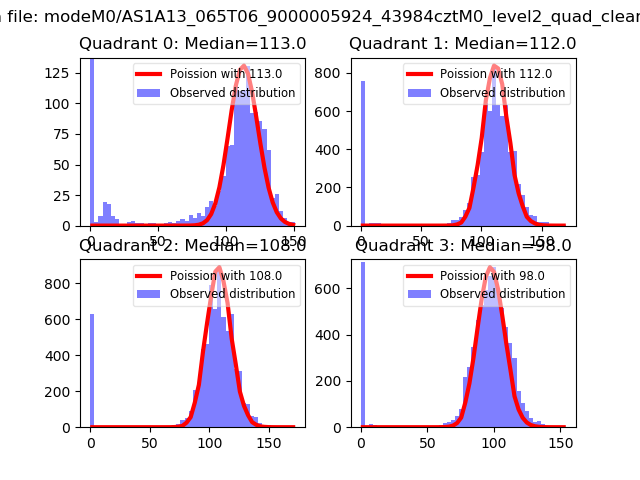 |
 |
| Quadrant-wise count rates Data is divided into 100 sec bins |
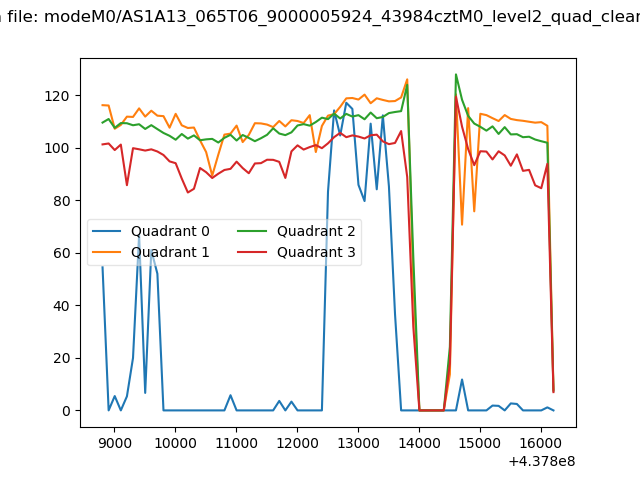 |
|
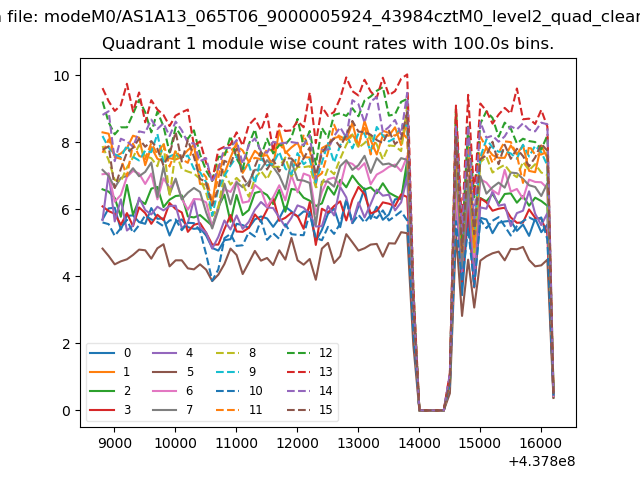
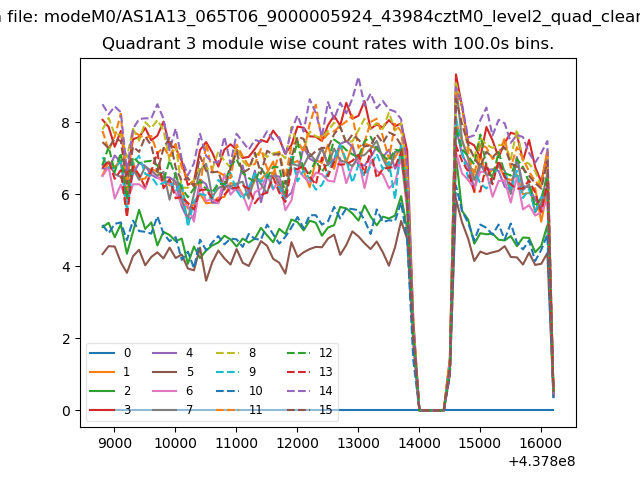
| Module-wise count rates for Quadrant A Data is divided into 100 sec bins |
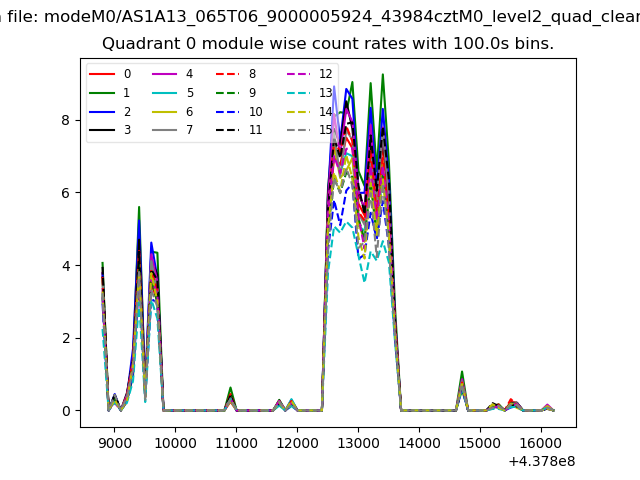 |
 |
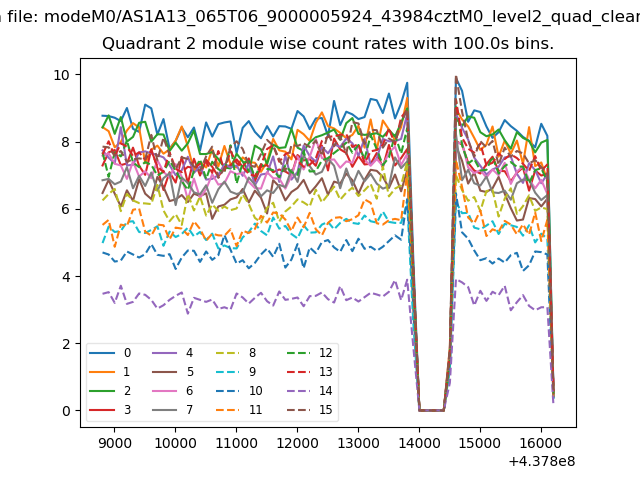
| Module-wise count rates for Quadrant B Data is divided into 100 sec bins |
 |
 |
| Module-wise count rates for Quadrant C Data is divided into 100 sec bins |
 |
 |
| Module-wise count rates for Quadrant D Data is divided into 100 sec bins |
 |
 |
| Parameter | Plot |
|---|---|
| CZT HV Monitor |  |
| D_VDD | 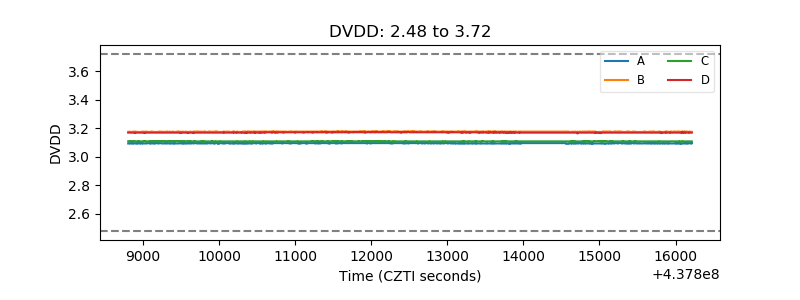 |
| Temperature 1 | 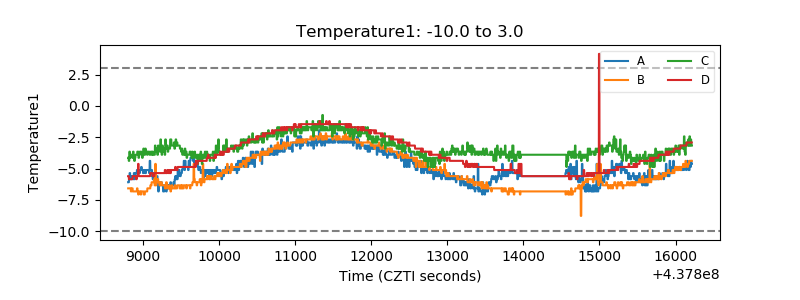 |
| Veto HV Monitor | 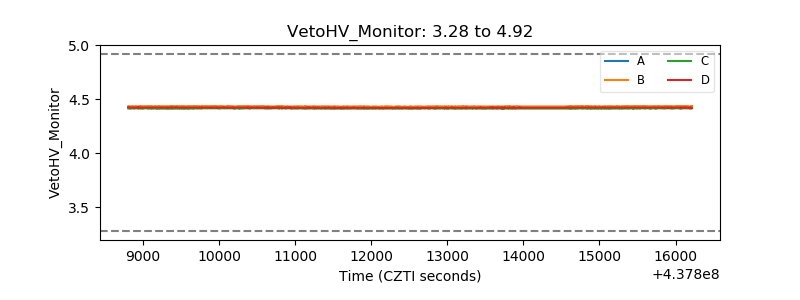 |
| Veto LLD | 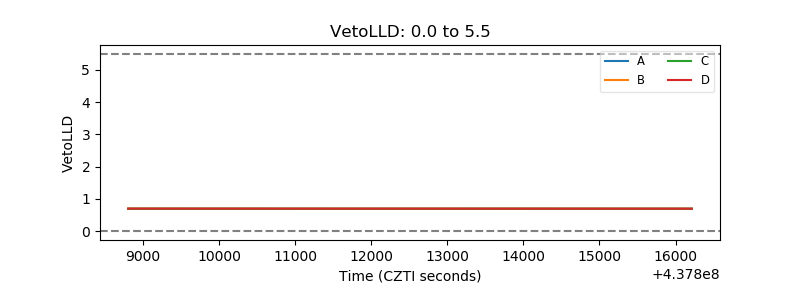 |
| Alpha Counter | 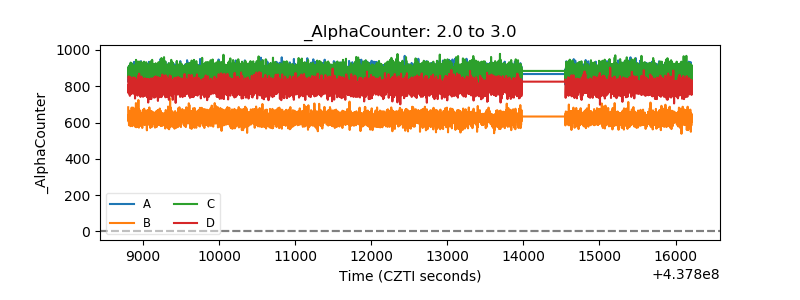 |
| _CPM_Rate | 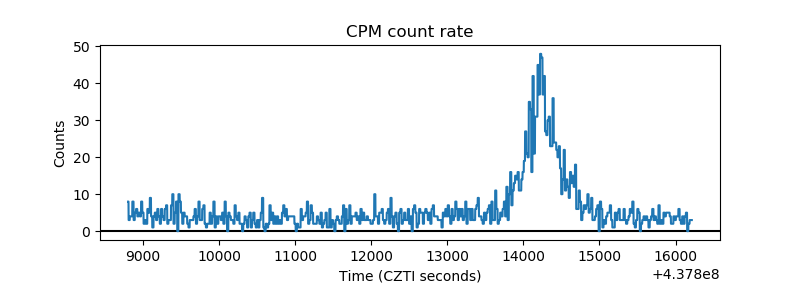 |
| CZT Counter | 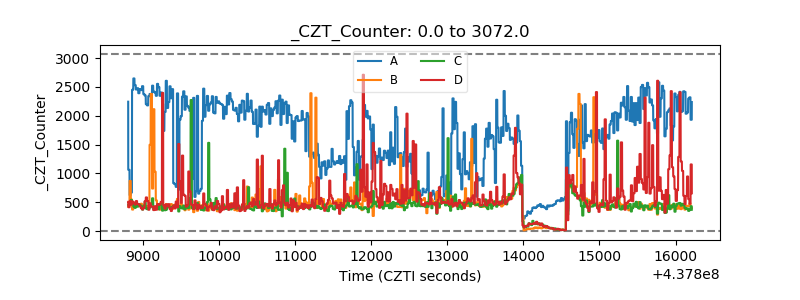 |
| +2.5 Volts monitor | 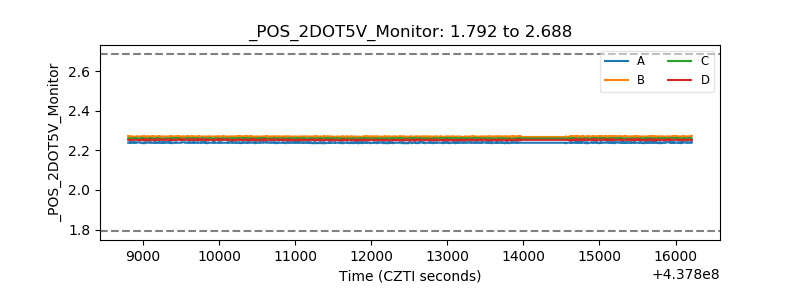 |
| +5 Volts monitor | 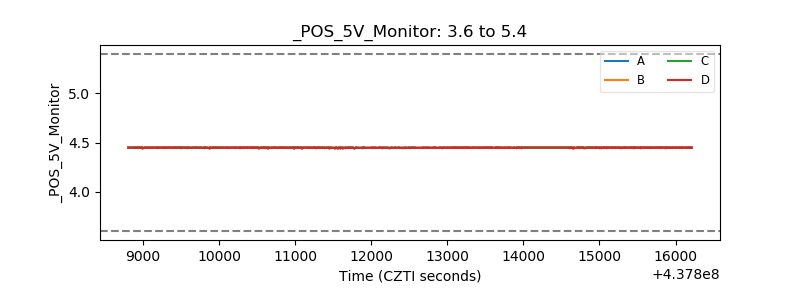 |
| _ROLL_ROT | 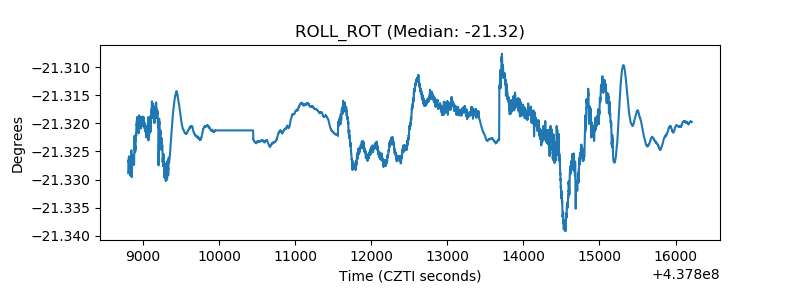 |
| _Roll_DEC | 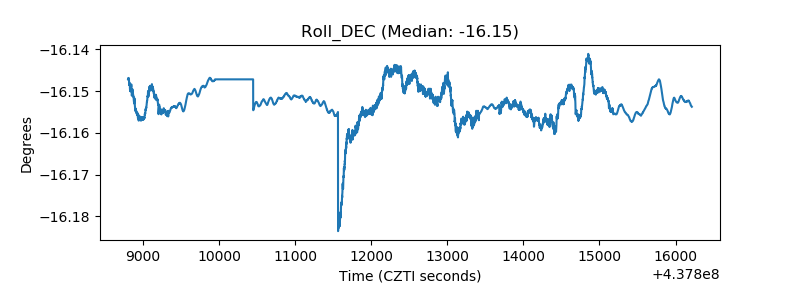 |
| _Roll_RA | 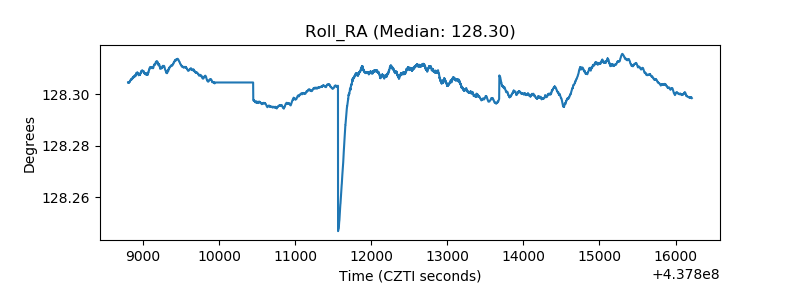 |
| Veto Counter | 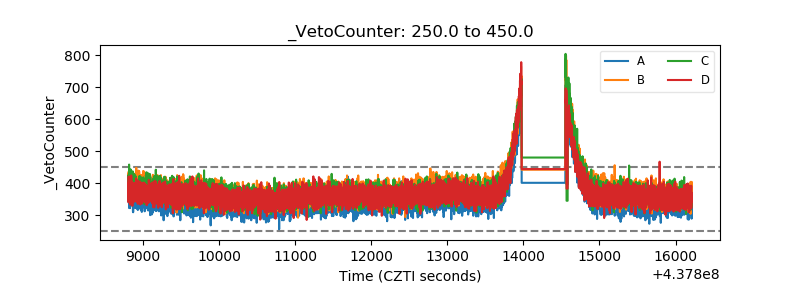 |