| Param | Original file | Final file |
|---|---|---|
| Filename | modeM0/AS1A13_065T06_9000005924_43985cztM0_level2.fits | modeM0/AS1A13_065T06_9000005924_43985cztM0_level2_quad_clean.evt |
| Size (bytes) | 792,812,160 | 87,189,120 |
| Size | 756.1 MB | 83.2 MB |
| Events in quadrant A | 14,245,251 | 27,029 |
| Events in quadrant B | 4,841,270 | 718,405 |
| Events in quadrant C | 3,402,201 | 752,046 |
| Events in quadrant D | 6,308,421 | 650,752 |
| Mode SS | |||
|---|---|---|---|
| Quadrant | BADHDUFLAG | Total packets | Discarded packets |
| A | 0 | 140 | 0 |
| B | 0 | 140 | 0 |
| C | 0 | 140 | 0 |
| D | 0 | 140 | 0 |
| Mode M0 | |||
|---|---|---|---|
| Quadrant | BADHDUFLAG | Total packets | Discarded packets |
| A | 0 | 47190 | 2 |
| B | 0 | 19242 | 0 |
| C | 0 | 15224 | 0 |
| D | 0 | 23600 | 8 |
| Quadrant | Total seconds | Saturated seconds | Saturation percentage |
|---|---|---|---|
| A | 7063 | 6870 | 97.267450% |
| B | 7064 | 771 | 10.914496% |
| C | 7064 | 106 | 1.500566% |
| D | 7060 | 637 | 9.022663% |
Noise dominated data is calculated using 1-second bins in cleaned event files. If a bin has >2000 counts, and if more than 50% of those come from <1% of pixels, then it is considered to be noise-dominated and hence unusable.
| Quadrant | # 1 sec bins | Bins with >0 counts | Bins with >2000 counts | High rate bins dominated by noise | Noise dominated (total time) | Noise dominated (detector-on time) | Marked lightcurve |
|---|---|---|---|---|---|---|---|
| A | 7062 | 7062 | 3489 | 3489 | 49.41% | 49.41% | 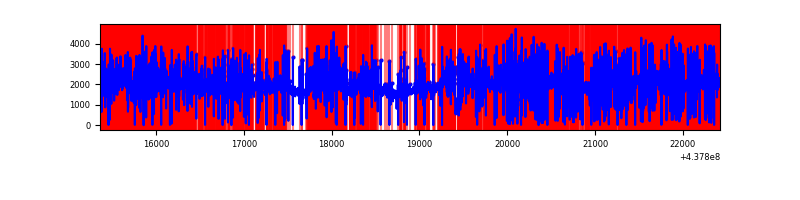 |
| B | 7064 | 7064 | 400 | 400 | 5.66% | 5.66% | 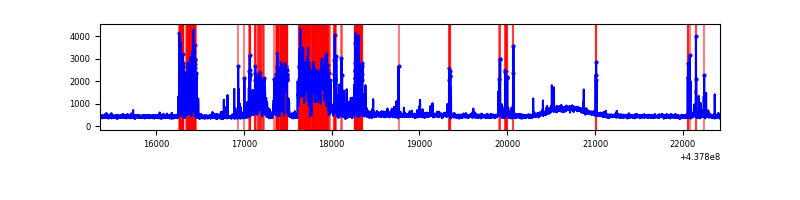 |
| C | 7064 | 7064 | 40 | 40 | 0.57% | 0.57% | 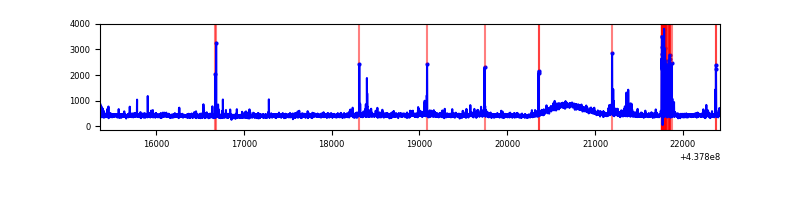 |
| D | 7064 | 7061 | 499 | 499 | 7.06% | 7.07% | 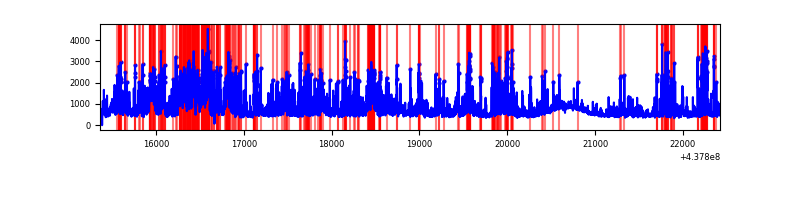 |
Top three noisy pixels from each quadrant. If the there are fewer than three noisy pixels in the level2.evt file, extra rows are filled as -1
| Pixel properties | Quadrant properties | ||||||
|---|---|---|---|---|---|---|---|
| Quadrant | DetID | PixID | Counts | Sigma | Mean | Median | Sigma |
| A | 15 | 223 | 13220656 | 473800.7 | 124 | 121 | 27.9 |
| A | 14 | 238 | 351847 | 12605.24 | 124 | 121 | 27.9 |
| A | 10 | 83 | 171086 | 6127.08 | 124 | 121 | 27.9 |
| B | 5 | 172 | 1568189 | 9953.5 | 782 | 754 | 157.5 |
| B | 4 | 171 | 43325 | 270.33 | 782 | 754 | 157.5 |
| B | 4 | 173 | 33903 | 210.5 | 782 | 754 | 157.5 |
| C | 2 | 14 | 91337 | 474.57 | 806 | 810 | 190.8 |
| C | 14 | 254 | 79718 | 413.66 | 806 | 810 | 190.8 |
| C | 15 | 157 | 47906 | 246.89 | 806 | 810 | 190.8 |
| D | 1 | 52 | 1359571 | 6712.84 | 785 | 757 | 202.4 |
| D | 7 | 80 | 1246583 | 6154.66 | 785 | 757 | 202.4 |
| D | 2 | 120 | 145891 | 716.99 | 785 | 757 | 202.4 |
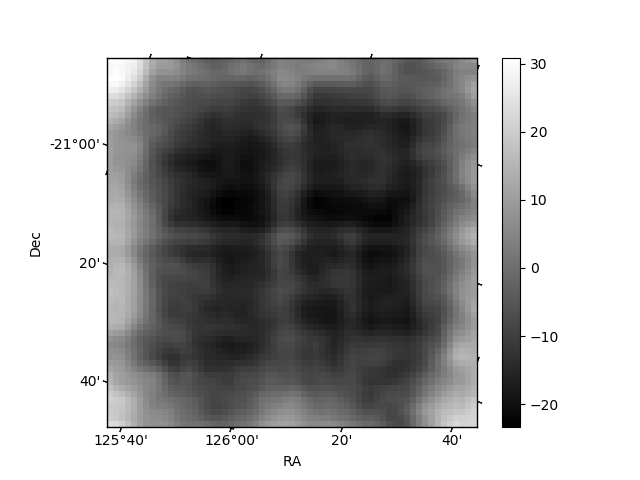
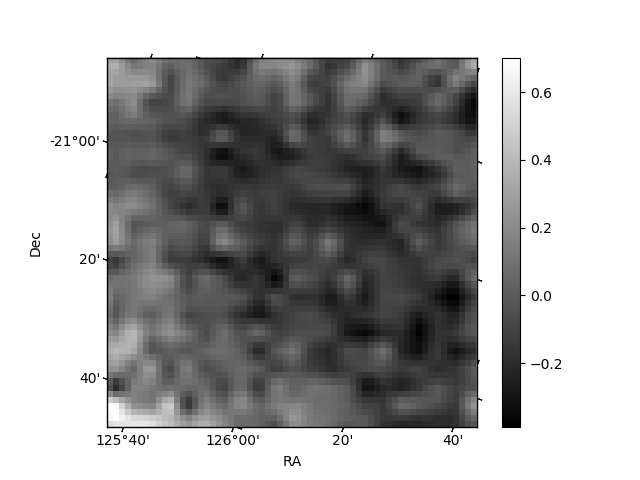
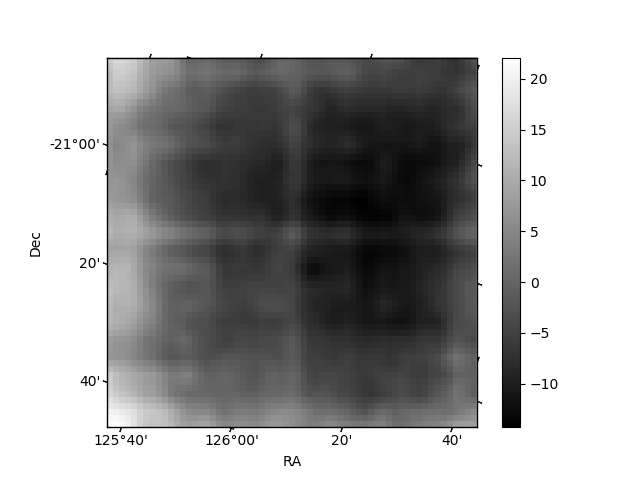
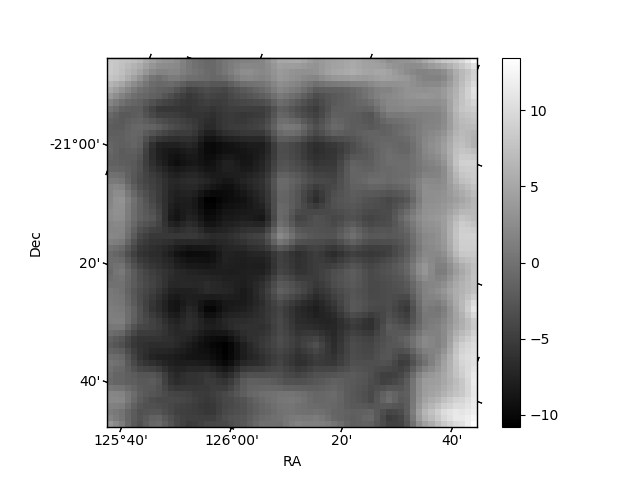
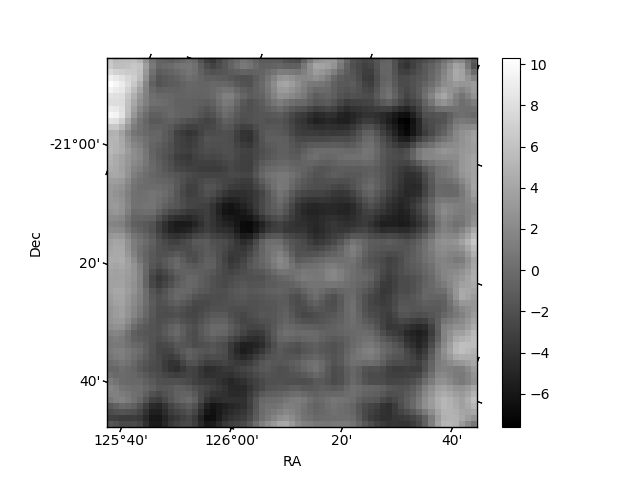
Histogram calculated using DETX and DETY for each event in the final _common_clean file
| Quadrant A | 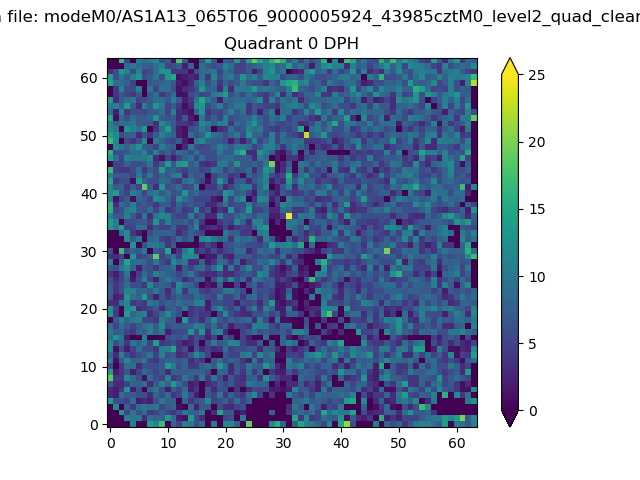 |
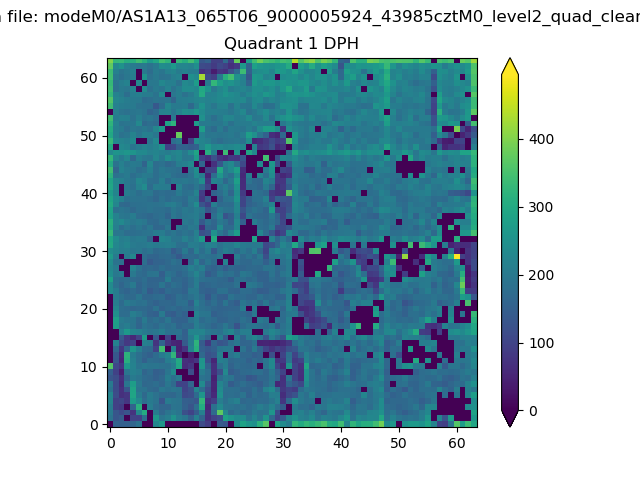 |
Quadrant B |
|---|---|---|---|
| Quadrant D | 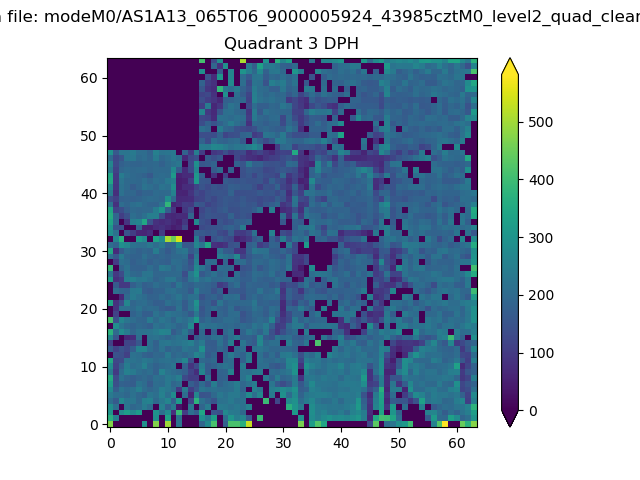 |
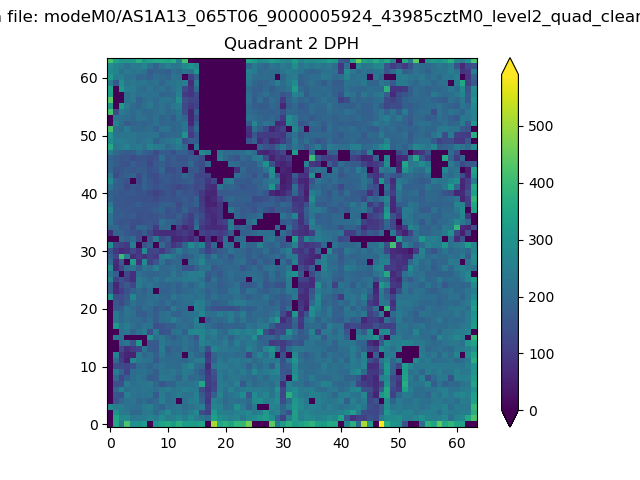 |
Quadrant C |
| Plot type | Count rate plots | Images |
|---|---|---|
| Comparison with Poisson distribution Blue bars denote a histogram of data divided into 1 sec bins. Red curve is a Poisson curve with rate = median count rate of data. |
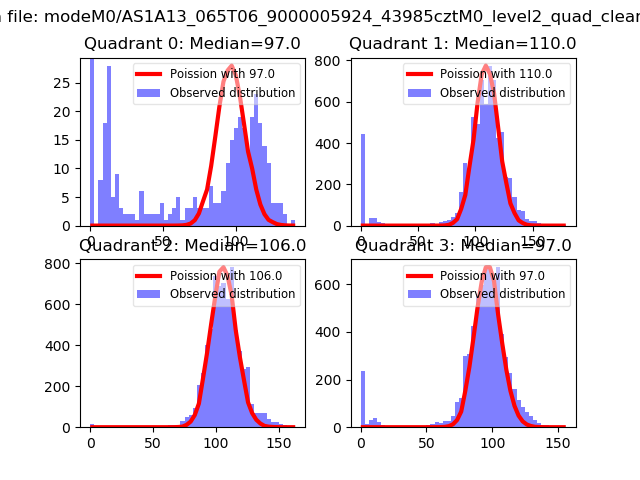 |
 |
| Quadrant-wise count rates Data is divided into 100 sec bins |
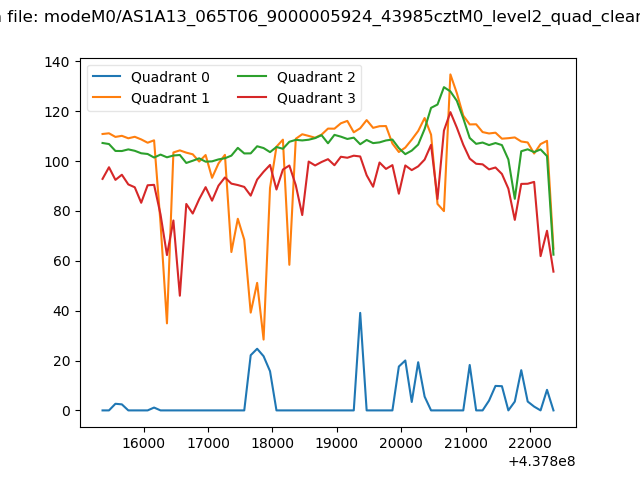 |
|
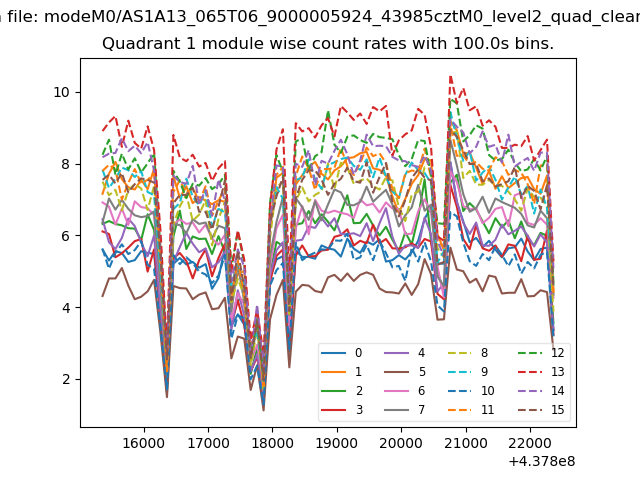
| Module-wise count rates for Quadrant A Data is divided into 100 sec bins |
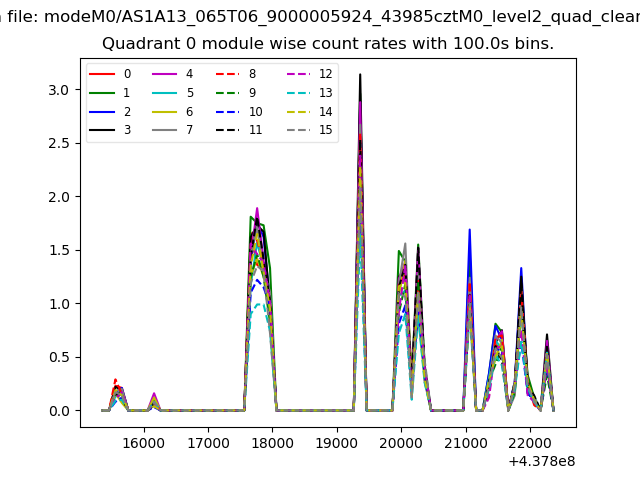 |
 |
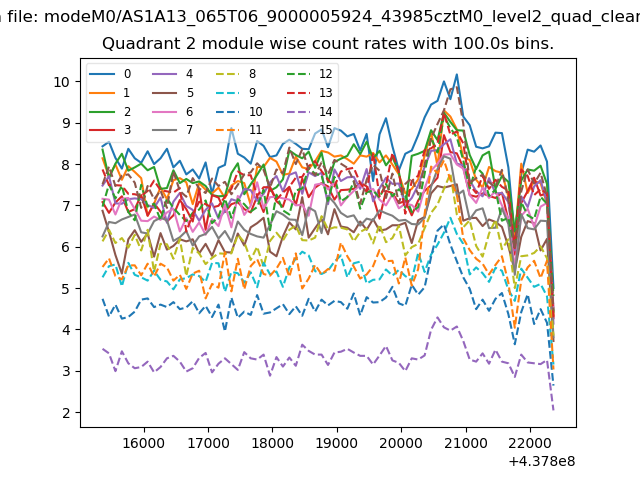
| Module-wise count rates for Quadrant B Data is divided into 100 sec bins |
 |
 |
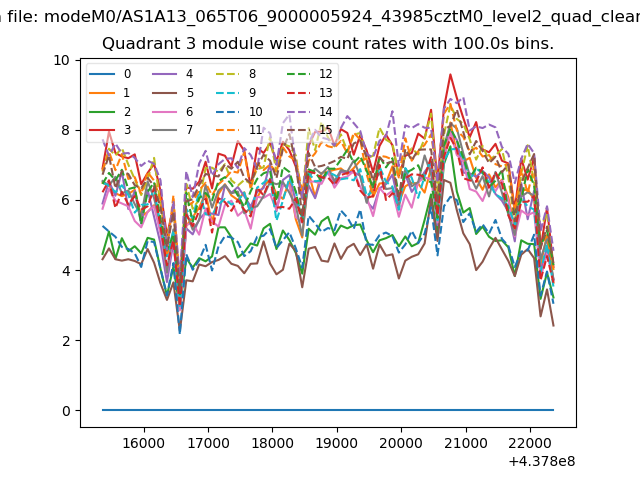
| Module-wise count rates for Quadrant C Data is divided into 100 sec bins |
 |
 |
| Module-wise count rates for Quadrant D Data is divided into 100 sec bins |
 |
 |
| Parameter | Plot |
|---|---|
| CZT HV Monitor |  |
| D_VDD | 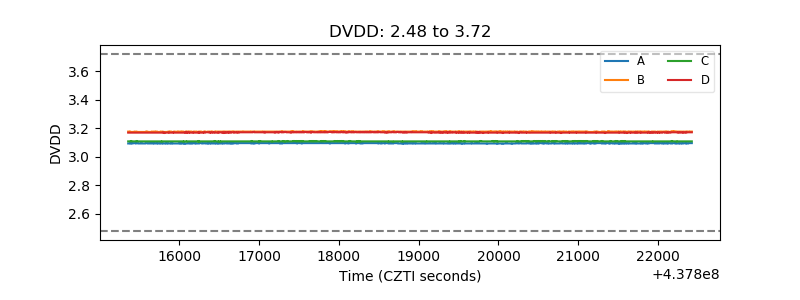 |
| Temperature 1 | 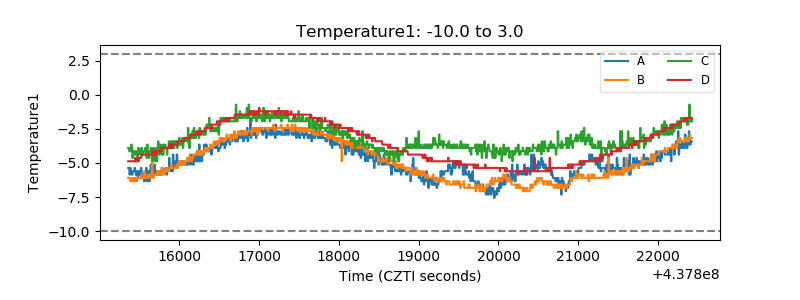 |
| Veto HV Monitor | 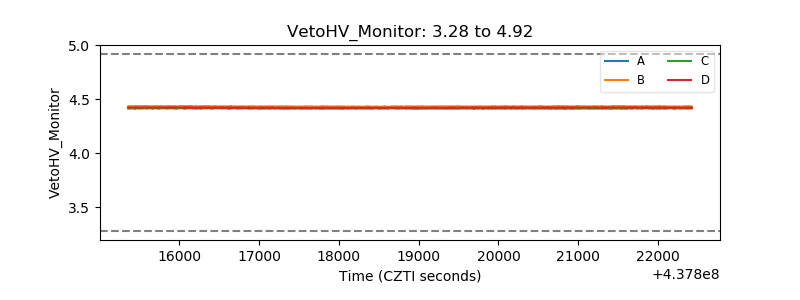 |
| Veto LLD | 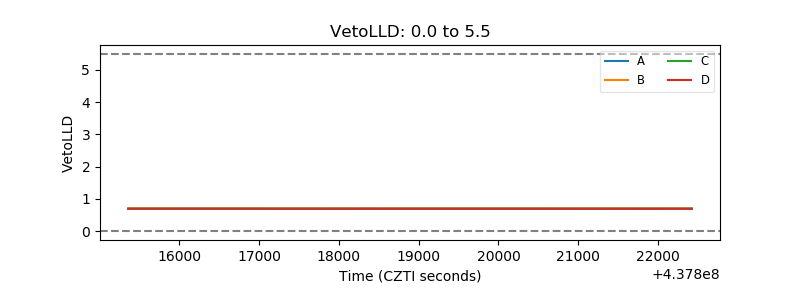 |
| Alpha Counter | 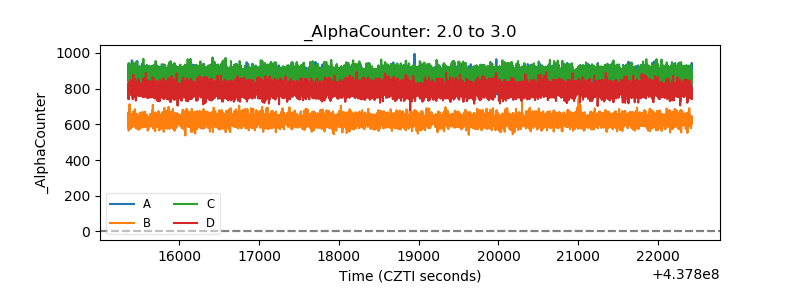 |
| _CPM_Rate | 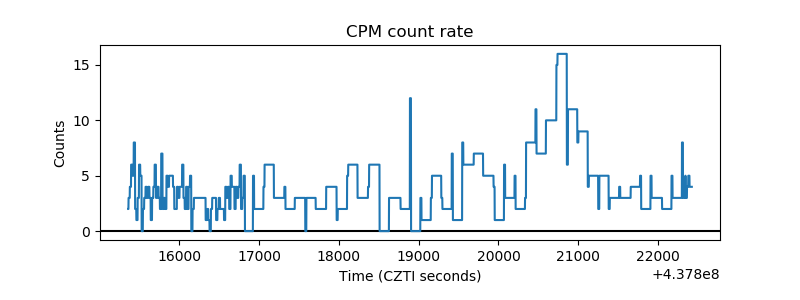 |
| CZT Counter | 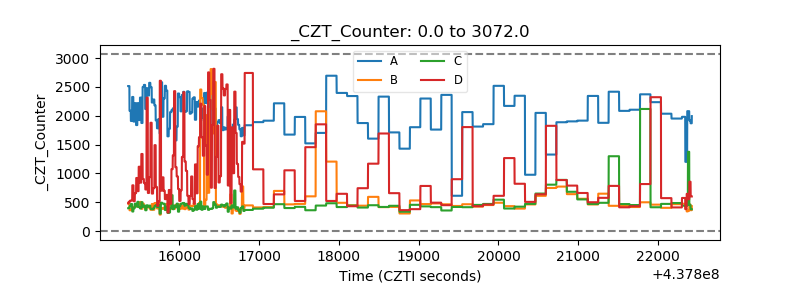 |
| +2.5 Volts monitor | 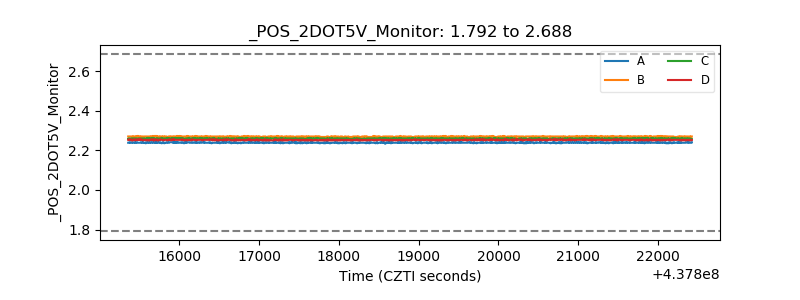 |
| +5 Volts monitor | 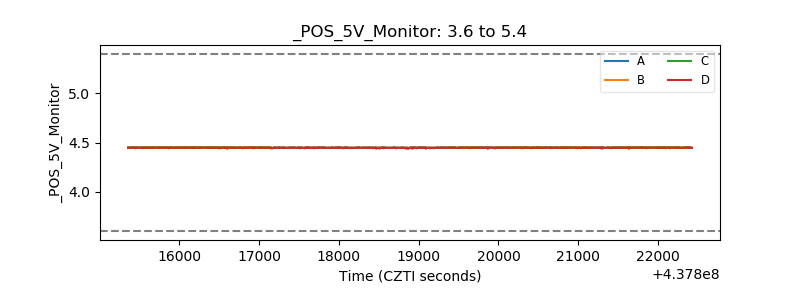 |
| _ROLL_ROT | 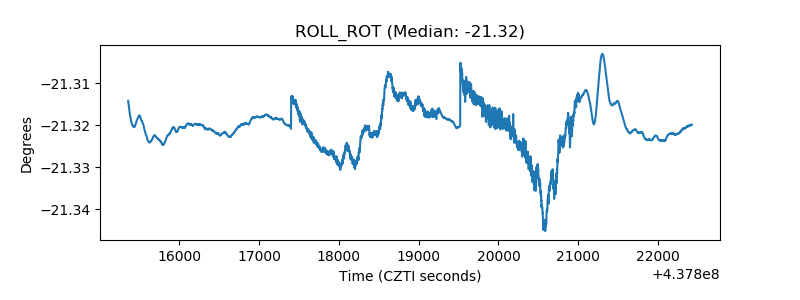 |
| _Roll_DEC | 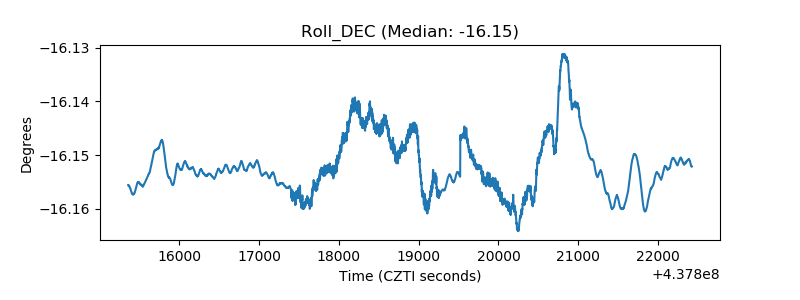 |
| _Roll_RA | 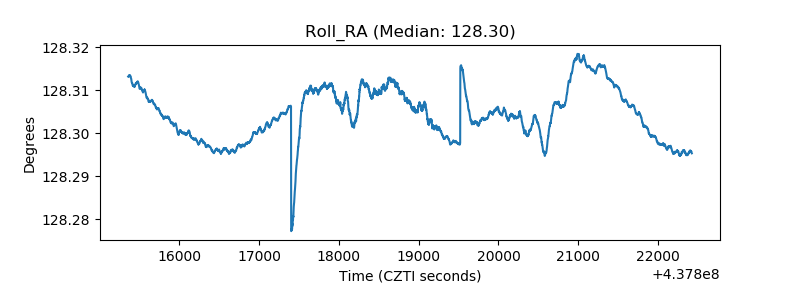 |
| Veto Counter | 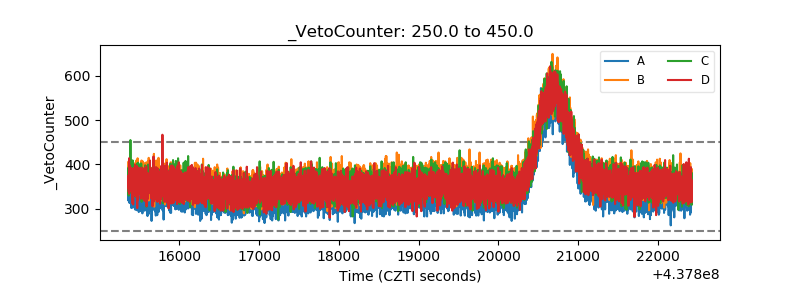 |