| Param | Original file | Final file |
|---|---|---|
| Filename | modeM0/AS1A13_065T06_9000005924_43990cztM0_level2.fits | modeM0/AS1A13_065T06_9000005924_43990cztM0_level2_quad_clean.evt |
| Size (bytes) | 1,795,775,040 | 254,090,880 |
| Size | 1.7 GB | 242.3 MB |
| Events in quadrant A | 31,834,271 | 764,831 |
| Events in quadrant B | 11,584,269 | 1,923,397 |
| Events in quadrant C | 9,421,357 | 1,952,705 |
| Events in quadrant D | 12,173,241 | 1,753,415 |
| Mode SS | |||
|---|---|---|---|
| Quadrant | BADHDUFLAG | Total packets | Discarded packets |
| A | 0 | 382 | 0 |
| B | 0 | 382 | 0 |
| C | 0 | 382 | 0 |
| D | 0 | 382 | 0 |
| Mode M9 | |||
|---|---|---|---|
| Quadrant | BADHDUFLAG | Total packets | Discarded packets |
| A | 0 | 18 | 0 |
| B | 0 | 18 | 0 |
| C | 0 | 18 | 0 |
| D | 0 | 18 | 0 |
| Mode M0 | |||
|---|---|---|---|
| Quadrant | BADHDUFLAG | Total packets | Discarded packets |
| A | 0 | 107759 | 3 |
| B | 0 | 47268 | 3 |
| C | 0 | 41494 | 3 |
| D | 0 | 49106 | 3 |
| Quadrant | Total seconds | Saturated seconds | Saturation percentage |
|---|---|---|---|
| A | 18840 | 12367 | 65.642251% |
| B | 18841 | 1284 | 6.814925% |
| C | 18840 | 311 | 1.650743% |
| D | 18840 | 719 | 3.816348% |
Noise dominated data is calculated using 1-second bins in cleaned event files. If a bin has >2000 counts, and if more than 50% of those come from <1% of pixels, then it is considered to be noise-dominated and hence unusable.
| Quadrant | # 1 sec bins | Bins with >0 counts | Bins with >2000 counts | High rate bins dominated by noise | Noise dominated (total time) | Noise dominated (detector-on time) | Marked lightcurve |
|---|---|---|---|---|---|---|---|
| A | 20615 | 18843 | 6185 | 6185 | 30.00% | 32.82% | 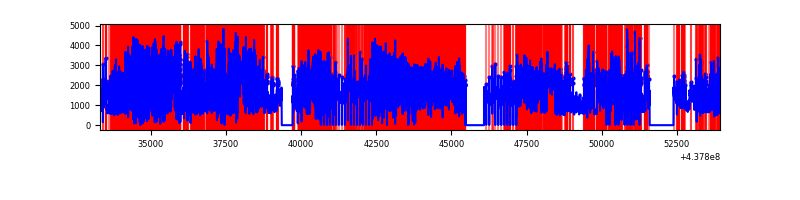 |
| B | 20616 | 18844 | 640 | 640 | 3.10% | 3.40% | 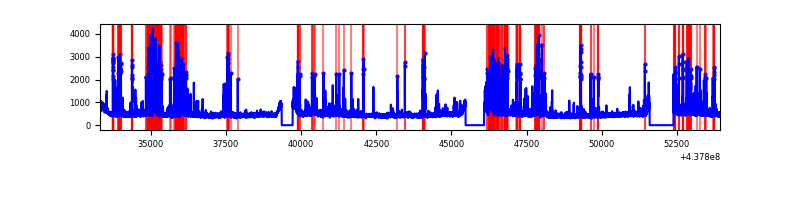 |
| C | 20615 | 18843 | 131 | 131 | 0.64% | 0.70% | 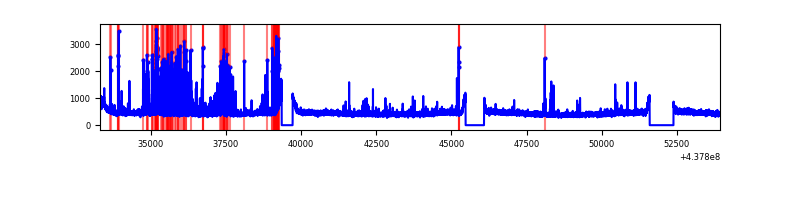 |
| D | 20615 | 18843 | 470 | 470 | 2.28% | 2.49% | 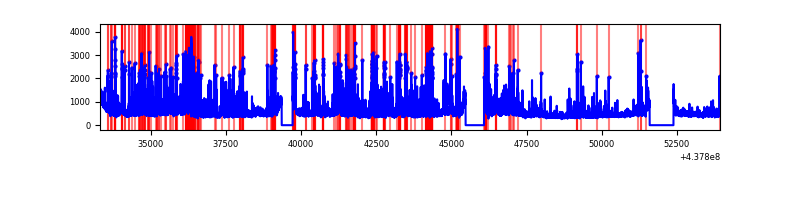 |
Top three noisy pixels from each quadrant. If the there are fewer than three noisy pixels in the level2.evt file, extra rows are filled as -1
| Pixel properties | Quadrant properties | ||||||
|---|---|---|---|---|---|---|---|
| Quadrant | DetID | PixID | Counts | Sigma | Mean | Median | Sigma |
| A | 15 | 223 | 22906734 | 91599.31 | 1196 | 1170 | 250.1 |
| A | 14 | 238 | 2573943 | 10288.52 | 1196 | 1170 | 250.1 |
| A | 10 | 83 | 1702018 | 6801.69 | 1196 | 1170 | 250.1 |
| B | 5 | 172 | 2326759 | 5554.79 | 2094 | 2024 | 418.5 |
| B | 15 | 36 | 334296 | 793.94 | 2094 | 2024 | 418.5 |
| B | 4 | 171 | 138540 | 326.2 | 2094 | 2024 | 418.5 |
| C | 15 | 158 | 669794 | 1330.44 | 2119 | 2132 | 501.8 |
| C | 14 | 254 | 206691 | 407.62 | 2119 | 2132 | 501.8 |
| C | 3 | 233 | 176195 | 346.85 | 2119 | 2132 | 501.8 |
| D | 1 | 52 | 1388893 | 2552.26 | 2113 | 2042 | 543.4 |
| D | 2 | 120 | 507555 | 930.31 | 2113 | 2042 | 543.4 |
| D | 13 | 171 | 485111 | 889.01 | 2113 | 2042 | 543.4 |
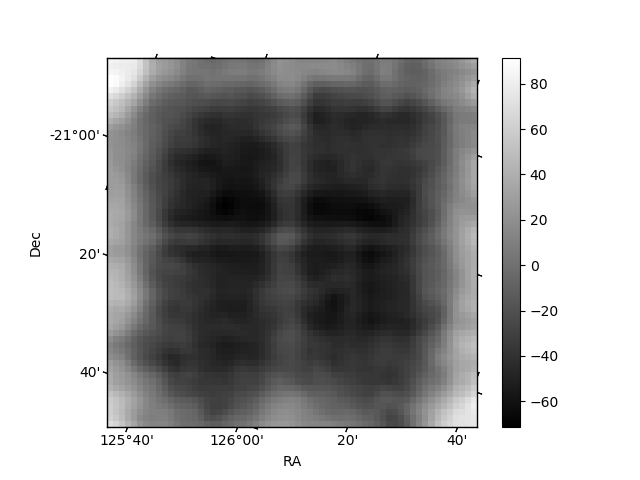
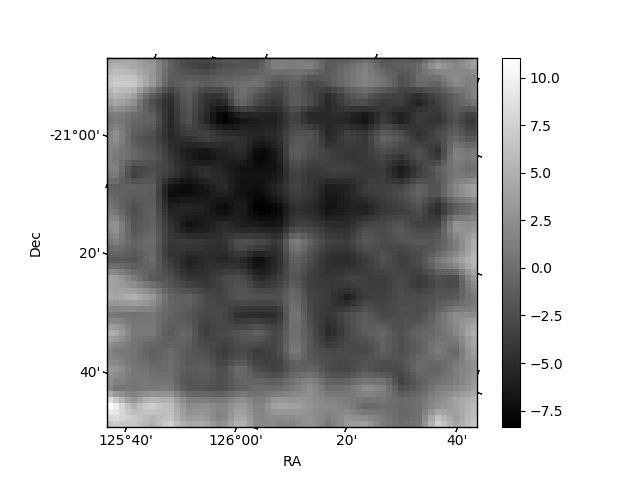
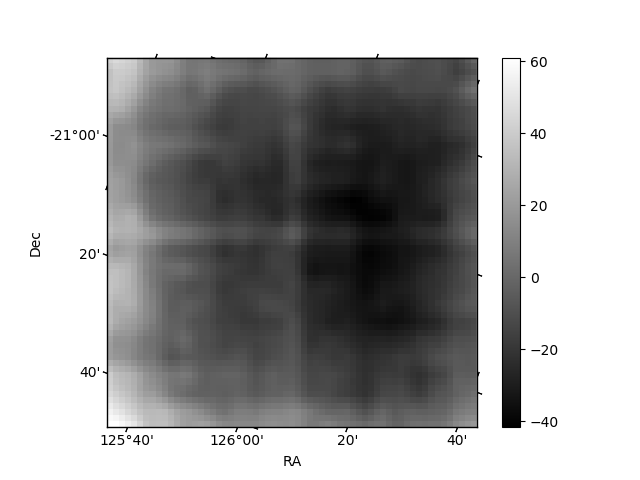
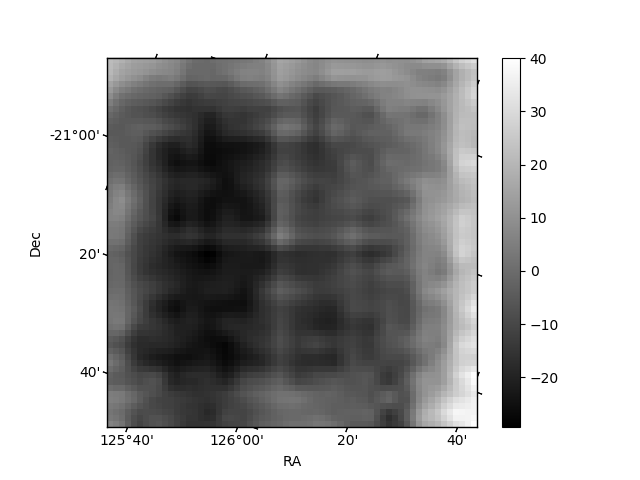
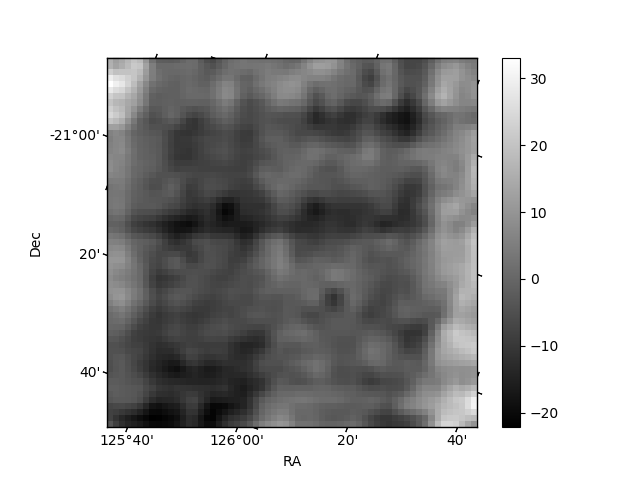
Histogram calculated using DETX and DETY for each event in the final _common_clean file
| Quadrant A | 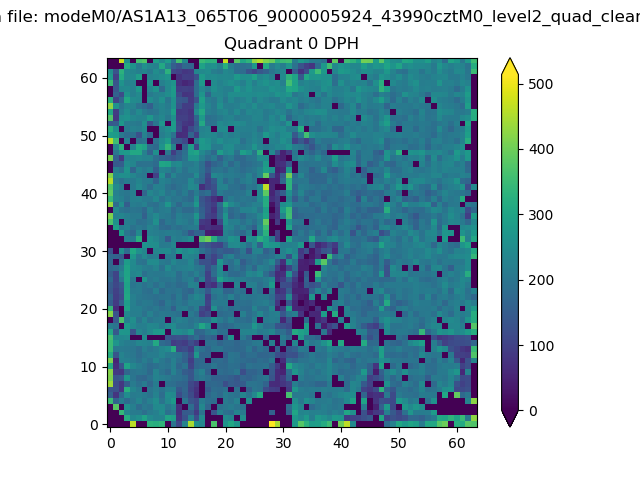 |
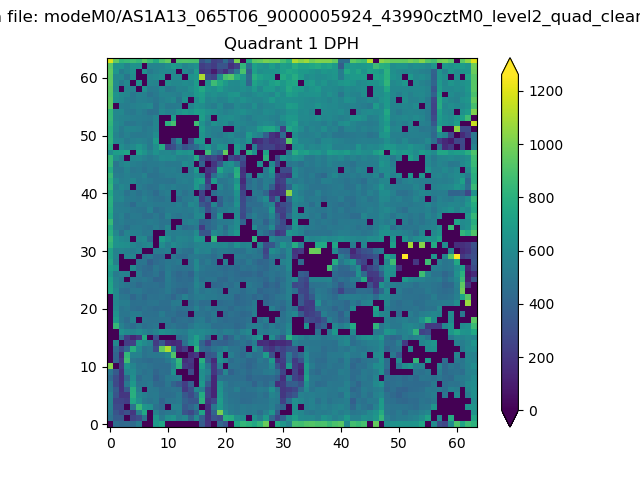 |
Quadrant B |
|---|---|---|---|
| Quadrant D | 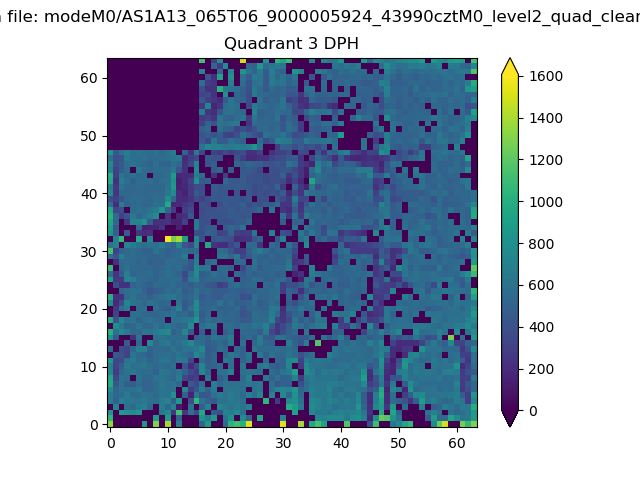 |
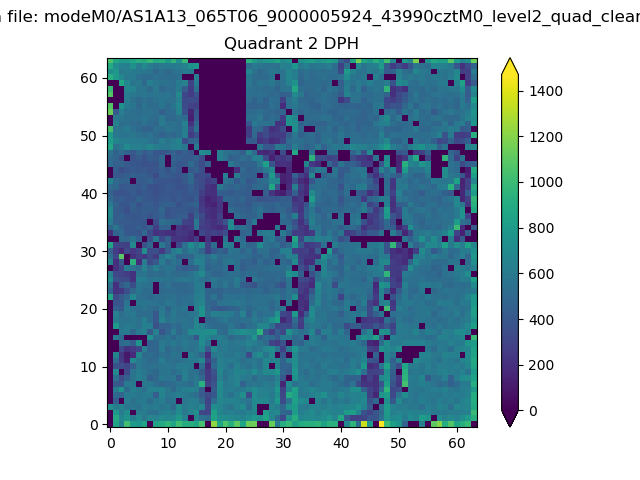 |
Quadrant C |
| Plot type | Count rate plots | Images |
|---|---|---|
| Comparison with Poisson distribution Blue bars denote a histogram of data divided into 1 sec bins. Red curve is a Poisson curve with rate = median count rate of data. |
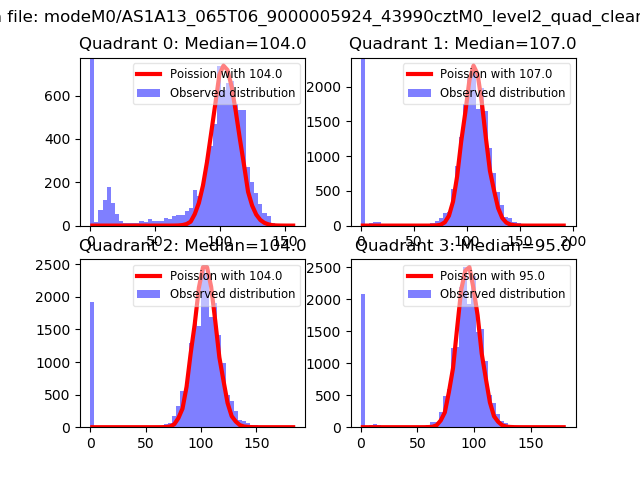 |
 |
| Quadrant-wise count rates Data is divided into 100 sec bins |
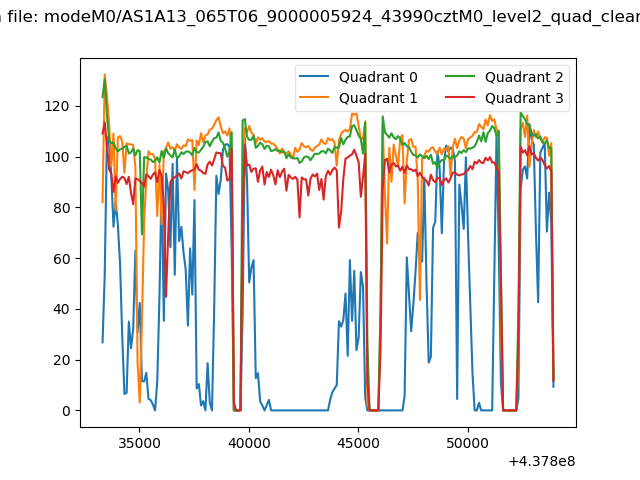 |
|
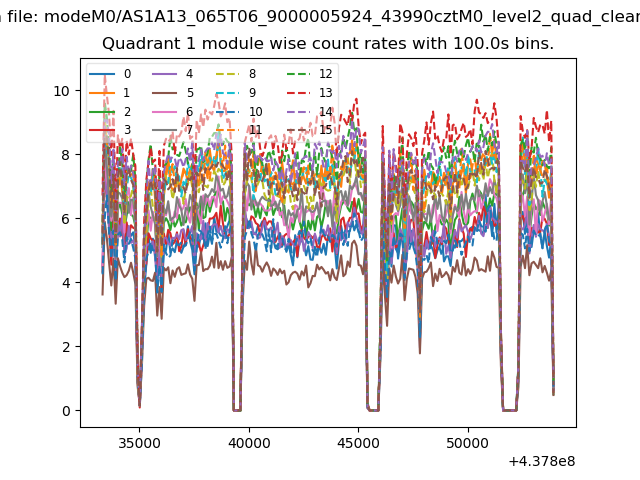
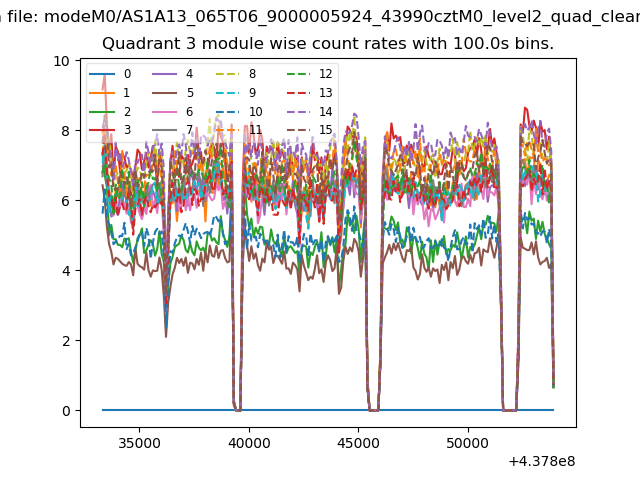
| Module-wise count rates for Quadrant A Data is divided into 100 sec bins |
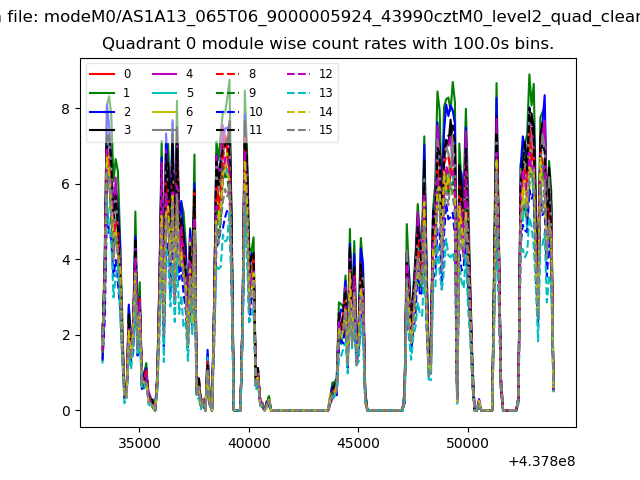 |
 |
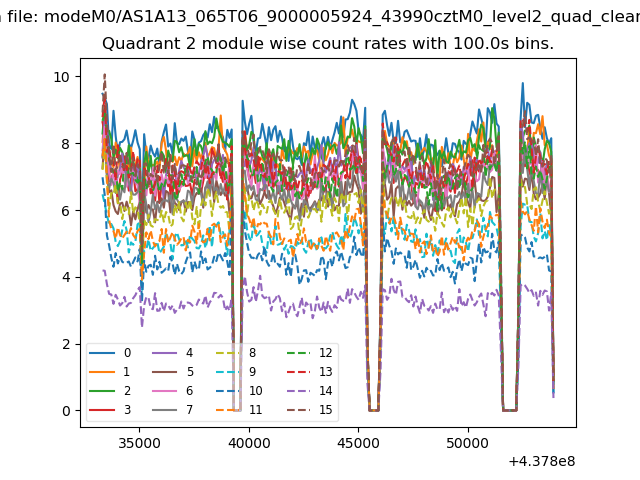
| Module-wise count rates for Quadrant B Data is divided into 100 sec bins |
 |
 |
| Module-wise count rates for Quadrant C Data is divided into 100 sec bins |
 |
 |
| Module-wise count rates for Quadrant D Data is divided into 100 sec bins |
 |
 |
| Parameter | Plot |
|---|---|
| CZT HV Monitor | 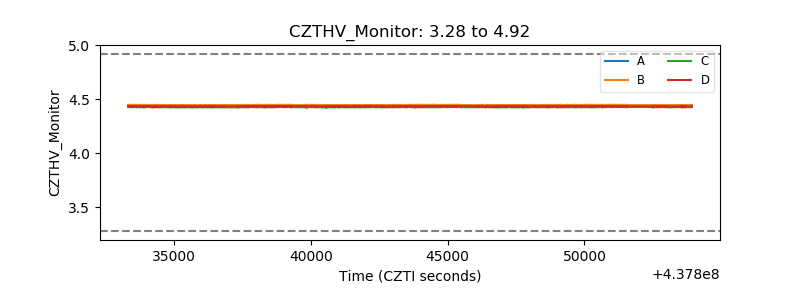 |
| D_VDD | 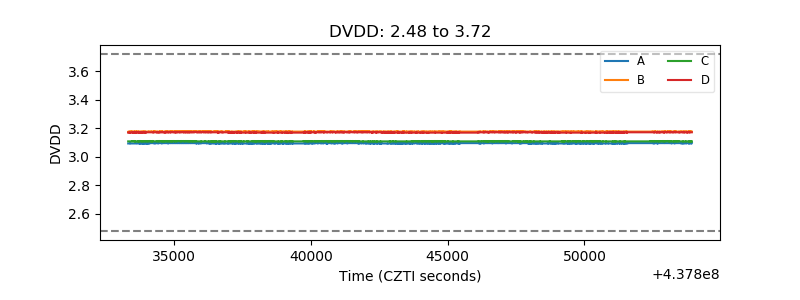 |
| Temperature 1 | 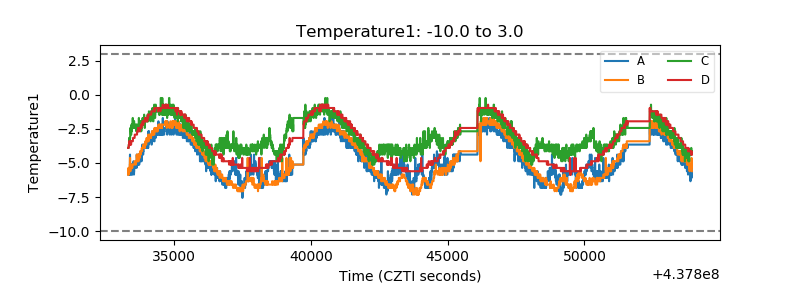 |
| Veto HV Monitor | 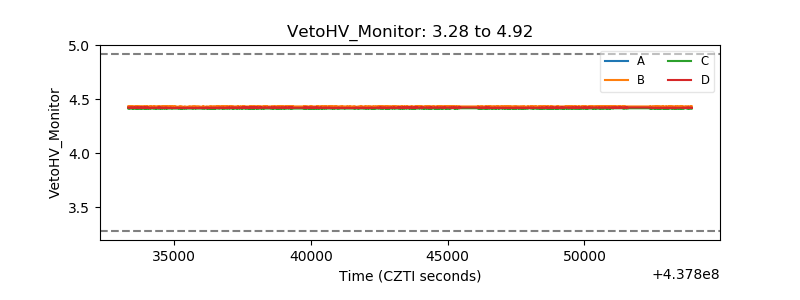 |
| Veto LLD | 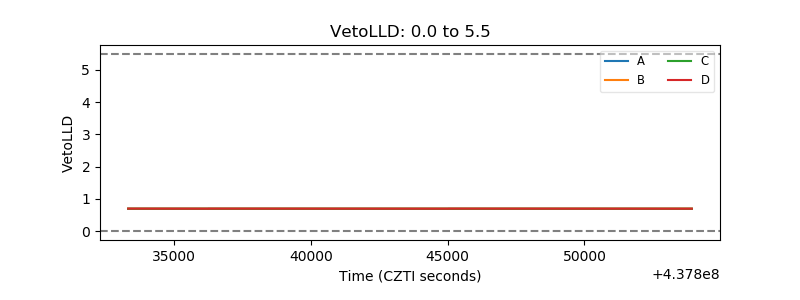 |
| Alpha Counter | 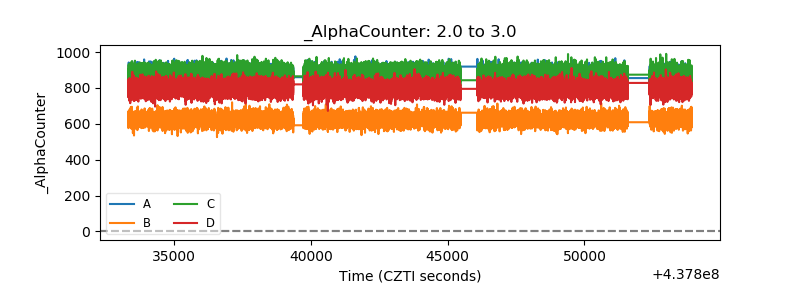 |
| _CPM_Rate | 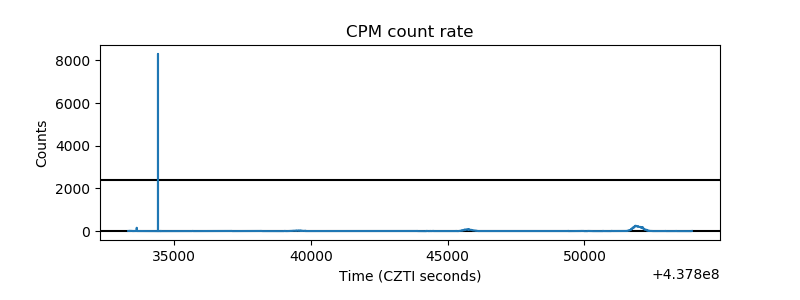 |
| CZT Counter | 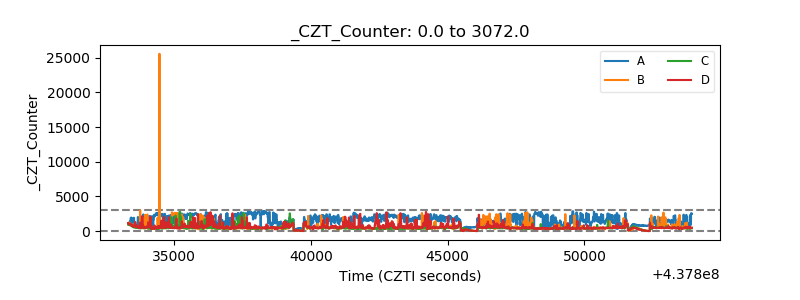 |
| +2.5 Volts monitor | 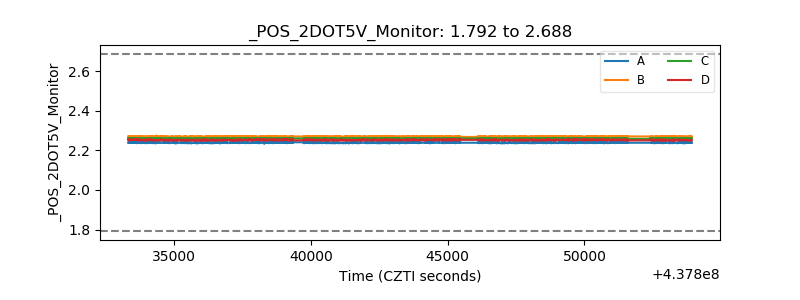 |
| +5 Volts monitor | 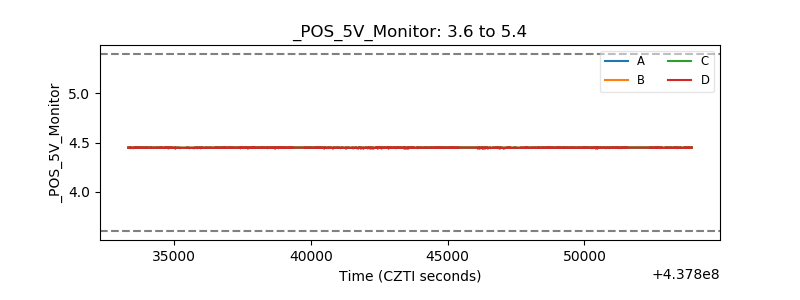 |
| _ROLL_ROT | 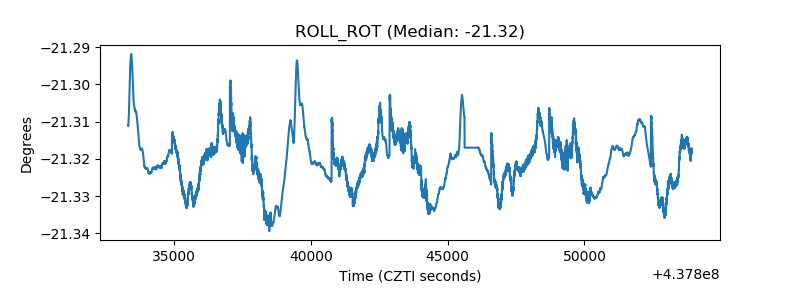 |
| _Roll_DEC |  |
| _Roll_RA | 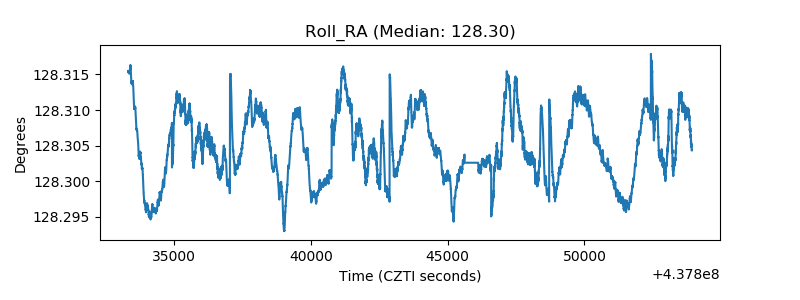 |
| Veto Counter | 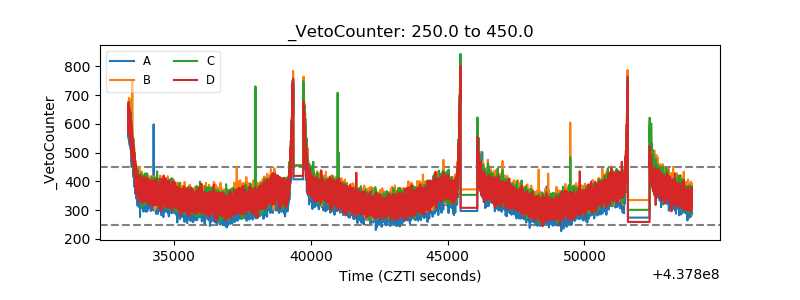 |