| Param | Original file | Final file |
|---|---|---|
| Filename | modeM0/AS1A13_065T06_9000005924_43993cztM0_level2.fits | modeM0/AS1A13_065T06_9000005924_43993cztM0_level2_quad_clean.evt |
| Size (bytes) | 602,766,720 | 110,998,080 |
| Size | 574.8 MB | 105.9 MB |
| Events in quadrant A | 8,543,686 | 637,553 |
| Events in quadrant B | 4,715,059 | 763,359 |
| Events in quadrant C | 3,682,308 | 781,515 |
| Events in quadrant D | 4,819,669 | 683,668 |
| Mode SS | |||
|---|---|---|---|
| Quadrant | BADHDUFLAG | Total packets | Discarded packets |
| A | 0 | 146 | 0 |
| B | 0 | 146 | 0 |
| C | 0 | 146 | 0 |
| D | 0 | 146 | 0 |
| Mode M9 | |||
|---|---|---|---|
| Quadrant | BADHDUFLAG | Total packets | Discarded packets |
| A | 0 | 20 | 0 |
| B | 0 | 20 | 0 |
| C | 0 | 20 | 0 |
| D | 0 | 20 | 0 |
| Mode M0 | |||
|---|---|---|---|
| Quadrant | BADHDUFLAG | Total packets | Discarded packets |
| A | 0 | 30467 | 2 |
| B | 0 | 18916 | 3 |
| C | 0 | 15916 | 2 |
| D | 0 | 19258 | 2 |
| Quadrant | Total seconds | Saturated seconds | Saturation percentage |
|---|---|---|---|
| A | 7105 | 1671 | 23.518649% |
| B | 7105 | 681 | 9.584799% |
| C | 7105 | 133 | 1.871921% |
| D | 7105 | 470 | 6.615060% |
Noise dominated data is calculated using 1-second bins in cleaned event files. If a bin has >2000 counts, and if more than 50% of those come from <1% of pixels, then it is considered to be noise-dominated and hence unusable.
| Quadrant | # 1 sec bins | Bins with >0 counts | Bins with >2000 counts | High rate bins dominated by noise | Noise dominated (total time) | Noise dominated (detector-on time) | Marked lightcurve |
|---|---|---|---|---|---|---|---|
| A | 9140 | 7106 | 1286 | 1286 | 14.07% | 18.10% | 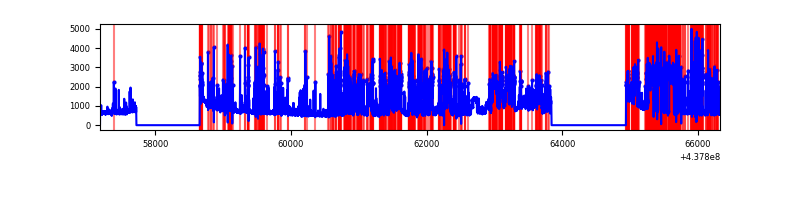 |
| B | 9140 | 7107 | 326 | 326 | 3.57% | 4.59% | 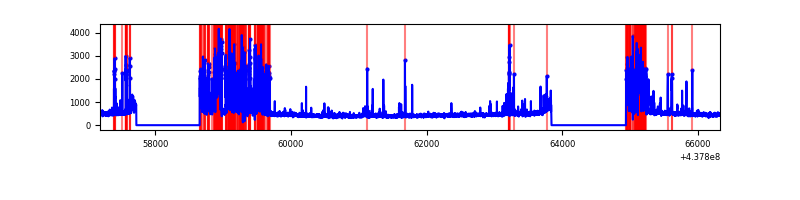 |
| C | 9140 | 7107 | 72 | 72 | 0.79% | 1.01% | 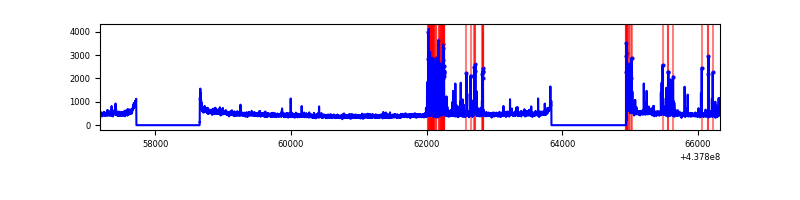 |
| D | 9140 | 7107 | 361 | 361 | 3.95% | 5.08% | 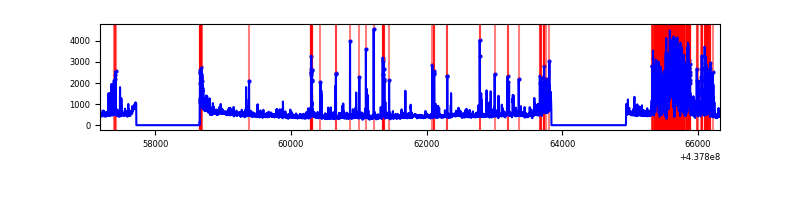 |
Top three noisy pixels from each quadrant. If the there are fewer than three noisy pixels in the level2.evt file, extra rows are filled as -1
| Pixel properties | Quadrant properties | ||||||
|---|---|---|---|---|---|---|---|
| Quadrant | DetID | PixID | Counts | Sigma | Mean | Median | Sigma |
| A | 15 | 223 | 2249900 | 14806.39 | 729 | 713 | 151.9 |
| A | 14 | 238 | 2184256 | 14374.25 | 729 | 713 | 151.9 |
| A | 10 | 83 | 1136911 | 7479.59 | 729 | 713 | 151.9 |
| B | 5 | 172 | 1299345 | 8268.39 | 797 | 774 | 157.1 |
| B | 15 | 36 | 122280 | 773.66 | 797 | 774 | 157.1 |
| B | 0 | 183 | 25630 | 158.27 | 797 | 774 | 157.1 |
| C | 14 | 254 | 454807 | 2358.5 | 810 | 815 | 192.5 |
| C | 3 | 233 | 59693 | 305.87 | 810 | 815 | 192.5 |
| C | 13 | 61 | 5266 | 23.12 | 810 | 815 | 192.5 |
| D | 5 | 235 | 856114 | 4322.72 | 785 | 764 | 197.9 |
| D | 1 | 52 | 343492 | 1732.06 | 785 | 764 | 197.9 |
| D | 4 | 172 | 118313 | 594.06 | 785 | 764 | 197.9 |
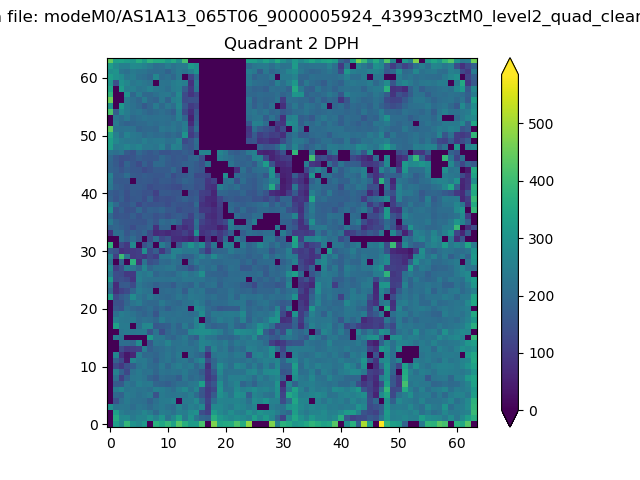
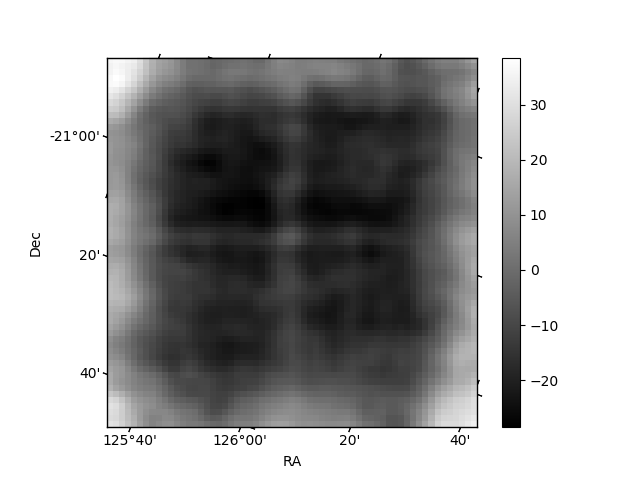
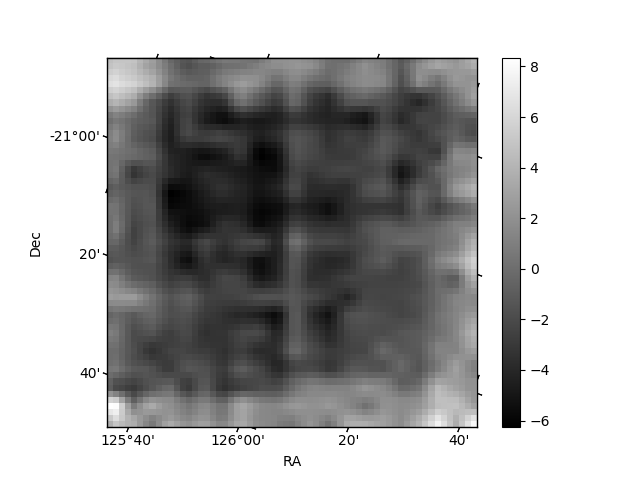
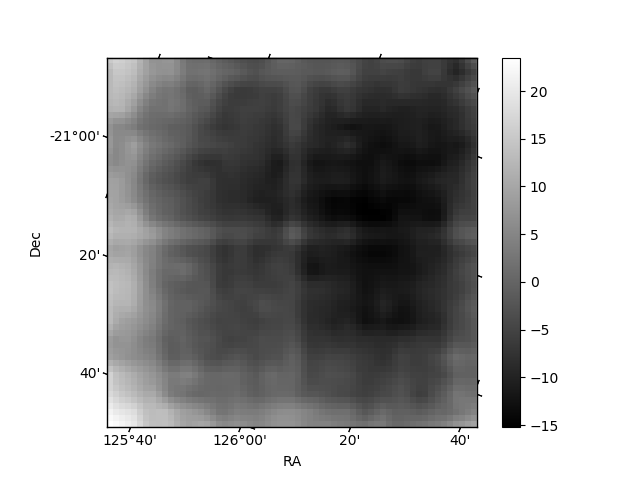
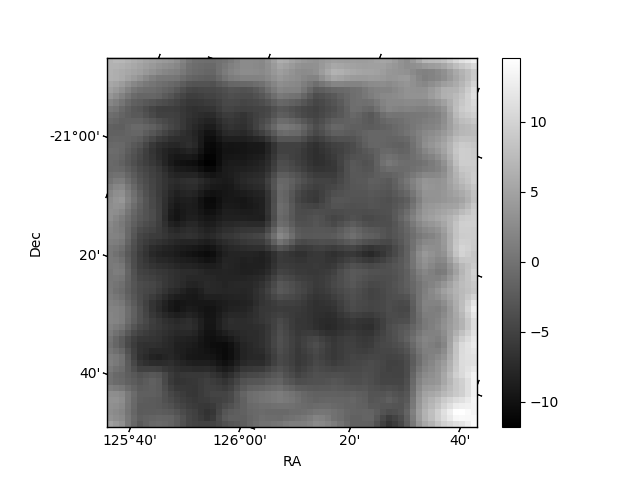
Histogram calculated using DETX and DETY for each event in the final _common_clean file
| Quadrant A | 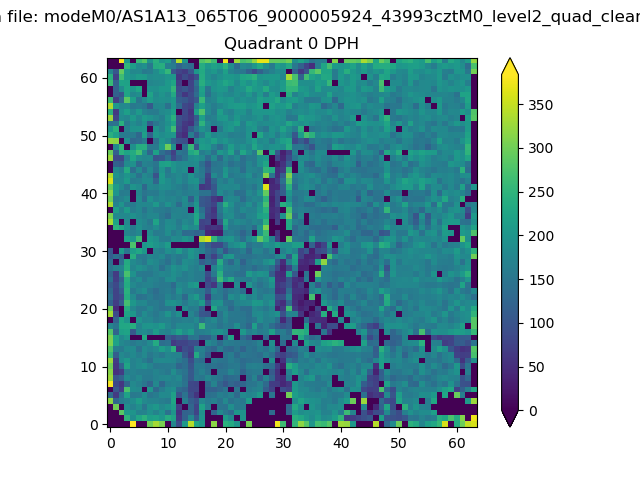 |
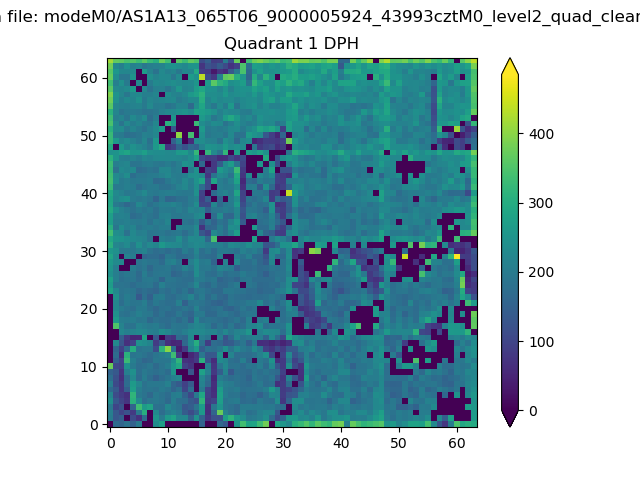 |
Quadrant B |
|---|---|---|---|
| Quadrant D | 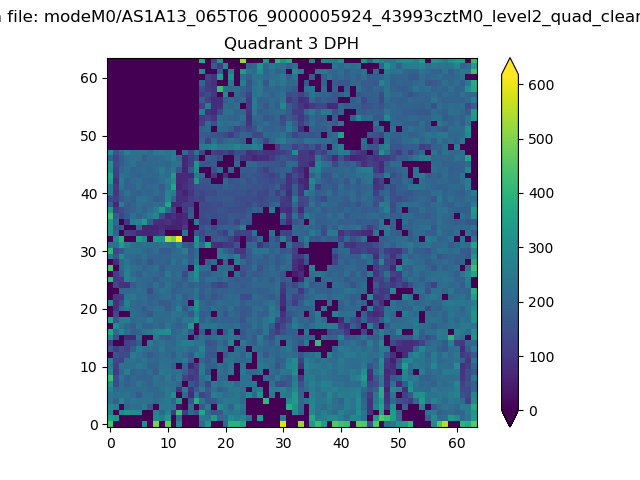 |
 |
Quadrant C |
| Plot type | Count rate plots | Images |
|---|---|---|
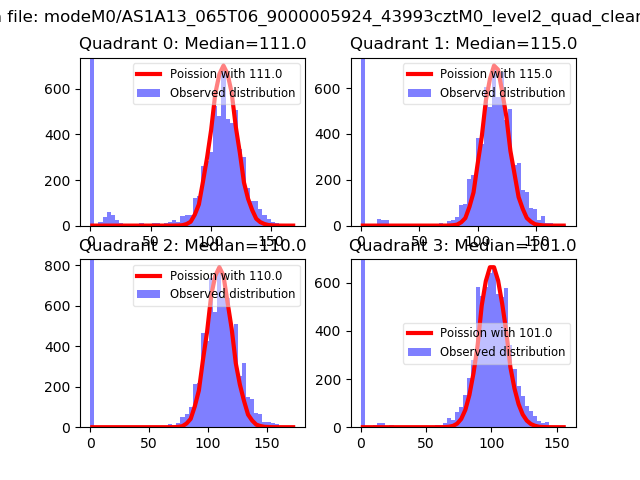
| Comparison with Poisson distribution Blue bars denote a histogram of data divided into 1 sec bins. Red curve is a Poisson curve with rate = median count rate of data. |
 |
 |
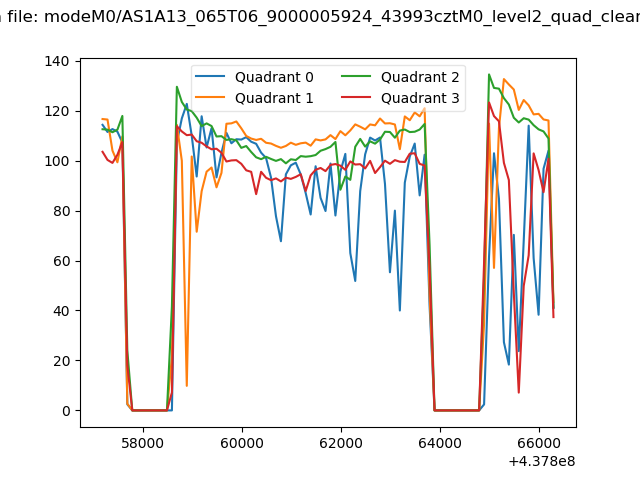
| Quadrant-wise count rates Data is divided into 100 sec bins |
 |
|
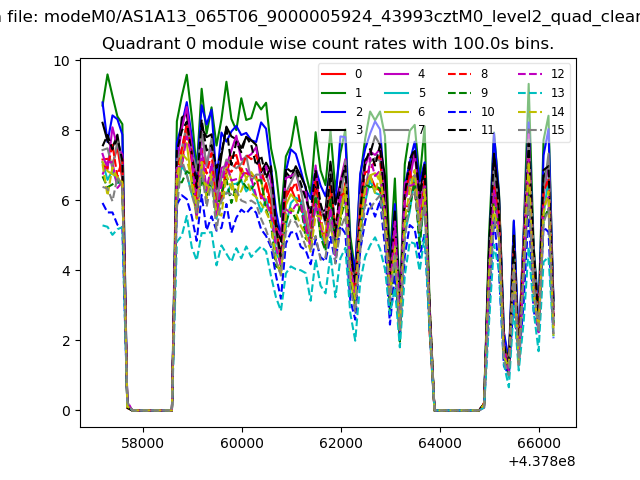
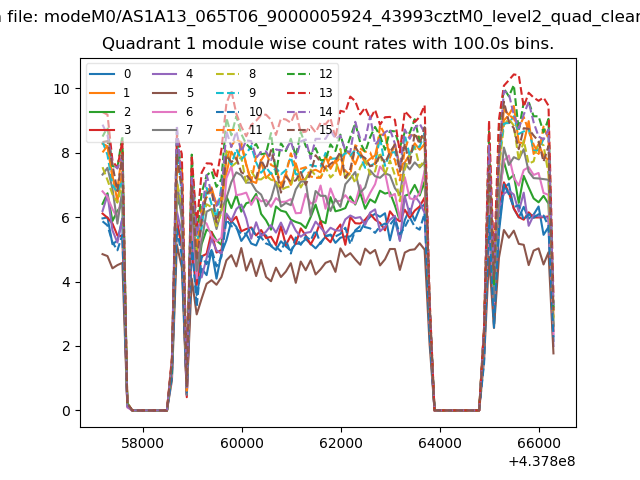
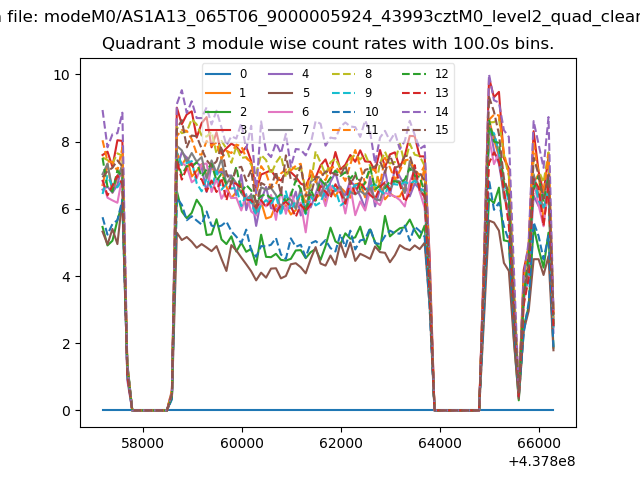
| Module-wise count rates for Quadrant A Data is divided into 100 sec bins |
 |
 |
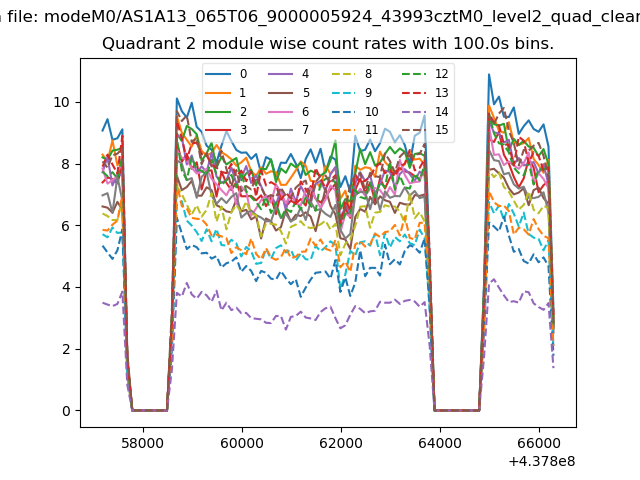
| Module-wise count rates for Quadrant B Data is divided into 100 sec bins |
 |
 |
| Module-wise count rates for Quadrant C Data is divided into 100 sec bins |
 |
 |
| Module-wise count rates for Quadrant D Data is divided into 100 sec bins |
 |
 |
| Parameter | Plot |
|---|---|
| CZT HV Monitor | 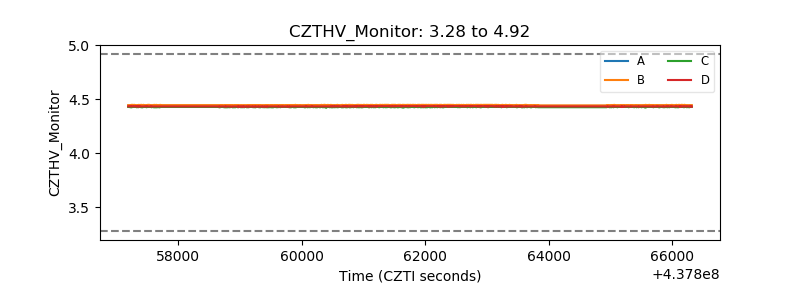 |
| D_VDD | 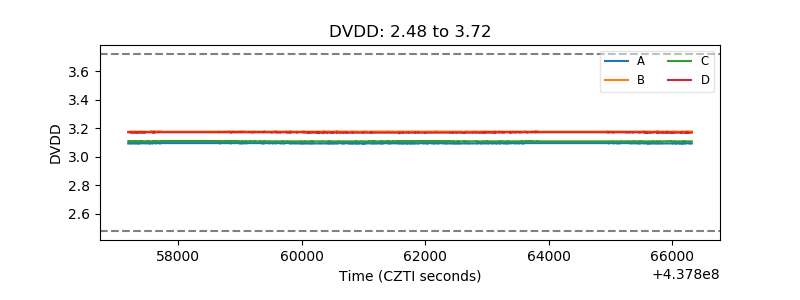 |
| Temperature 1 | 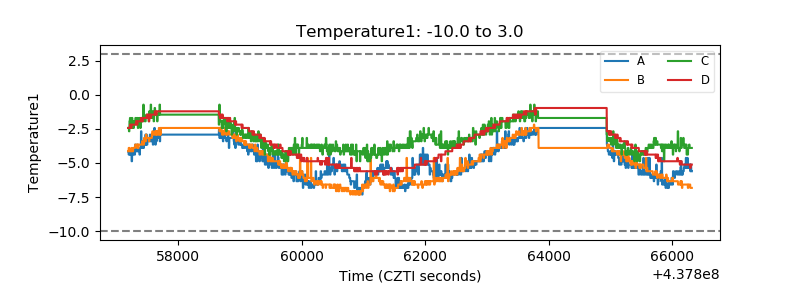 |
| Veto HV Monitor | 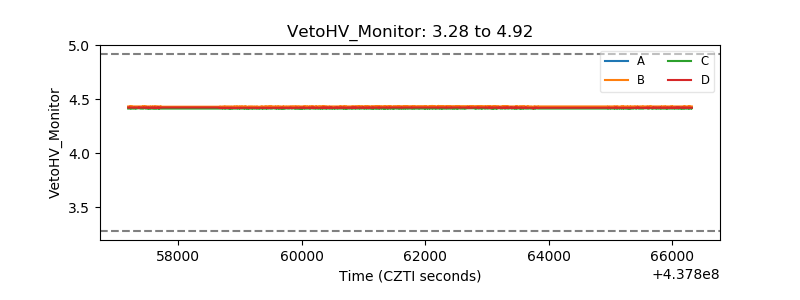 |
| Veto LLD | 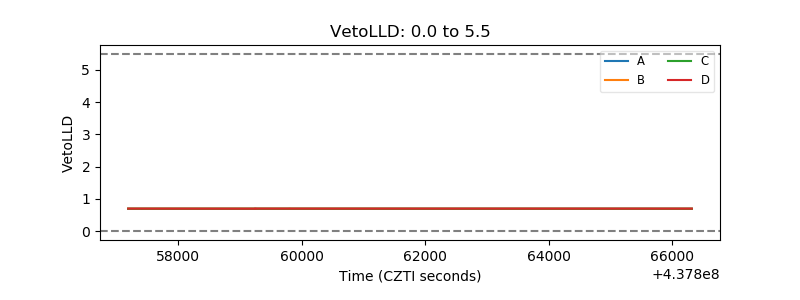 |
| Alpha Counter | 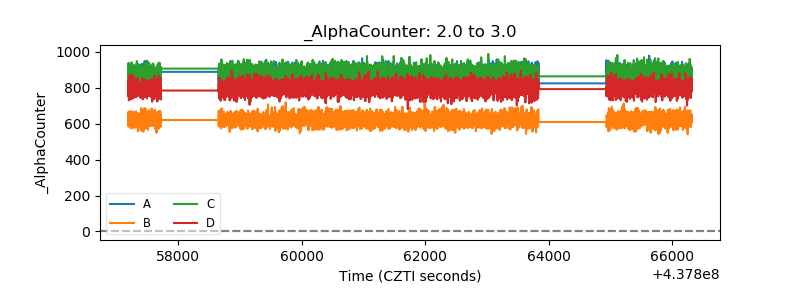 |
| _CPM_Rate | 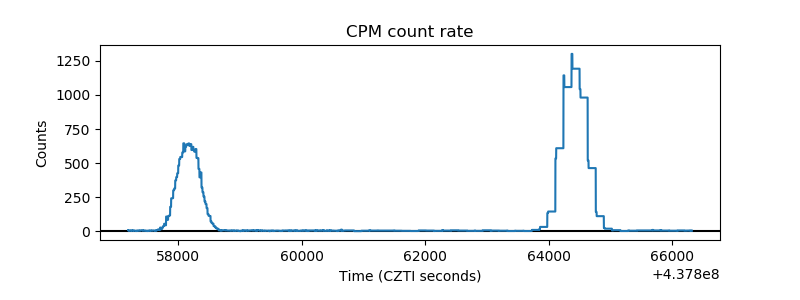 |
| CZT Counter | 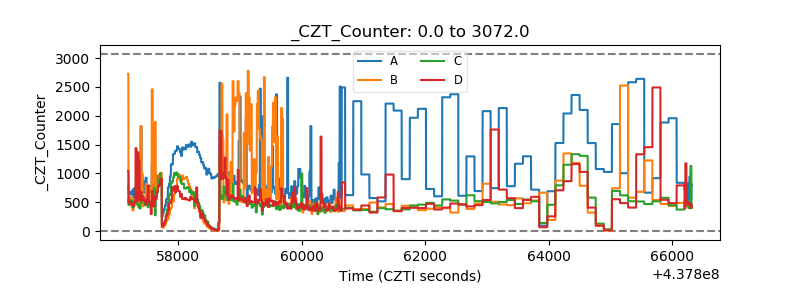 |
| +2.5 Volts monitor | 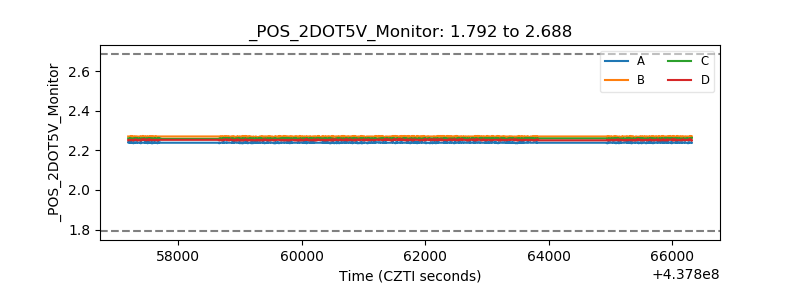 |
| +5 Volts monitor | 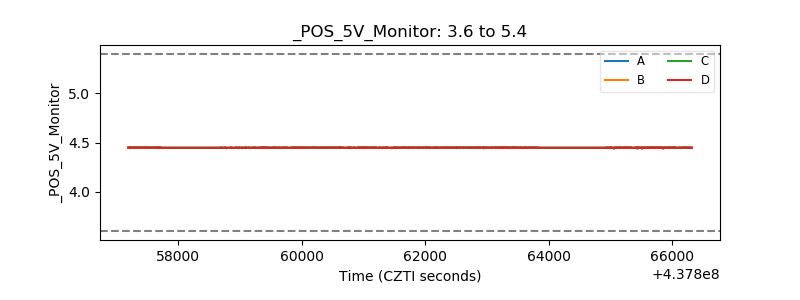 |
| _ROLL_ROT | 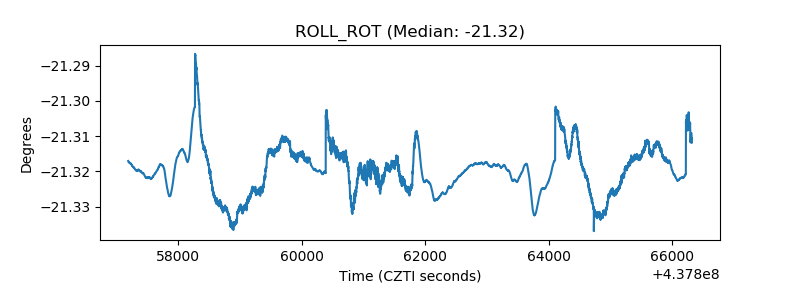 |
| _Roll_DEC | 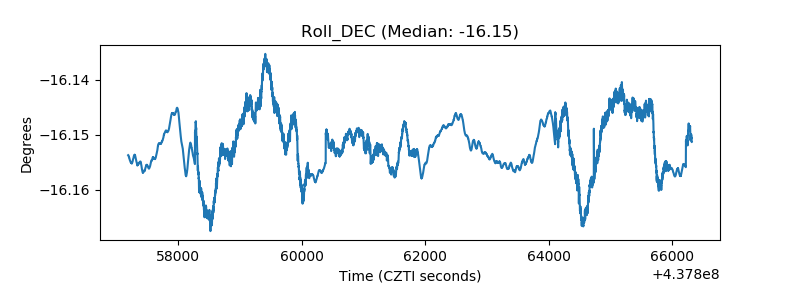 |
| _Roll_RA | 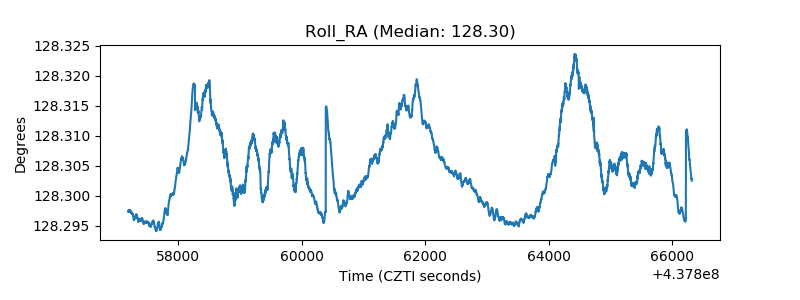 |
| Veto Counter | 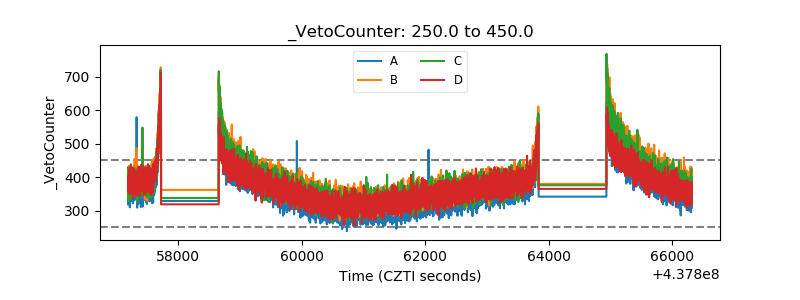 |