| Param | Original file | Final file |
|---|---|---|
| Filename | modeM0/AS1A13_065T06_9000005924_43995cztM0_level2.fits | modeM0/AS1A13_065T06_9000005924_43995cztM0_level2_quad_clean.evt |
| Size (bytes) | 517,849,920 | 109,748,160 |
| Size | 493.9 MB | 104.7 MB |
| Events in quadrant A | 7,752,643 | 561,735 |
| Events in quadrant B | 3,480,514 | 829,438 |
| Events in quadrant C | 3,141,311 | 786,872 |
| Events in quadrant D | 4,274,290 | 679,066 |
| Mode SS | |||
|---|---|---|---|
| Quadrant | BADHDUFLAG | Total packets | Discarded packets |
| A | 0 | 136 | 0 |
| B | 0 | 136 | 0 |
| C | 0 | 136 | 0 |
| D | 0 | 136 | 0 |
| Mode M9 | |||
|---|---|---|---|
| Quadrant | BADHDUFLAG | Total packets | Discarded packets |
| A | 0 | 17 | 0 |
| B | 0 | 18 | 0 |
| C | 0 | 18 | 0 |
| D | 0 | 18 | 0 |
| Mode M0 | |||
|---|---|---|---|
| Quadrant | BADHDUFLAG | Total packets | Discarded packets |
| A | 0 | 27801 | 2 |
| B | 0 | 14782 | 2 |
| C | 0 | 13886 | 2 |
| D | 0 | 17359 | 2 |
| Quadrant | Total seconds | Saturated seconds | Saturation percentage |
|---|---|---|---|
| A | 6689 | 2023 | 30.243684% |
| B | 6689 | 84 | 1.255793% |
| C | 6688 | 16 | 0.239234% |
| D | 6688 | 311 | 4.650120% |
Noise dominated data is calculated using 1-second bins in cleaned event files. If a bin has >2000 counts, and if more than 50% of those come from <1% of pixels, then it is considered to be noise-dominated and hence unusable.
| Quadrant | # 1 sec bins | Bins with >0 counts | Bins with >2000 counts | High rate bins dominated by noise | Noise dominated (total time) | Noise dominated (detector-on time) | Marked lightcurve |
|---|---|---|---|---|---|---|---|
| A | 7934 | 6690 | 1165 | 1165 | 14.68% | 17.41% | 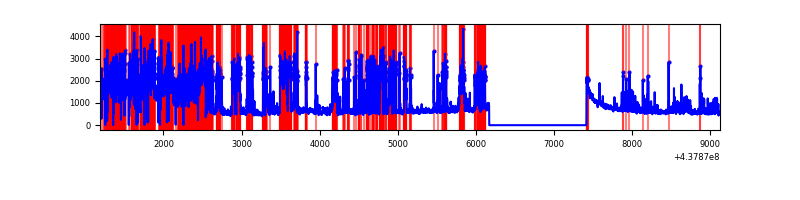 |
| B | 7934 | 6690 | 33 | 33 | 0.42% | 0.49% | 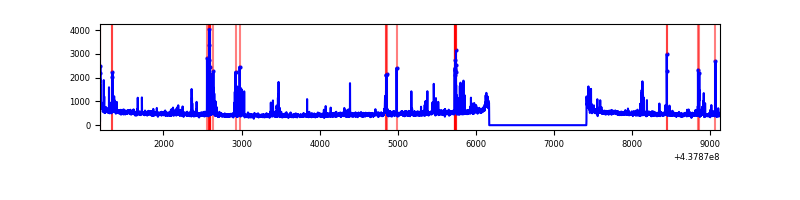 |
| C | 7933 | 6689 | 5 | 5 | 0.06% | 0.07% | 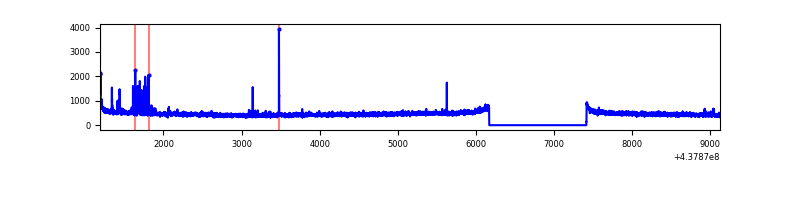 |
| D | 7933 | 6689 | 256 | 256 | 3.23% | 3.83% | 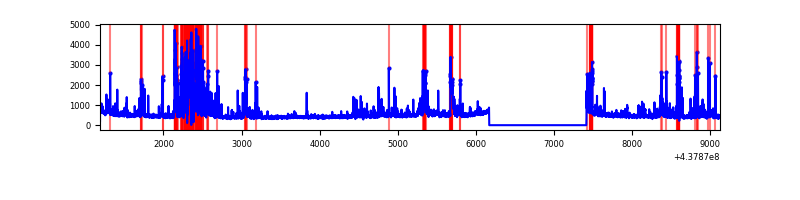 |
Top three noisy pixels from each quadrant. If the there are fewer than three noisy pixels in the level2.evt file, extra rows are filled as -1
| Pixel properties | Quadrant properties | ||||||
|---|---|---|---|---|---|---|---|
| Quadrant | DetID | PixID | Counts | Sigma | Mean | Median | Sigma |
| A | 15 | 223 | 2402138 | 18919.46 | 612 | 601 | 126.9 |
| A | 14 | 238 | 1514196 | 11924.2 | 612 | 601 | 126.9 |
| A | 10 | 83 | 908793 | 7154.8 | 612 | 601 | 126.9 |
| B | 5 | 172 | 240335 | 1543.56 | 787 | 764 | 155.2 |
| B | 0 | 245 | 34989 | 220.51 | 787 | 764 | 155.2 |
| B | 12 | 111 | 18825 | 116.37 | 787 | 764 | 155.2 |
| C | 14 | 254 | 77152 | 419.86 | 773 | 779 | 181.9 |
| C | 3 | 233 | 35528 | 191.03 | 773 | 779 | 181.9 |
| C | 9 | 237 | 9426 | 47.54 | 773 | 779 | 181.9 |
| D | 5 | 235 | 698508 | 3727.07 | 747 | 728 | 187.2 |
| D | 13 | 249 | 172935 | 919.81 | 747 | 728 | 187.2 |
| D | 13 | 171 | 140332 | 745.67 | 747 | 728 | 187.2 |
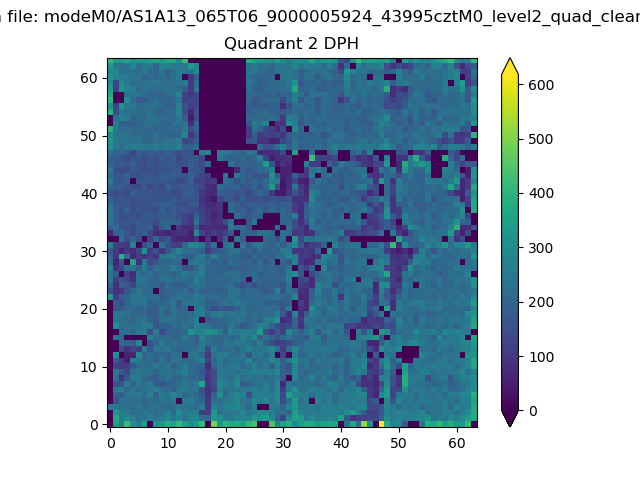
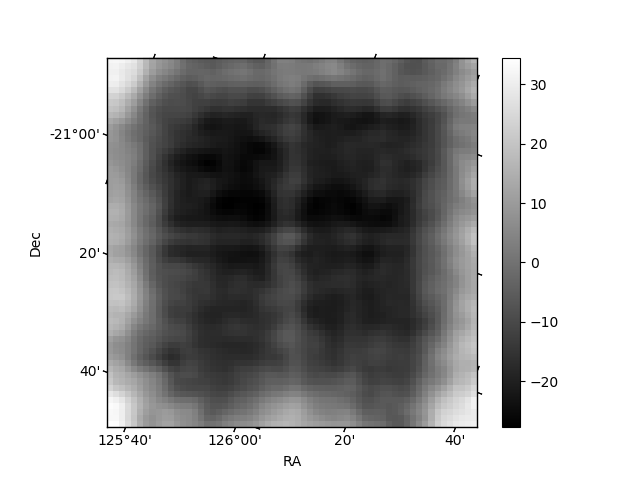
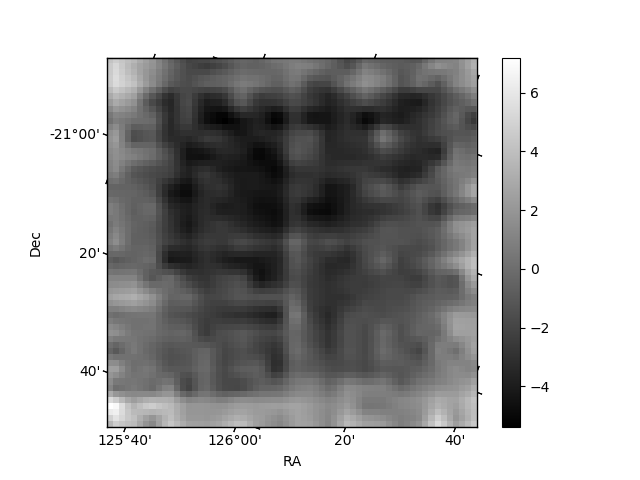
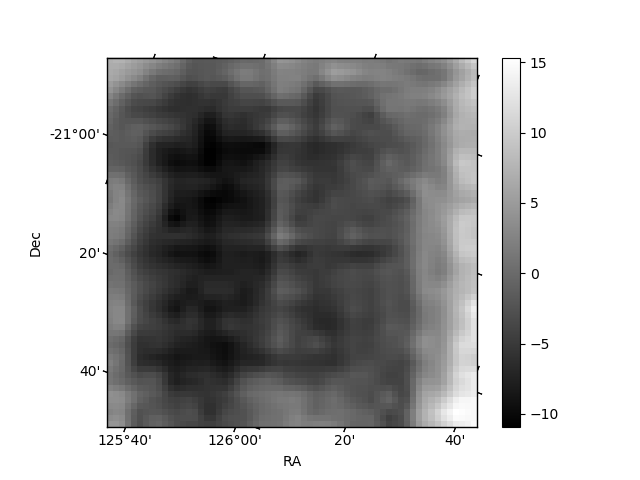
Histogram calculated using DETX and DETY for each event in the final _common_clean file
| Quadrant A | 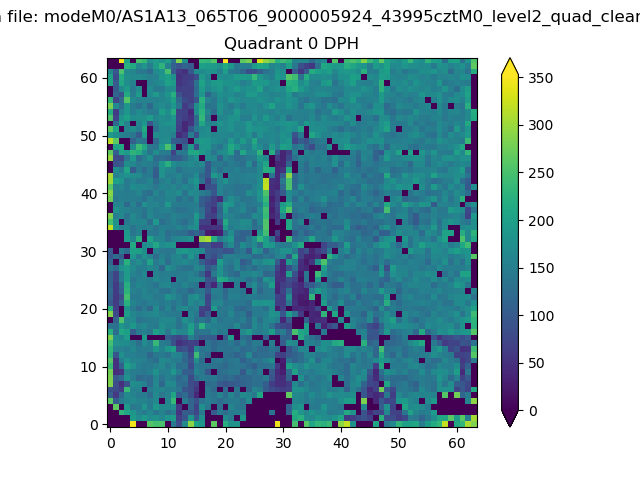 |
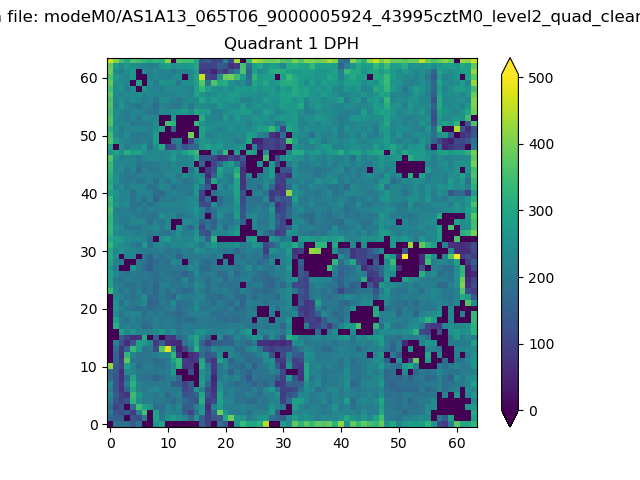 |
Quadrant B |
|---|---|---|---|
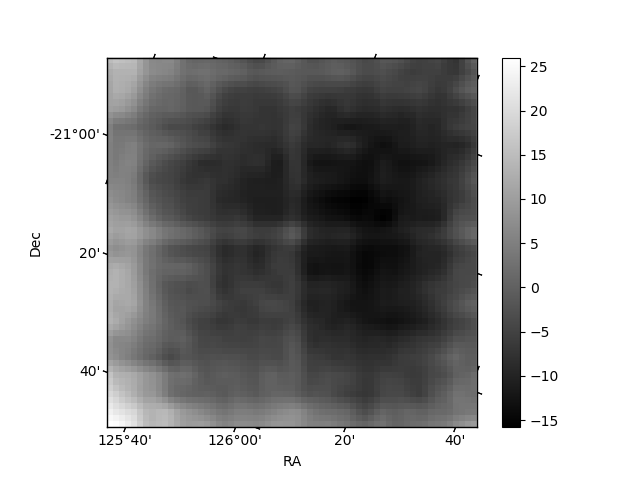
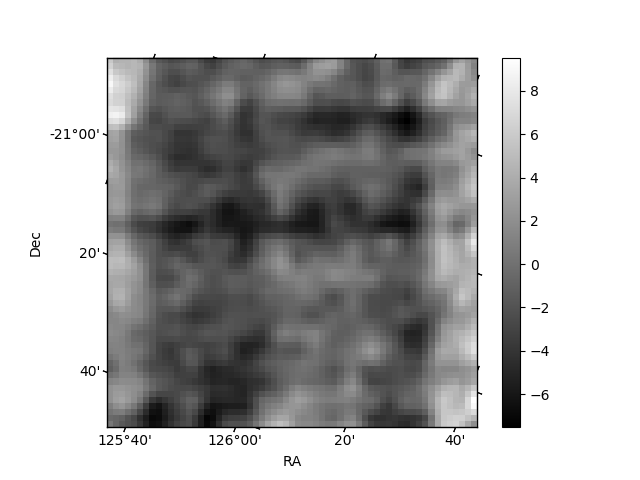
| Quadrant D | 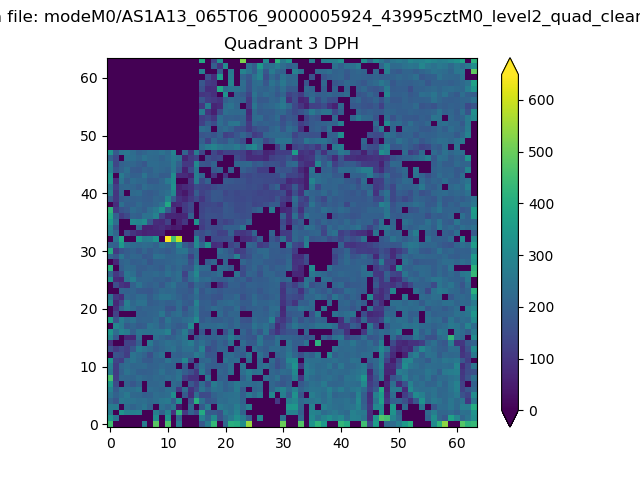 |
 |
Quadrant C |
| Plot type | Count rate plots | Images |
|---|---|---|
| Comparison with Poisson distribution Blue bars denote a histogram of data divided into 1 sec bins. Red curve is a Poisson curve with rate = median count rate of data. |
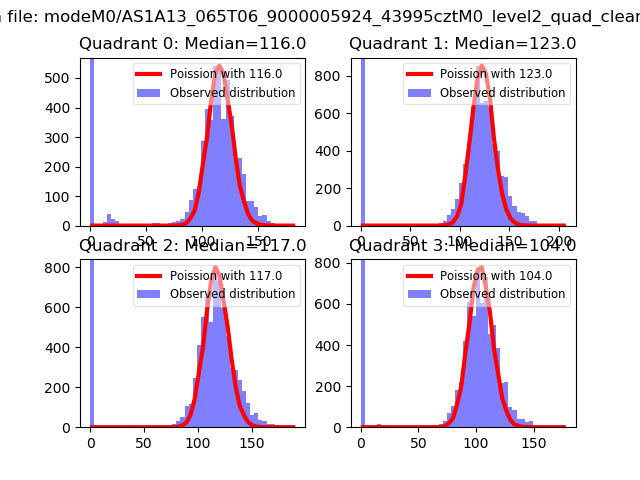 |
 |
| Quadrant-wise count rates Data is divided into 100 sec bins |
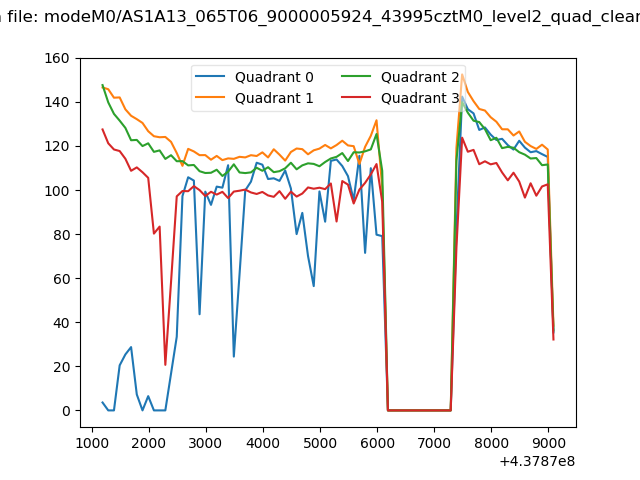 |
|
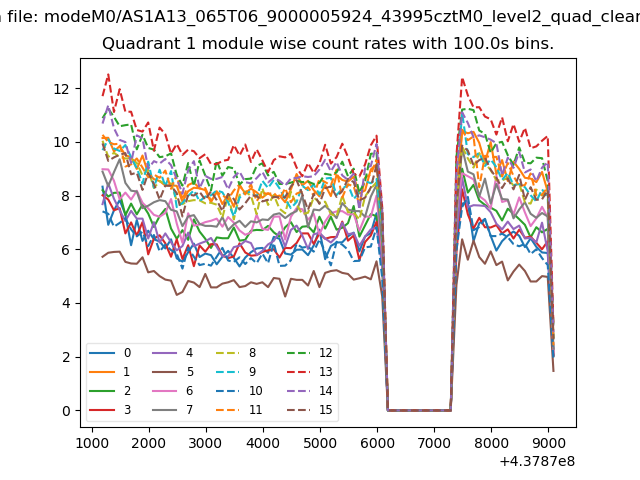
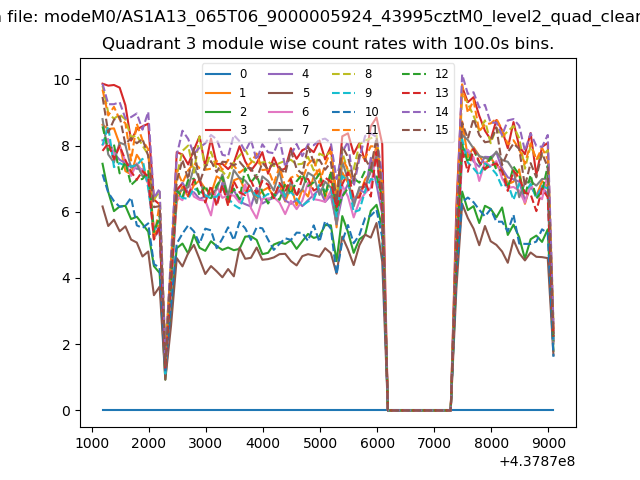
| Module-wise count rates for Quadrant A Data is divided into 100 sec bins |
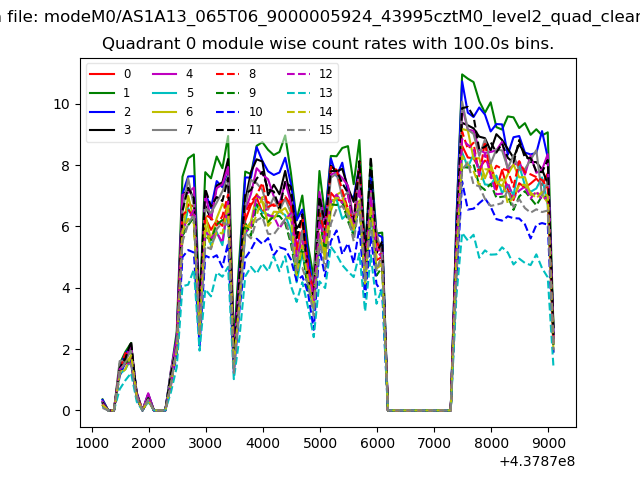 |
 |
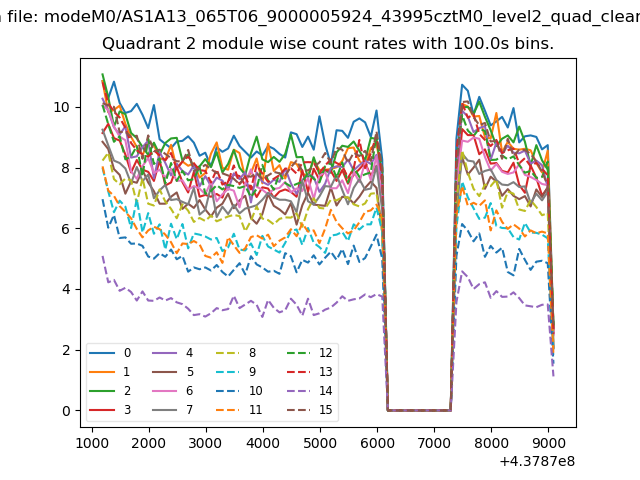
| Module-wise count rates for Quadrant B Data is divided into 100 sec bins |
 |
 |
| Module-wise count rates for Quadrant C Data is divided into 100 sec bins |
 |
 |
| Module-wise count rates for Quadrant D Data is divided into 100 sec bins |
 |
 |
| Parameter | Plot |
|---|---|
| CZT HV Monitor | 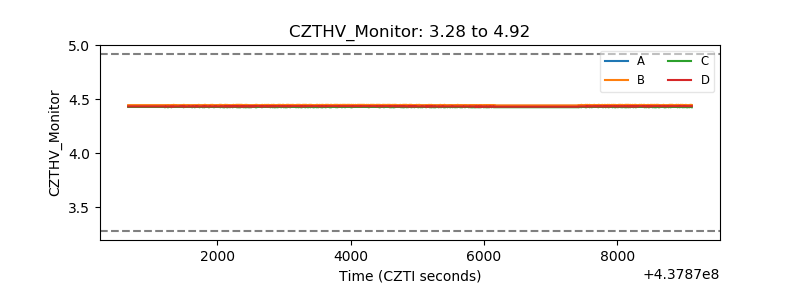 |
| D_VDD | 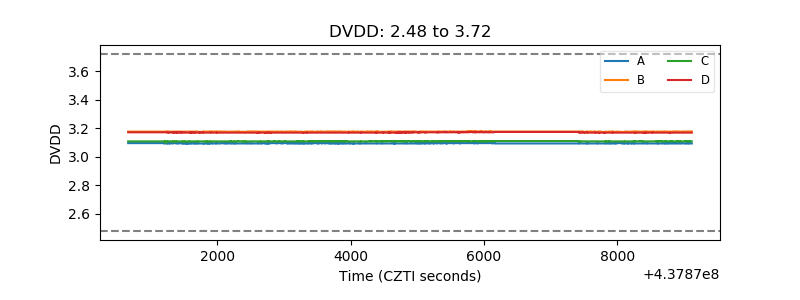 |
| Temperature 1 | 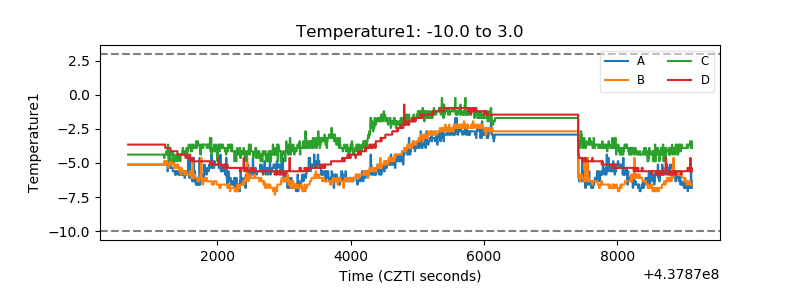 |
| Veto HV Monitor | 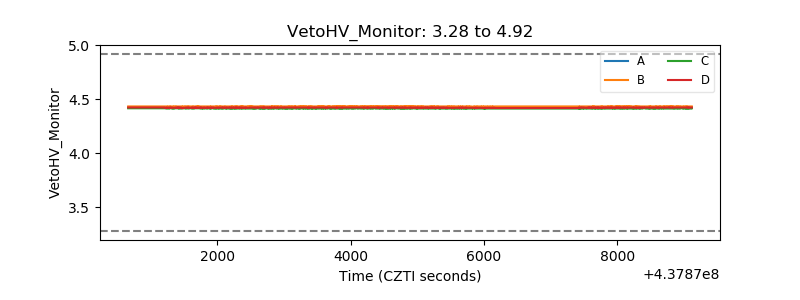 |
| Veto LLD | 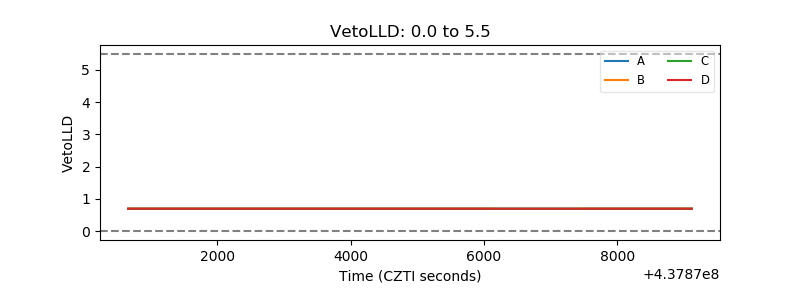 |
| Alpha Counter | 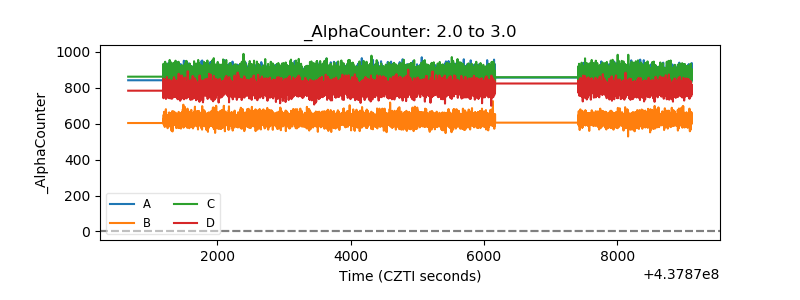 |
| _CPM_Rate | 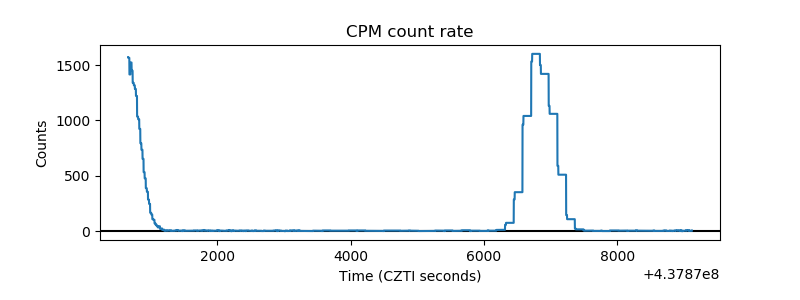 |
| CZT Counter | 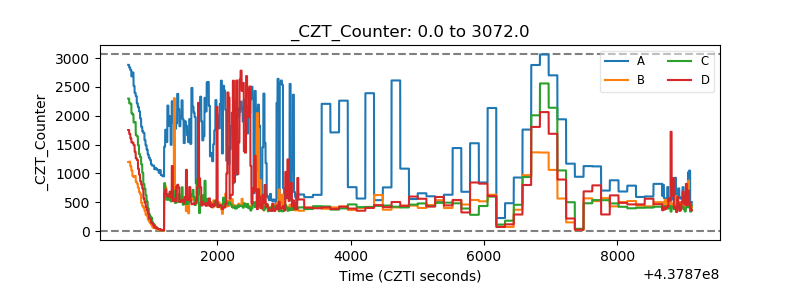 |
| +2.5 Volts monitor | 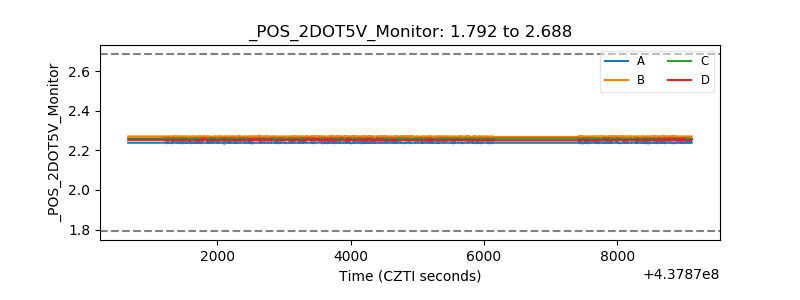 |
| +5 Volts monitor | 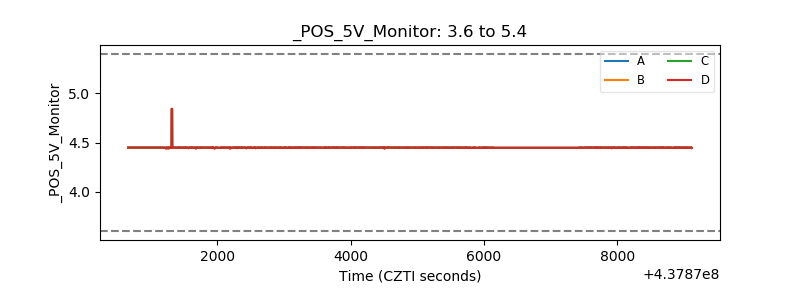 |
| _ROLL_ROT | 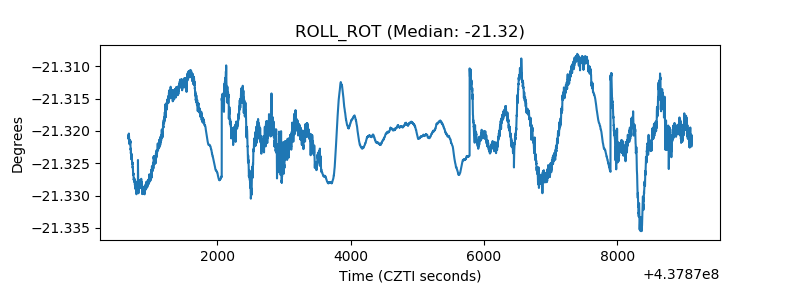 |
| _Roll_DEC |  |
| _Roll_RA | 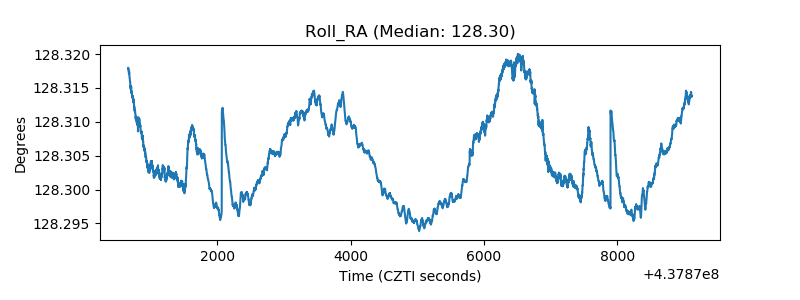 |
| Veto Counter | 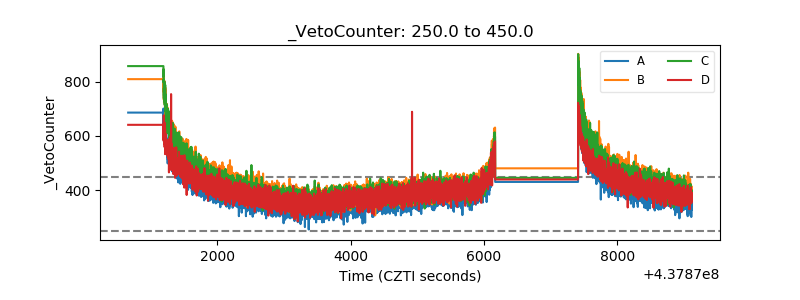 |