| Param | Original file | Final file |
|---|---|---|
| Filename | modeM0/AS1A13_034T03_9000005926_43997cztM0_level2.fits | modeM0/AS1A13_034T03_9000005926_43997cztM0_level2_quad_clean.evt |
| Size (bytes) | 449,809,920 | 110,531,520 |
| Size | 429.0 MB | 105.4 MB |
| Events in quadrant A | 5,414,312 | 713,693 |
| Events in quadrant B | 3,366,081 | 775,638 |
| Events in quadrant C | 3,491,797 | 736,232 |
| Events in quadrant D | 3,871,248 | 666,521 |
| Mode M9 | |||
|---|---|---|---|
| Quadrant | BADHDUFLAG | Total packets | Discarded packets |
| A | 0 | 16 | 0 |
| B | 0 | 17 | 0 |
| C | 0 | 17 | 0 |
| D | 0 | 17 | 0 |
| Mode SS | |||
|---|---|---|---|
| Quadrant | BADHDUFLAG | Total packets | Discarded packets |
| A | 0 | 132 | 0 |
| B | 0 | 132 | 0 |
| C | 0 | 132 | 0 |
| D | 0 | 132 | 0 |
| Mode M0 | |||
|---|---|---|---|
| Quadrant | BADHDUFLAG | Total packets | Discarded packets |
| A | 0 | 20979 | 2 |
| B | 0 | 14240 | 2 |
| C | 0 | 14646 | 2 |
| D | 0 | 15973 | 2 |
| Quadrant | Total seconds | Saturated seconds | Saturation percentage |
|---|---|---|---|
| A | 6523 | 470 | 7.205274% |
| B | 6523 | 174 | 2.667484% |
| C | 6522 | 134 | 2.054584% |
| D | 6522 | 203 | 3.112542% |
Noise dominated data is calculated using 1-second bins in cleaned event files. If a bin has >2000 counts, and if more than 50% of those come from <1% of pixels, then it is considered to be noise-dominated and hence unusable.
| Quadrant | # 1 sec bins | Bins with >0 counts | Bins with >2000 counts | High rate bins dominated by noise | Noise dominated (total time) | Noise dominated (detector-on time) | Marked lightcurve |
|---|---|---|---|---|---|---|---|
| A | 7603 | 6524 | 211 | 211 | 2.78% | 3.23% | 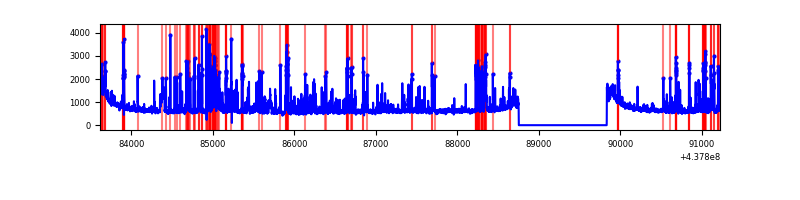 |
| B | 7603 | 6524 | 29 | 29 | 0.38% | 0.44% | 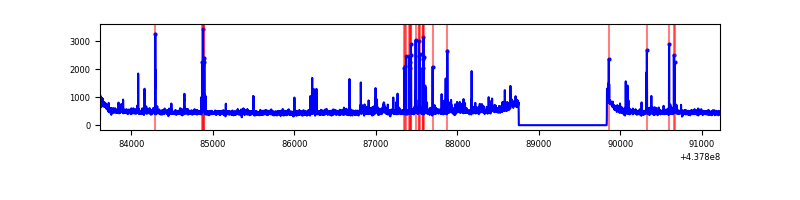 |
| C | 7602 | 6523 | 58 | 58 | 0.76% | 0.89% | 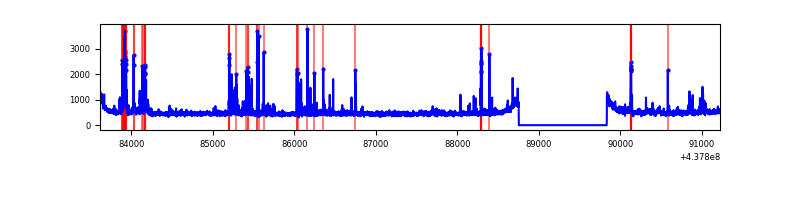 |
| D | 7602 | 6523 | 114 | 114 | 1.50% | 1.75% | 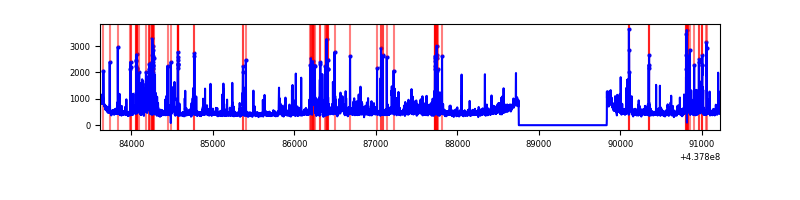 |
Top three noisy pixels from each quadrant. If the there are fewer than three noisy pixels in the level2.evt file, extra rows are filled as -1
| Pixel properties | Quadrant properties | ||||||
|---|---|---|---|---|---|---|---|
| Quadrant | DetID | PixID | Counts | Sigma | Mean | Median | Sigma |
| A | 10 | 83 | 1186956 | 7605.14 | 748 | 733 | 156.0 |
| A | 14 | 238 | 870974 | 5579.31 | 748 | 733 | 156.0 |
| A | 15 | 223 | 439604 | 2813.7 | 748 | 733 | 156.0 |
| B | 5 | 172 | 105794 | 705.62 | 768 | 743 | 148.9 |
| B | 15 | 36 | 65260 | 433.36 | 768 | 743 | 148.9 |
| B | 0 | 183 | 33546 | 220.34 | 768 | 743 | 148.9 |
| C | 14 | 254 | 359433 | 2002.4 | 761 | 764 | 179.1 |
| C | 3 | 233 | 121908 | 676.33 | 761 | 764 | 179.1 |
| C | 2 | 14 | 43322 | 237.59 | 761 | 764 | 179.1 |
| D | 1 | 52 | 307703 | 1584.88 | 753 | 725 | 193.7 |
| D | 5 | 235 | 262801 | 1353.06 | 753 | 725 | 193.7 |
| D | 13 | 249 | 245202 | 1262.2 | 753 | 725 | 193.7 |
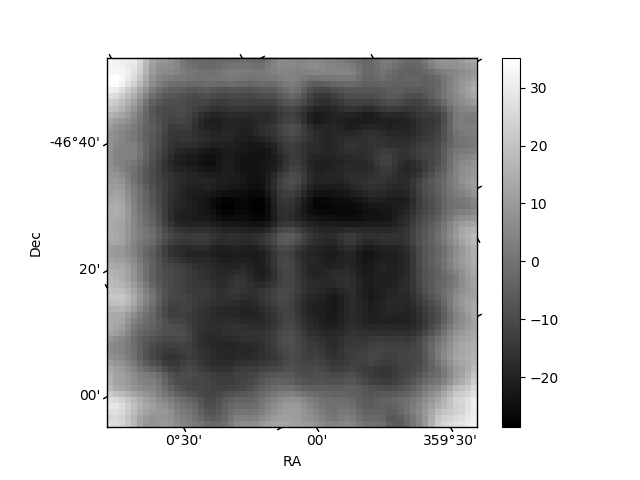
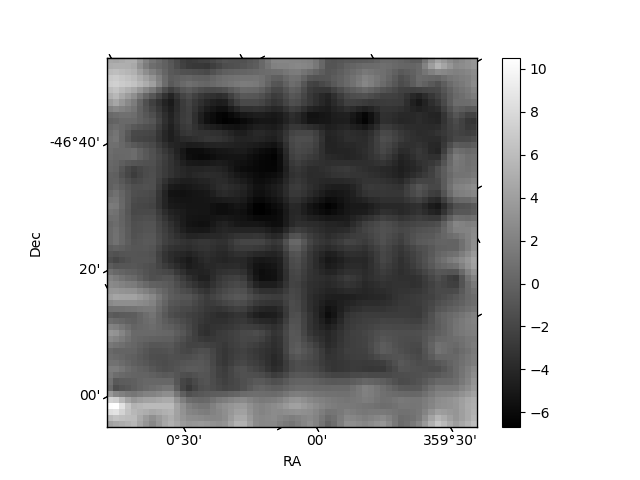
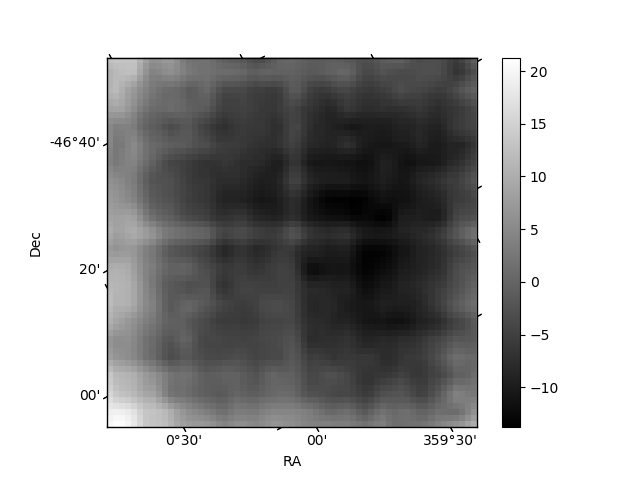
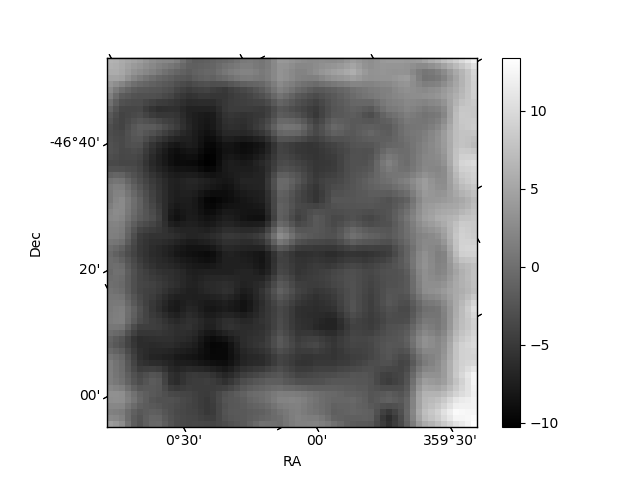
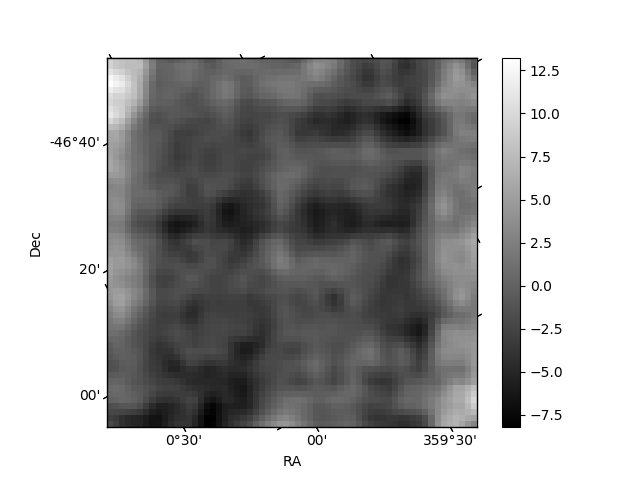
Histogram calculated using DETX and DETY for each event in the final _common_clean file
| Quadrant A | 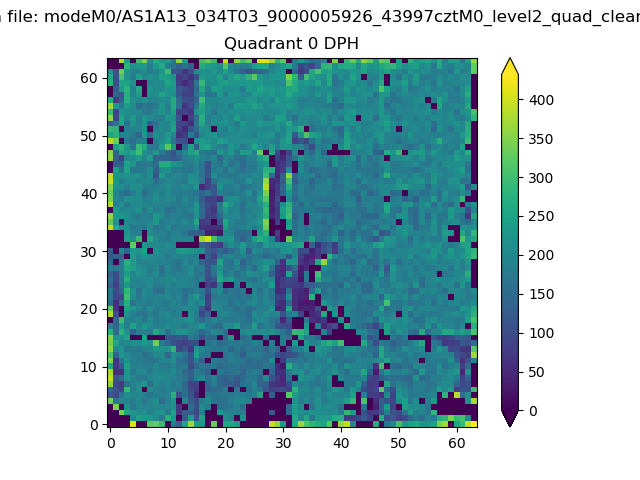 |
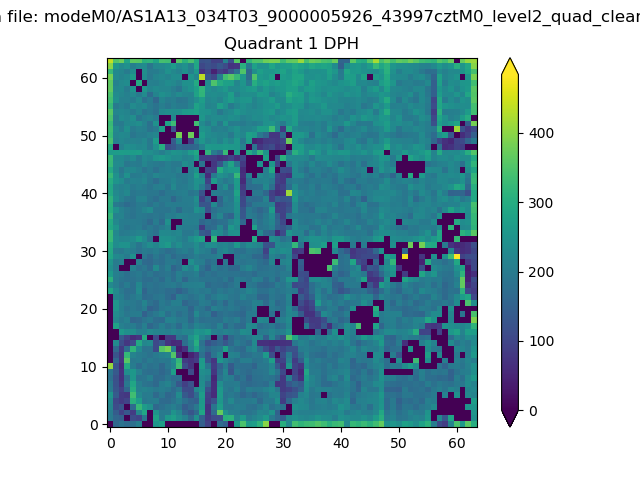 |
Quadrant B |
|---|---|---|---|
| Quadrant D | 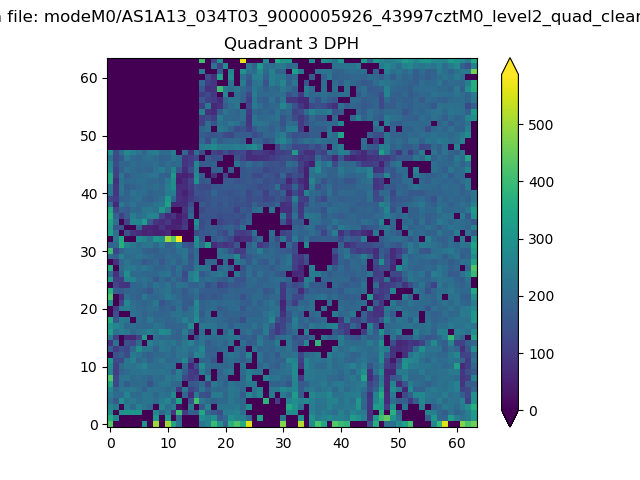 |
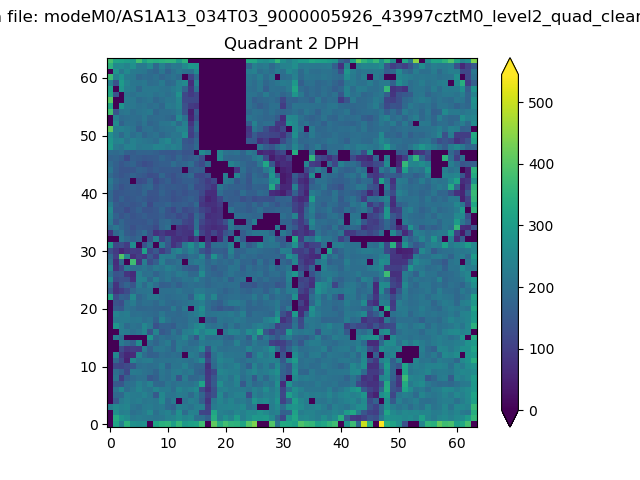 |
Quadrant C |
| Plot type | Count rate plots | Images |
|---|---|---|
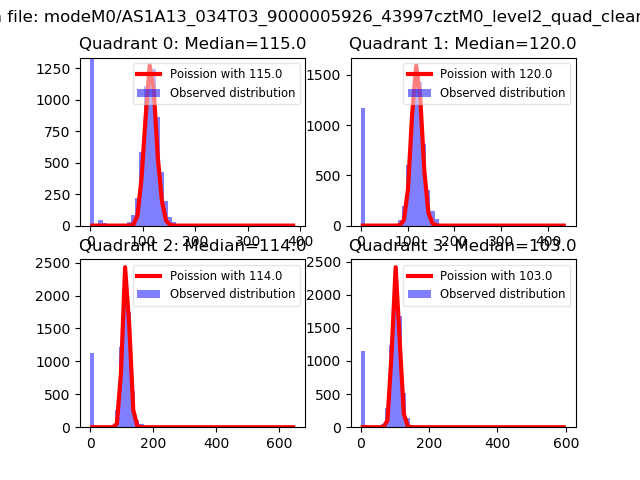
| Comparison with Poisson distribution Blue bars denote a histogram of data divided into 1 sec bins. Red curve is a Poisson curve with rate = median count rate of data. |
 |
 |
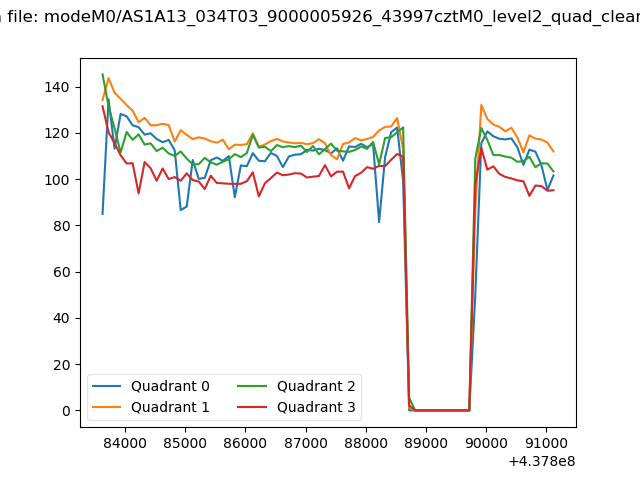
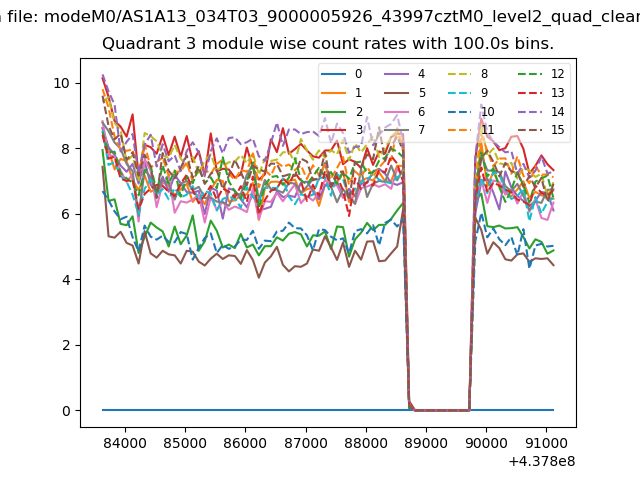
| Quadrant-wise count rates Data is divided into 100 sec bins |
 |
|
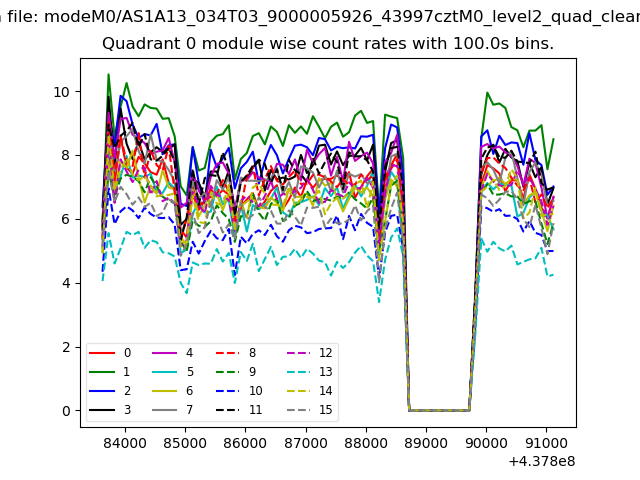
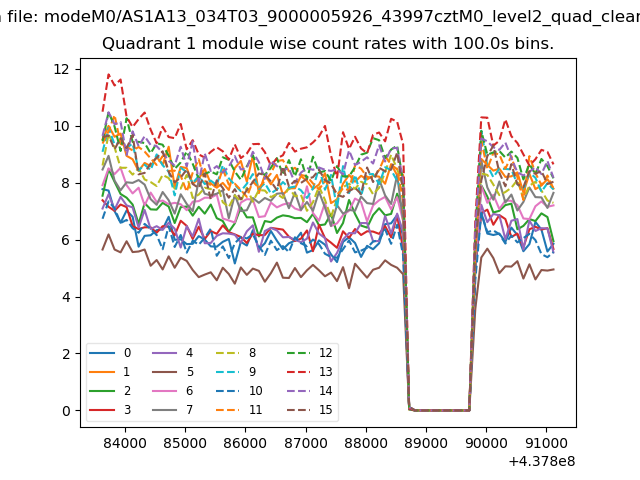
| Module-wise count rates for Quadrant A Data is divided into 100 sec bins |
 |
 |
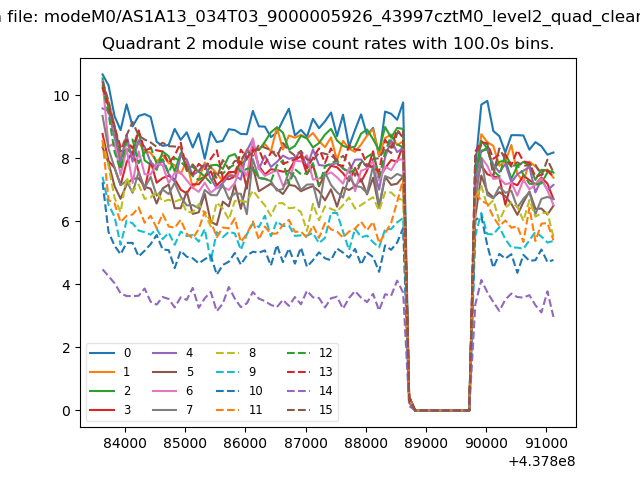
| Module-wise count rates for Quadrant B Data is divided into 100 sec bins |
 |
 |
| Module-wise count rates for Quadrant C Data is divided into 100 sec bins |
 |
 |
| Module-wise count rates for Quadrant D Data is divided into 100 sec bins |
 |
 |
| Parameter | Plot |
|---|---|
| CZT HV Monitor | 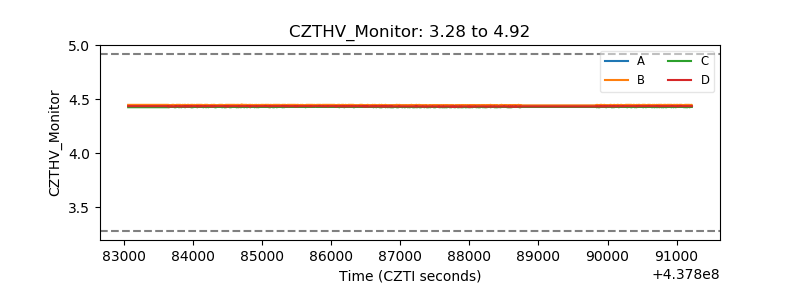 |
| D_VDD | 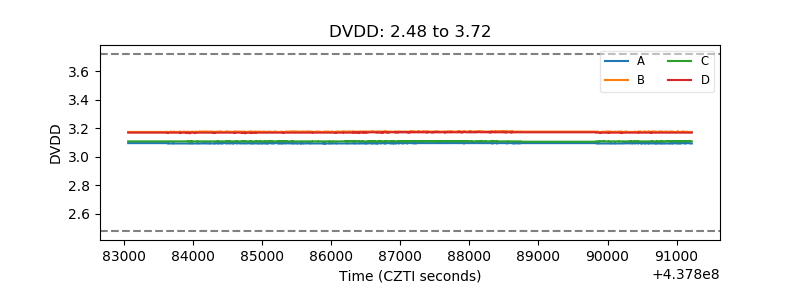 |
| Temperature 1 | 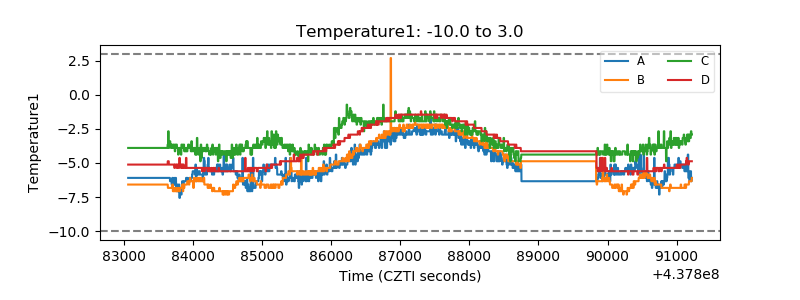 |
| Veto HV Monitor | 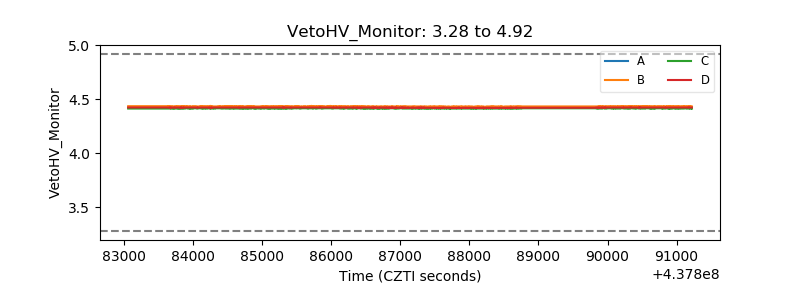 |
| Veto LLD | 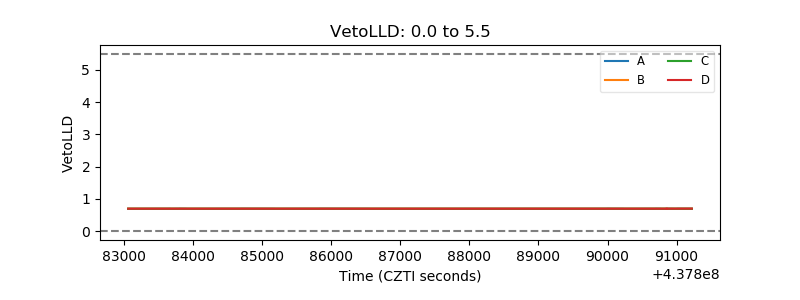 |
| Alpha Counter | 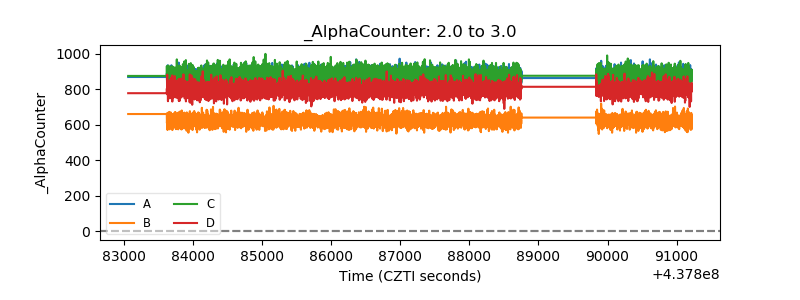 |
| _CPM_Rate | 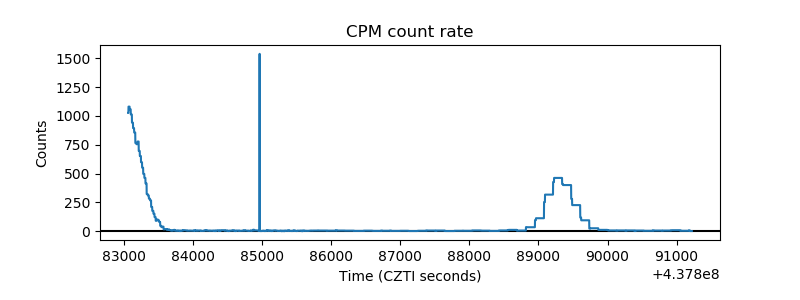 |
| CZT Counter | 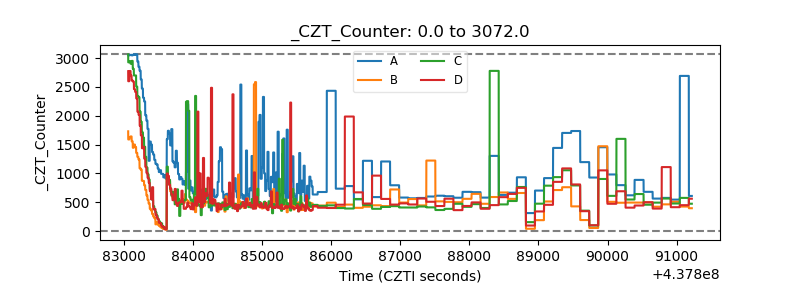 |
| +2.5 Volts monitor |  |
| +5 Volts monitor | 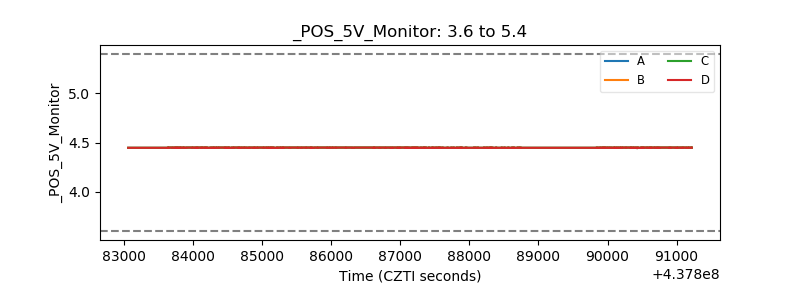 |
| _ROLL_ROT | 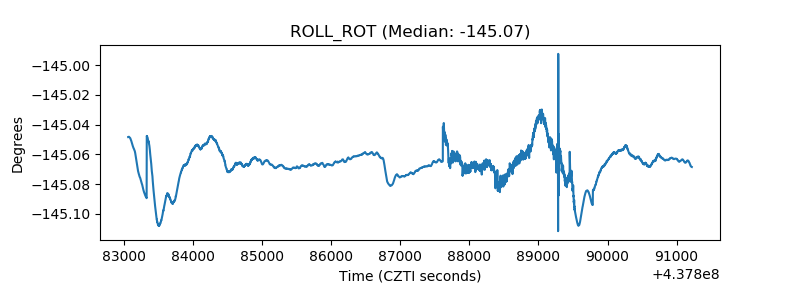 |
| _Roll_DEC | 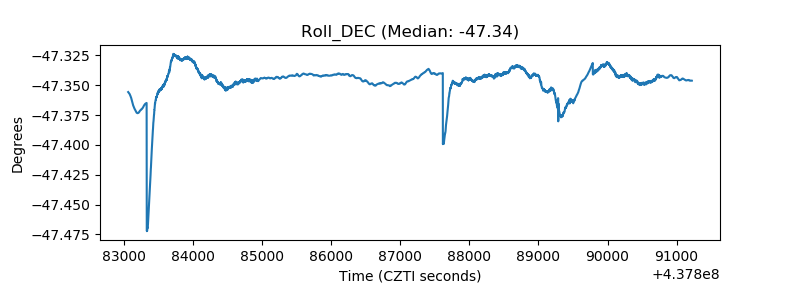 |
| _Roll_RA | 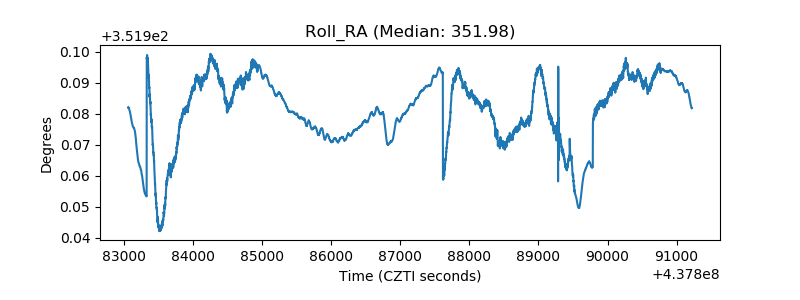 |
| Veto Counter | 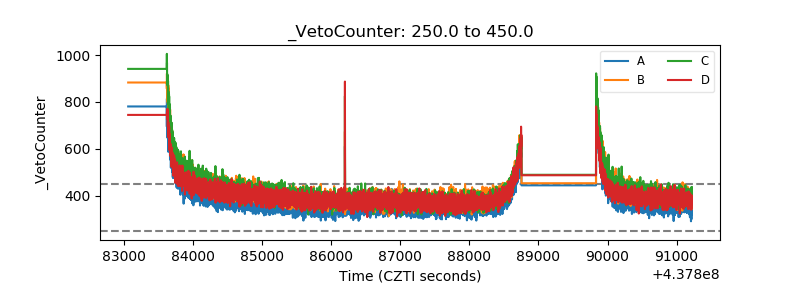 |